

This post is the second article in our Tactical Guide to a Shorter Cycle Time five-part series. Read the previous post here.
You discover your engineering team has a long Cycle Time compared to the rest of the organization or compared to the industry’s top performers. Now what?
When we ran an analysis on 19k+ contributors’ data, we uncovered that of all the identified key drivers, a low Time to Open (time between the earliest commit in a pull request and when the pull request is opened) had the highest correlation to a short Cycle Time.
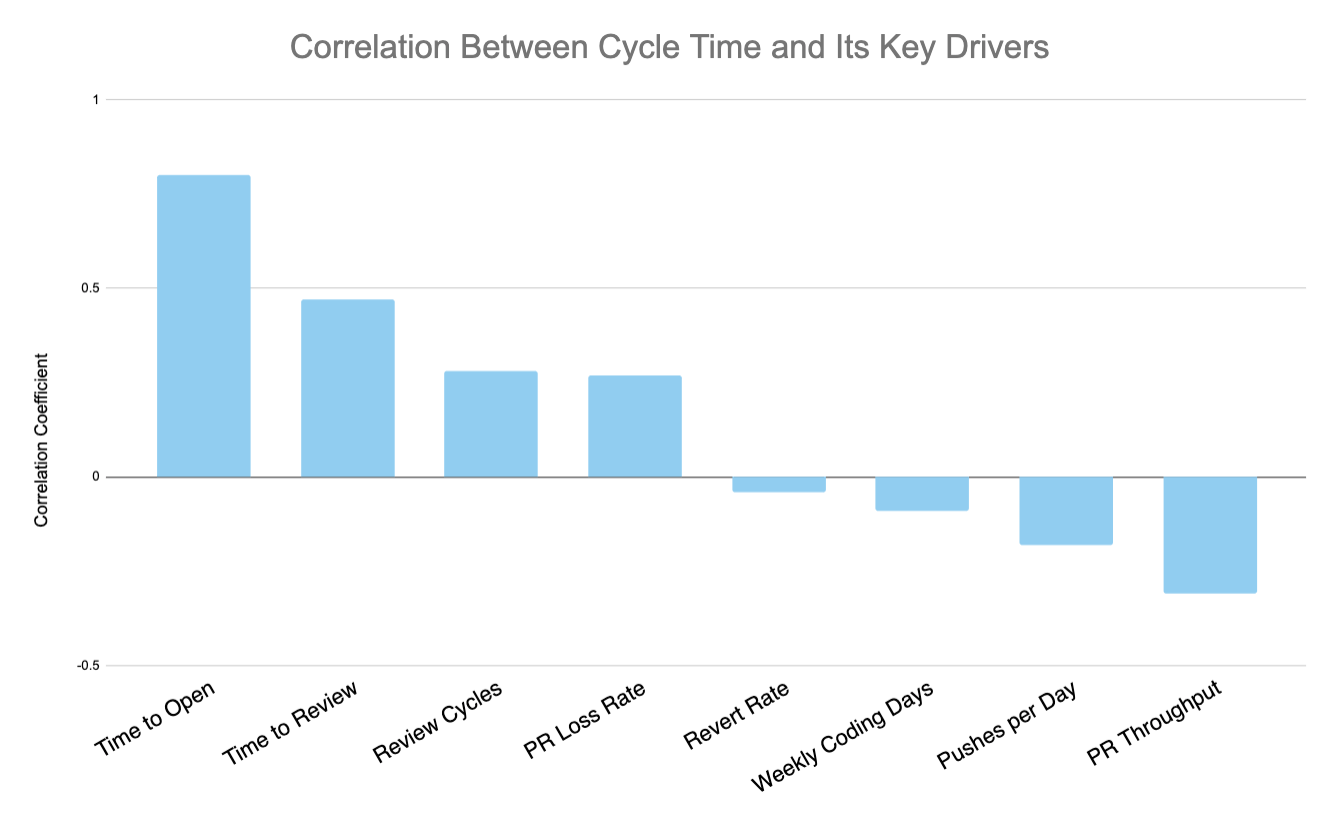
The correlation coefficient chart above illustrates that Time to Open has the highest impact on overall Cycle Time of all analyzed drivers.
Since Time to Open is a component of Cycle Time, it’s natural to expect some correlation. What’s remarkable, however, is that work practices that take place before a pull request is opened have a higher impact on Cycle Time than those that take place after (including the Code Review process).
This data supports the most important principle of Continuous Delivery: keeping batch sizes small has significant positive downstream effects. By virtue of being small and discreet, each change will easily move through each phase of the software delivery process:
- Review will happen sooner because reviewers perceive the work to be less challenging and time-consuming to review.
- Approval will happen sooner because there will be fewer back-and-forths and the revisions will be less substantial.
- Deploy will happen sooner since less work in progress combined with lower risk encourages developers to deploy quickly.
Time to Open is thus one of the most impactful software metrics and serves as a great starting point for optimizing your Cycle Time.
Scoping the Opportunity for Improvement
Before going in and making changes to improve Time to Open, you’ll want to have an understanding of what “good” looks like. You can look at this metric team-to-team to see how your top performers are doing:
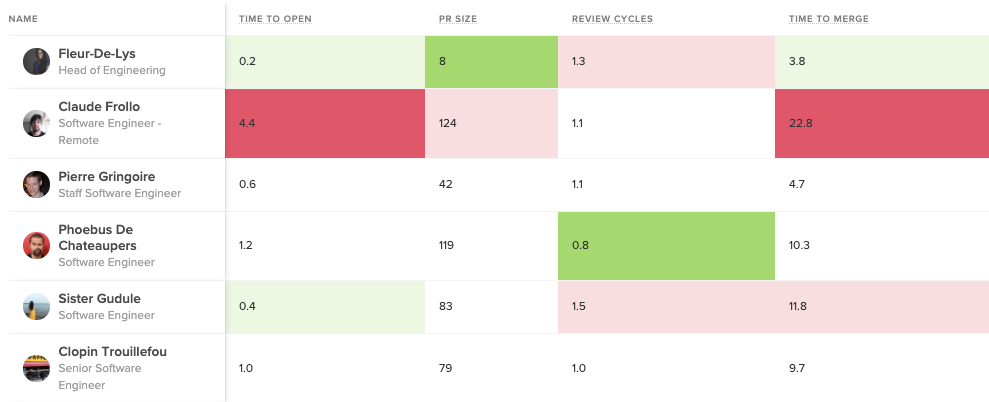
Velocity lets you compare by team or by individual to the organization’s average. Bright green represents the top 5%, while bright red represents bottom 5% in each metric.
You can also gauge the performance of your entire organization by comparing them to the industry average. This will help you understand your starting point and how to benchmark progress.
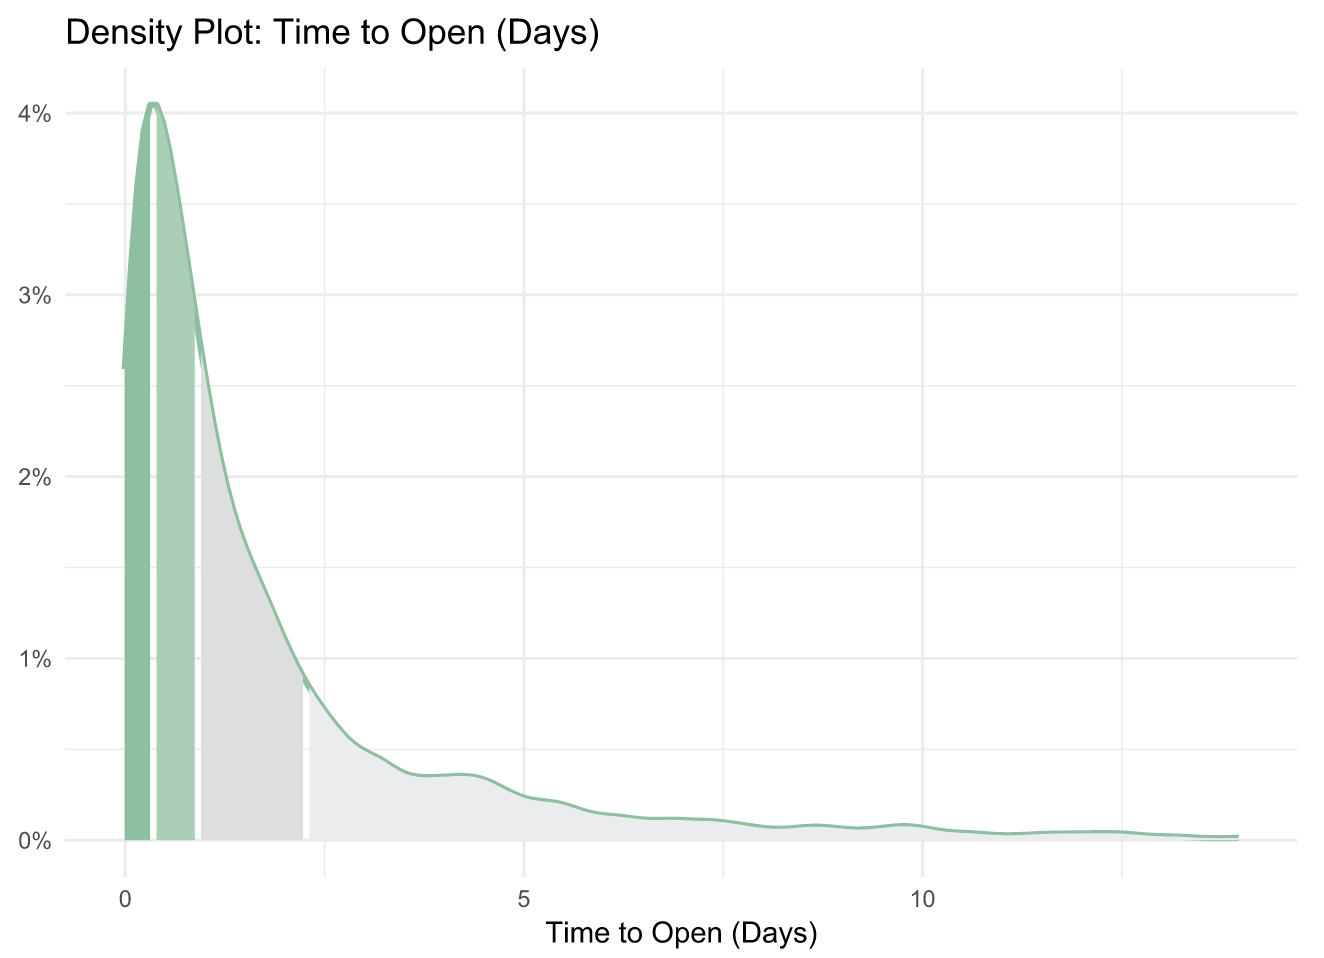
Our data analysis reveals the following benchmarks for Time to Open:
- The top 25% of engineering orgs open pull requests in under 3 hours on average
- The industry median is about one day
- The bottom 25% take over two days to open a pull request
Once you know how your teams and your organization as a whole are doing, you can start diving into where, specifically, your team is experiencing friction in the beginning of your software delivery process.
Time to Open Diagnostics
A long Time to Open indicates one or several of three things might be happening on your team:
- Batch sizes are too large, evidenced by the Pull Request Size metric
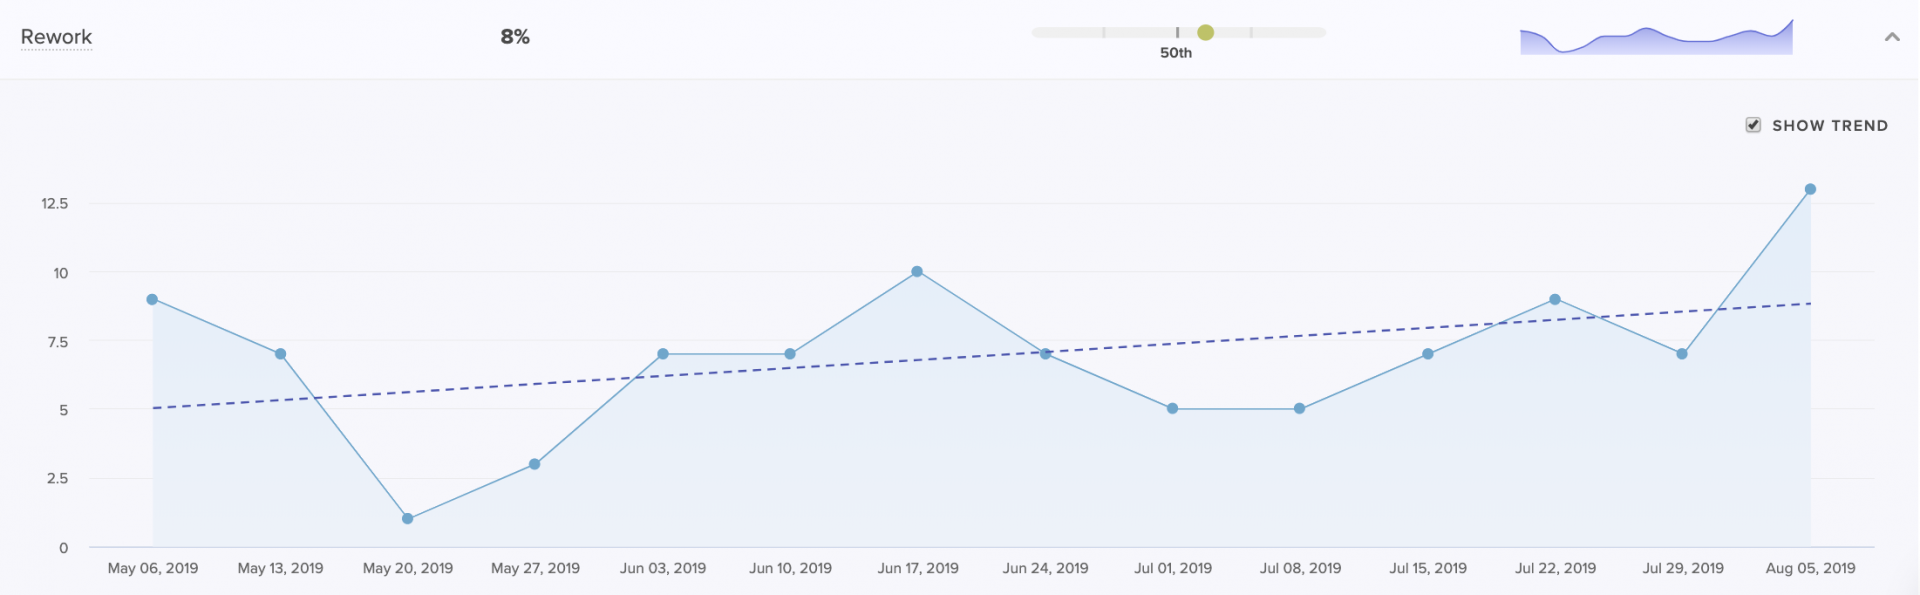
- There is a high amount of code churn, evidenced by the Rework metric
- There’s a lot of multi-tasking and task-switching, evidenced by the amount of Work in Progress there is at any one given time.
Use the software metrics below as signals in conjunction with qualitative data to understand how to improve your Time to Open.
Pull Request Size
Look at pull request sizes (i.e., batch sizes) to see whether your team is consistently pushing small, easy-to-review changes. Our analysis shows that high-performing teams typically open PRs that are smaller than 150 LOC.
Look at this metric for the entire organization, each team, and then individuals to isolate the problem.
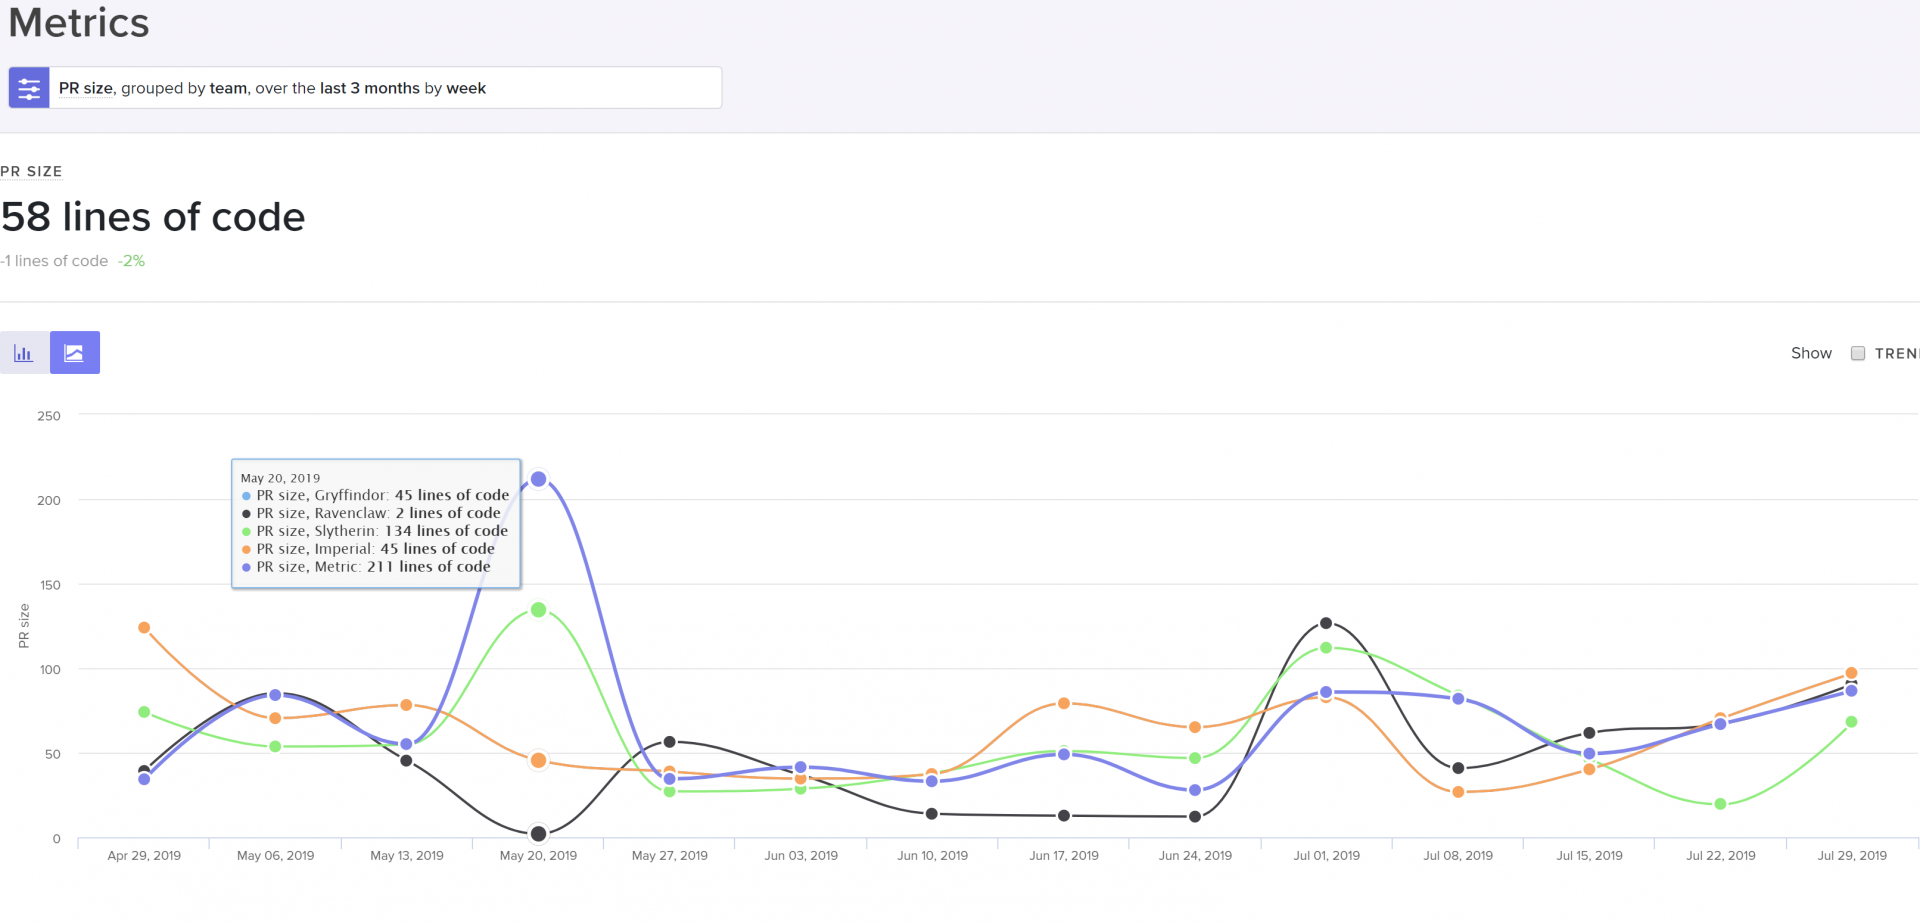
Velocity lets you look at PR size grouped by team, cohort, or individual to help identify the scope of the problem.
If PR Size is high, it may indicate:
- The practice of pushing small batch sizes isn’t viewed as important,
- There’s a lack of experience with keeping batch sizes small,
- Your team hasn’t built up this habit yet
When large PR sizes are systemic across your team or organization, bring this data into discussions with your managers to find out why the team feels comfortable with large changes. Encourage teams to optimize this metric until it drives down Cycle Time and the effects of less bottlenecks are felt.
When this metric is high for an individual, it presents a coaching opportunity. Encourage mentors to show how to approach problems with smaller, more incremental changes.
Rework
We define Rework, or code churn, as a percentage of code changes in which an engineer rewrites code that they recently updated (within the past three weeks). We’ve found that top-performing teams keep their Rework under 4%, but this number can vary.
While some Rework is a natural and expected part of the software development process, high or increased Rework indicates wasted effort that is both slowing down productivity and frustrating engineers.
Velocity provides a Coaching Summary for managers to see how Rework of a particular team or individual compares to the rest of the org.
High Rework on the team or organization level can be a signal that there was a misalignment between product and engineering. It often indicates unclear technical direction or consistently late changing product requirements.
When Rework is high for individuals, it’s often a symptom of a lack of experience. Newer team members tend to have higher Rework. If this isn’t decreasing significantly throughout the onboarding of a team member or cohort, consider improving onboarding or mentoring processes.
Work in Progress (WIP)
A principle of lean product development, often discussed in the context of Kanban, is limiting Work in Progress. Practically, this means your team should be consistently progressing the unit of work that is closest to complete so that context-switching is minimal.
Looking at WIP per contributor helps you understand whether your teams are juggling multiple tracks of work, slowing the time to completion for each.
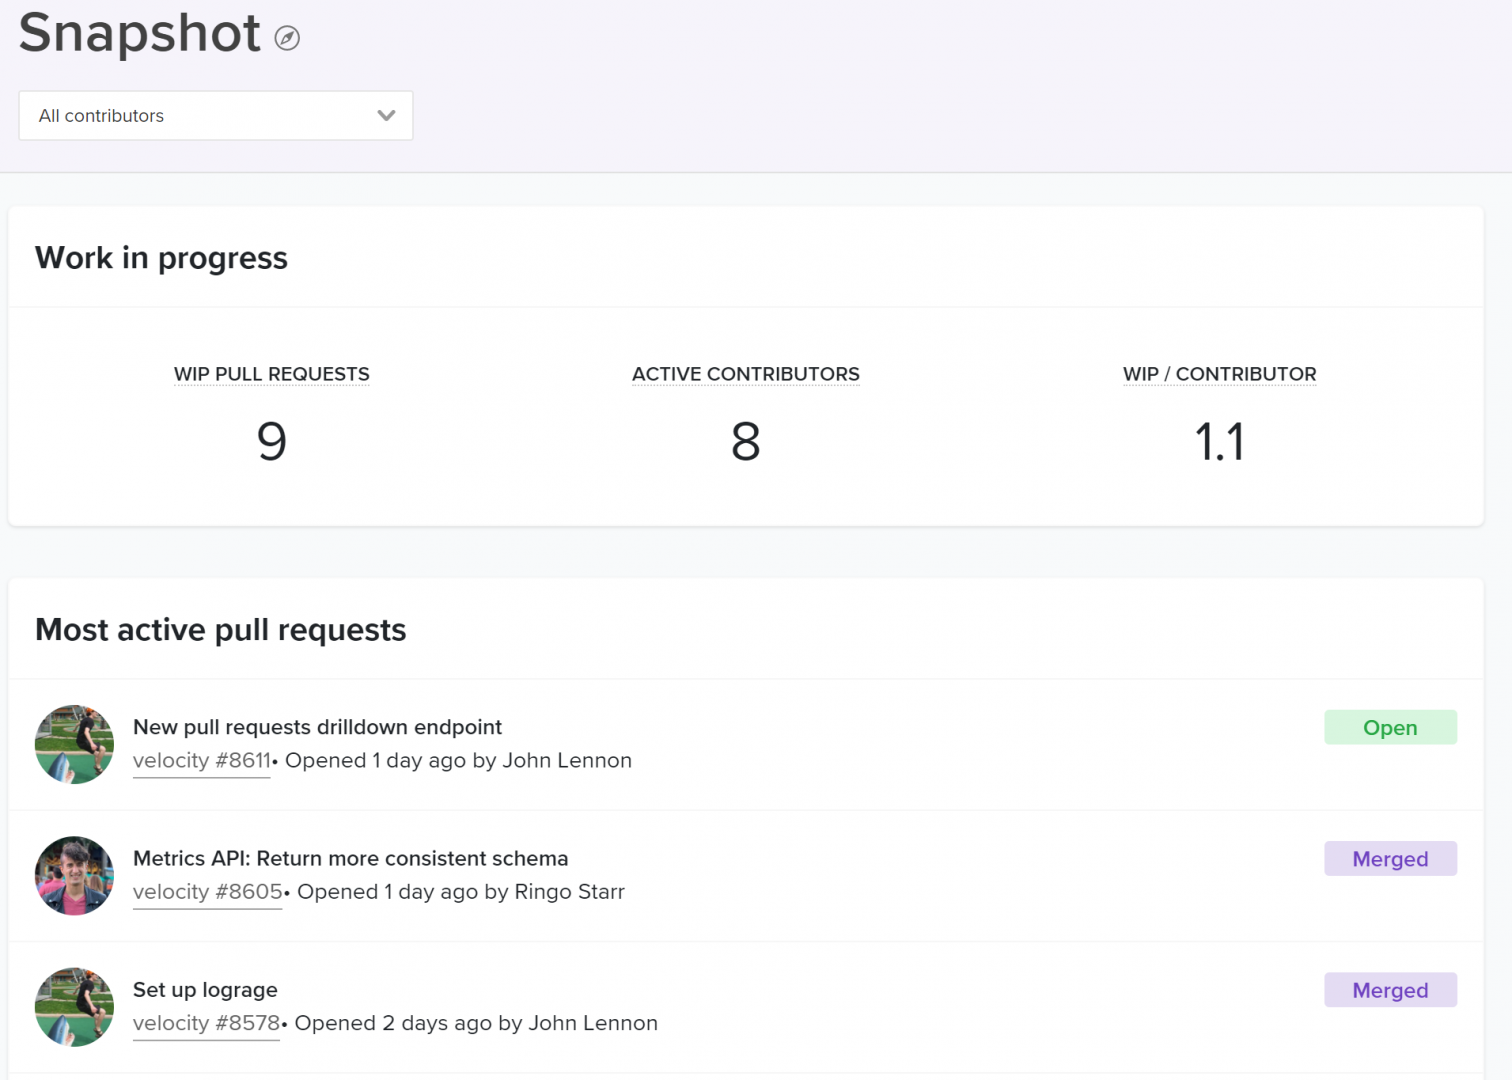
Velocity lets you see the WIP per contributor with a breakdown of the most active pull requests below.
High WIP for your team or organization is another indication of unclear or conflicting priorities, which cause team members to abandon work and move onto the next project. Similarly, high WIP per Contributor can be systemic in a team with too many dependencies. When team members are constantly blocked, they have no choice but to move forward onto other tracks of work.
High WIP for an individual can be indicative of a bad work habit and should be addressed by mentors or managers through coaching.
What’s Next
The effects of improving Time to Open will immediately improve Cycle Time and team morale. Once engineers feel unblocked and see the impact of their work more frequently, they’ll be eager to uncover more opportunities to further optimize how they work. This will set in motion a Virtuous Circle of Software Delivery which managers can use to facilitate a culture of continuous improvement.
To learn where your team should focus next, stay tuned for the upcoming articles in our Tactical Guide to a Shorter Cycle Time five-part series:
- Part I: The Virtuous Circle of Software Delivery
- Part II: The Single Greatest Lever in Shortening Cycle Time
- Part III: How to Stop Code Review from Bottlenecking Shipping
- Part IV: Keep Code Review from Being a Waste of Everyone’s Time
- Part V: The Last Mile to True Continuous Delivery
Or, if you can’t wait, request a demo of Velocity, our Software Engineering Intelligence platform and have a data specialist guide you through each step within Velocity.
Get articles like this in your inbox.
Trending from Code Climate
1.
Engineering Leaders Share Thoughts on Leadership in Disrupted Times in a New Survey
For engineering teams, disruption to the business can have a significant impact on the ability to deliver and meet goals. These disruptions are often a result of reprioritization and budget changes on an organizational level, and are amplified during times of transition or economic instability.

2.
Built In’s 2023 Best Places to Work — Why Code Climate Made the List
At Code Climate, we value collaboration and growth, and strive for greatness within our product and workplace. For us, this means fostering a supportive, challenging, people-first culture. Thanks to an emphasis on these values, we’ve earned spots on three of Built In’s 2023 Best Places to Work awards lists, including New York City Best Startups to Work For, New York City Best Places to Work, and U.S. Best Startups to Work For.

3.
Turnkey Deployment Delivers Day-One Value for Yottaa
Learn how Yottaa gained immediate value from Code Climate Velocity right out of the box.

Get articles like this in your inbox.
Get more articles just like these delivered straight to your inbox
Stay up to date on the latest insights for data-driven engineering leaders.