Leadership

“Meetings are expensive in person, and they’re even more expensive remotely. There’s a psychological overhead to bringing people together in a remote setting,” told us Noah Davis in his webinar on how engineering leaders can use data to run more effective remote meetings.
As teams go remote, the function of meetings changes. Team members lack context and use meetings to play catch-up rather than to discuss and make critical improvements. But when managers use remote meetings as status updates, they’re squandering the opportunity to help their team in the long-term.
In addition to advising hundreds of customers on data-driven best practices, Code Climate Co-Founder and VP of Customer Success, Noah Davis has nearly a decade of experience helping both developers and managers improve the speed and quality of engineering work.
"Assume best intentions of your engineers. Focus on the work, not the individual. Look for ways you can help."
In this webinar, Noah explained how to dig into engineering data from Velocity reports to get your team on the same page and keep meetings focused and productive. He shared actionable tips for spotting daily, weekly, and monthly trends in your data, so you can ensure that:
- Stand-ups are about unblocking engineers, not catching managers up
- Retros are about helping your team diagnose problems and process fault lines, not venting
- 1:1s are about constructive feedback and career development, not micromanaging
Noah pointed out that by walking into meetings already context-aware, you can replace check-ins with more informed conversations about how the team can stay on track.
In light of current global circumstances, our annual one-day conference for engineering leaders is going virtual, with a new, more interactive format. Over the course of six weeks, we’ll be hosting a series of remote fireside chats with senior engineering leaders from a range of industries. Each session will be followed by a Q&A with our guest, as well as a topical discussion moderated by our sponsor, LaunchDarkly.
The series kicks off on June 18th with our first session. From there, we’ll present a new chat every week, featuring leaders from Buffer, Netflix, Stripe, and more. Conversations will focus on ways to succeed in senior leadership by driving high performance in your organization. Topics include driving continuous improvement, upleveling managers with data, fostering a culture of diversity and inclusion, and maintaining engineering tempo at scale.
Follow us on Twitter and LinkedIn to learn more about our featured guests.
The Engineering Leadership Summit: Virtual Edition is sponsored by LaunchDarkly, the feature management platform developers and operations teams use to eliminate risk from their software development cycles.

When global circumstances required our team to go completely remote, we knew things would be tough. Team members wouldn’t just be working from home; they’d be working from home during a time of intense fear and uncertainty, with a myriad of new concerns and distractions. We expected that engineering activity would decline as a result, and we were understanding — as our VP of Engineering, Ale Paredes, explained during a panel on working remotely through the crisis, “We’re not trying to behave as if it’s business as usual, because it’s not business as usual.”
But when Ale checked the team’s productivity metrics, she was surprised by what she found. After we made the switch to a distributed workflow, many engineers actually started working more. Still, despite logging more time in the codebase, they were getting less done.
To find out why the team wasn’t making progress, Ale dug deeper into the data. Not only did she find answers, she used that information to develop better ways to support the team.
Engineering Metrics Served as a Diagnostic Tool
Ale and the engineering team regularly track certain key metrics, using data about Pull Request Throughput, Cycle Time, and Incidents to get a sense of how they’re doing. They review this information on a bi-weekly basis, so they can address red flags as early as possible or replicate processes that are having a positive impact.
When something appears to be trending in a concerning direction, the team drills down deeper into the data, then uses that information as a starting point for troubleshooting conversations.
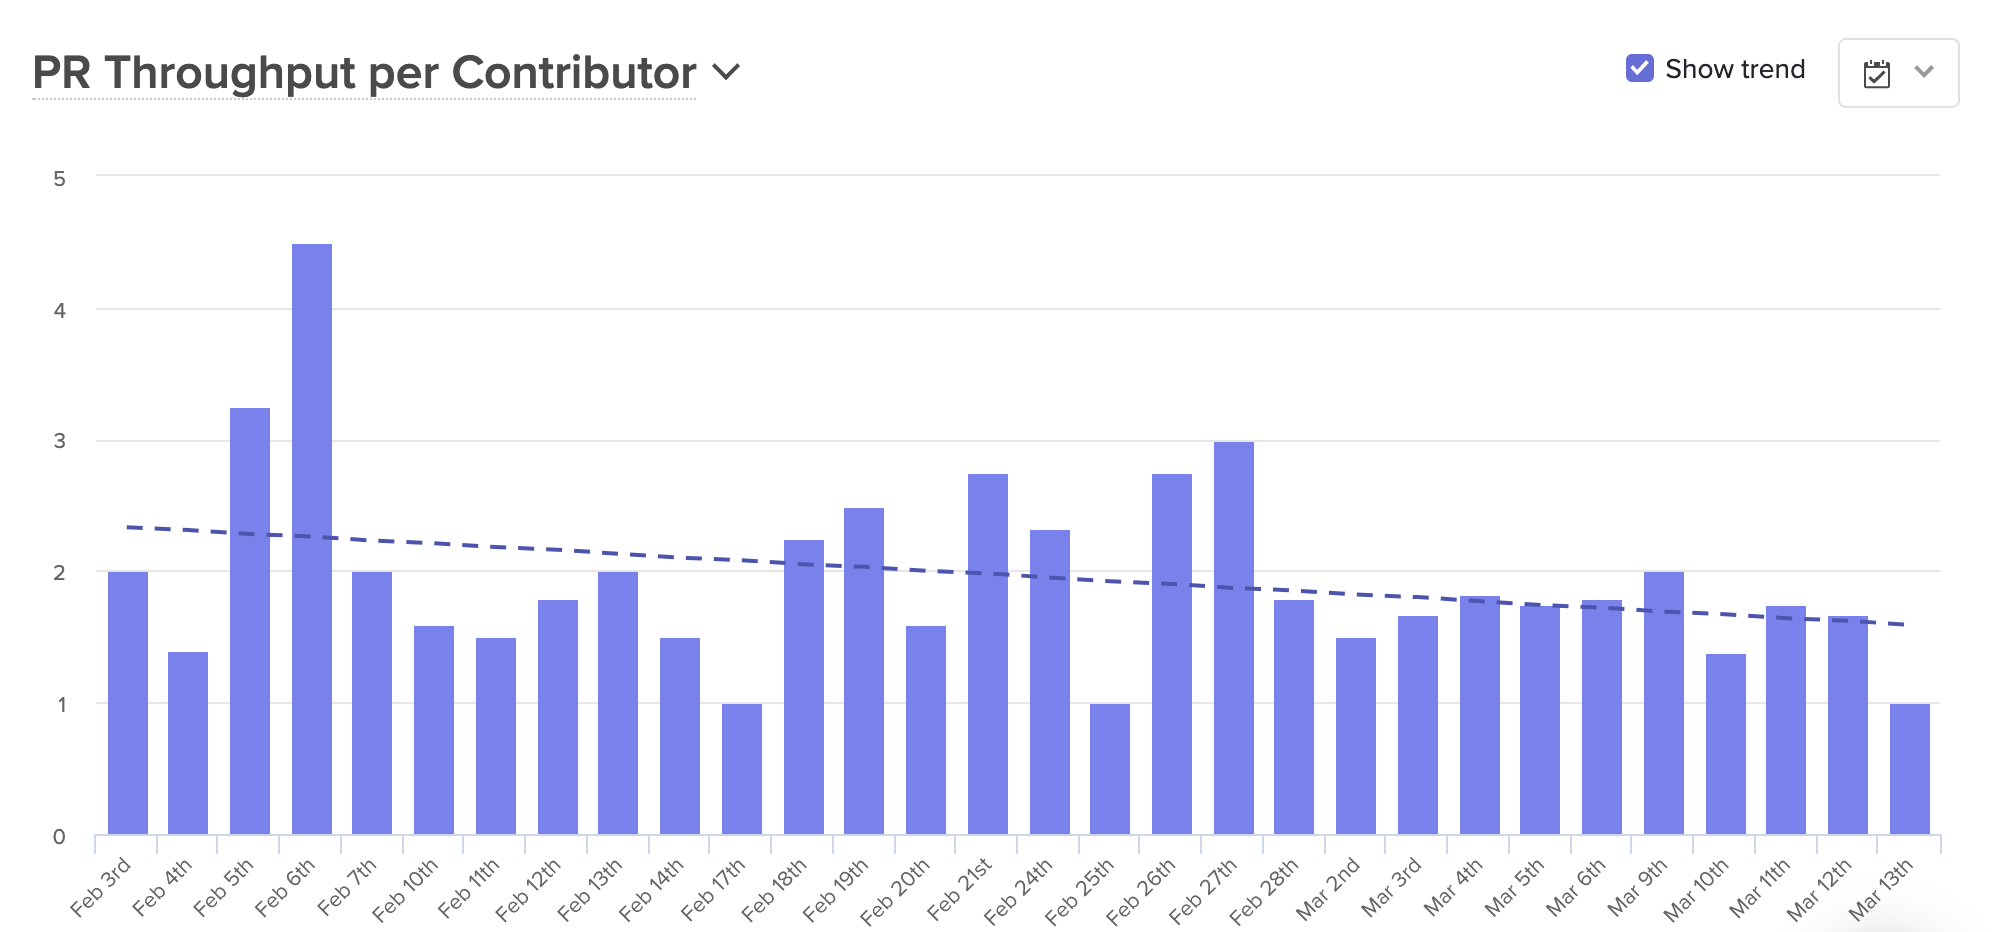
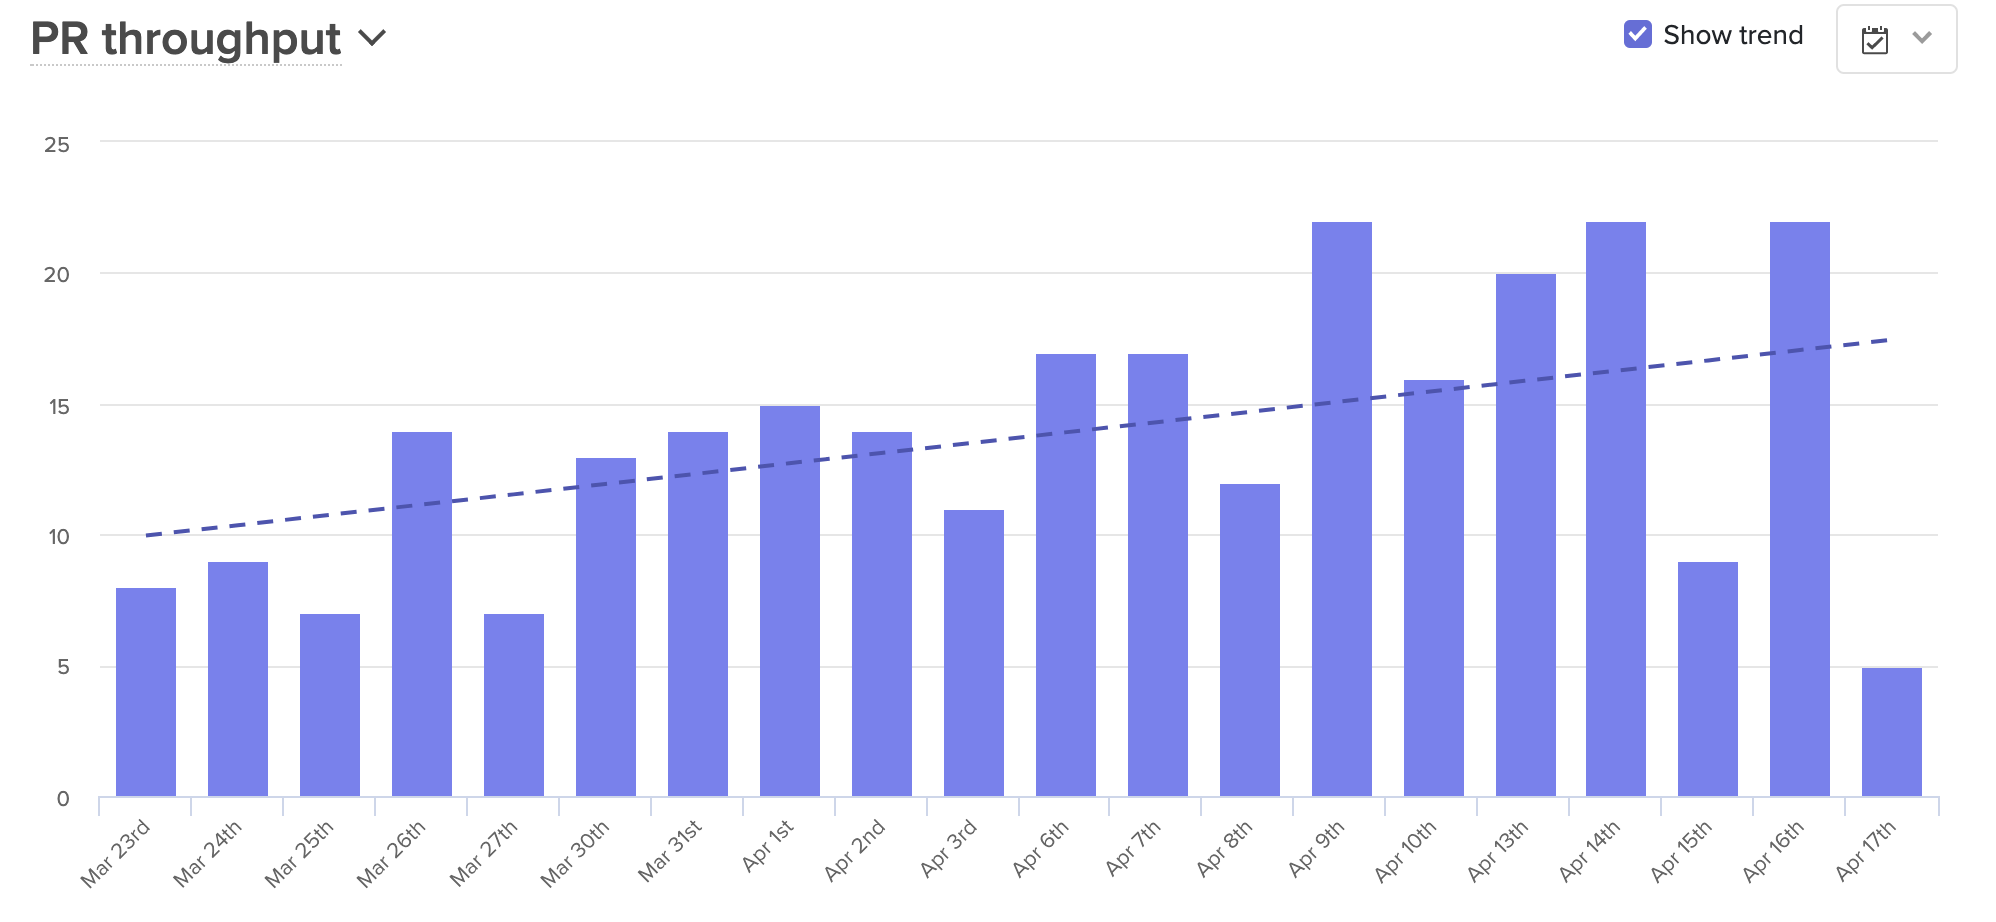
After the team transitioned to a fully-distributed workflow, they noticed that their Pull Request Throughput was significantly lower than usual.
Knowing that the team was merging fewer Pull Requests than expected, Ale took a closer look at the stages of the coding process to find out why. This investigation included a look at:
- Time to Open: The time between a developer’s first commit and the opening of an associated Pull Request. If the team simply wasn’t pushing commits in the first place, it could be a sign that their attention was focused elsewhere, or that they were being sidelined by anxiety or emotional stress. If developers were coding but not opening PRs, they could be confused about project specifications.
- Time to First Review: The period between when a Pull Request is opened, and when it’s picked up for review. A slowdown here could mean that physical distance was causing engineers to focus on their own work and deprioritize assisting their teammates.
- Time to Approve: The period of time a PR spends in the code review process. If PRs were getting stuck in code review, it could indicate a lack of alignment between members of the team.
- Time to Deploy: The actual deployment process. A holdup at this phase could be the result of technical issues or a lack of confidence in new code.
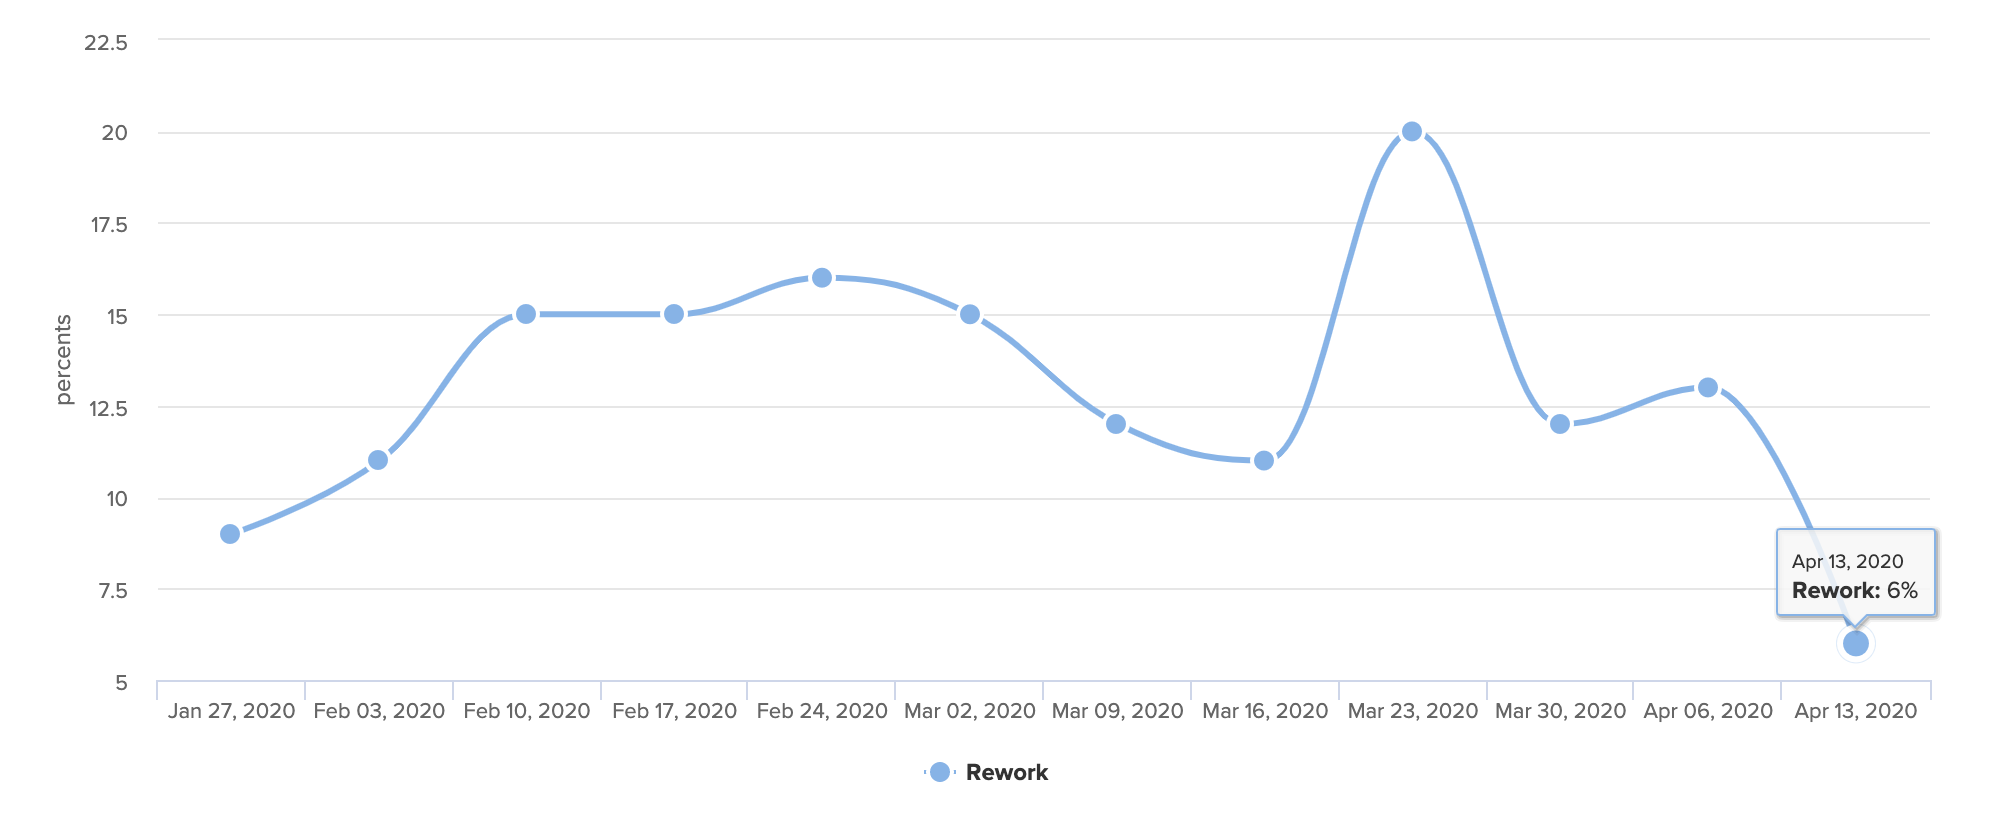
As she dug into the metrics, Ale saw that Time to Open was the source of the slowdown. The engineering team was clearly working — they were pushing commits, and actively coding — but they were completing a higher than usual percentage of Rework. Something was keeping the team writing and rewriting the same pieces of code, which concerned Ale. “Beyond the waste itself, which is not great, I worried that if we didn’t address the issue right away, it could impact team morale.”
Improved Communication Helped Decrease Levels of Rework
With this information, Ale approached the engineering team’s squad leads “to try to understand what was blocking the team, and to identify how we could work together to create a process that was more streamlined.” Through these conversations, Ale discovered that individual developers were getting hung up as a result of miscommunications and unclear specs.
Though the team was having regular remote meetings, developers still lacked the information they needed to do their work. “People didn’t have the same amount of context,” Ale found. “We used to rely on the fact that we were all together in the office so that if I had something to say, the person next to me would hear it…our team is small enough that usually, everyone on the team has context.”
Without a process in place for sharing this big-picture information, engineers were getting left in the dark. They didn’t always know how their work fit into the project as a whole, so they were making assumptions, some of which were incorrect. At the same time, “we noticed that people were using direct messages to communicate, so everyone had slightly different bits of information,” and developers were forced to continually revise their work as new information came to light.
Armed with these realizations, Ale and the team were able to create new processes to combat misinformation and enhance transparency:
- They created systems for intentional public communication. Discussions were moved to a team public Slack channel, with particularly complex conversations happening in groups over Zoom. Decisions were logged in Jira, with each engineer responsible for adding relevant comments to any issues they own, so the rest of the team could reference them when needed.
- They leaned more heavily on documentation. For each new feature, the team worked with Product to draw up a detailed spec document. These documents were then discussed at kickoff meetings for each new track of work so that everyone could see the details and ask questions. For projects that required more in-depth technical design, engineers would write a Request for Comment document and store it in markdown format in GitHub, so teammates could leave comments as part of the code review process.
- They wrote down and shared their plans. Each week, the team wrote down their plans for the next few days and shared them with the rest of the team.
- They fostered a culture of sharing. Though she’s always done it, Ale made a continued effort to encourage senior engineers to use the team public Slack channel to discuss challenges and think through solutions, so that team members feel safer raising questions and admitting confusion.
With the new processes in place, the team kept an eye on the metrics to evaluate their success.
The Productive and Human Benefits of Increased Transparency
The new processes helped increase transparency, reduce confusion, and boost productivity.
In a span of four weeks, Rework fell from a high of 20% to just 6%.
Over that same period, average PR Throughput went up almost 70%.
But most importantly, engineers are now less confused and are finding more opportunities to collaborate. The emphasis on documentation and written plans offer the opportunity to ask questions at every stage of the process. And with everyone looped in, developers can lend a hand to people on other teams, something that frequently occurred when everyone was together in the office.
Writing things down also has an unforeseen benefit — it’s helping the team avoid unnecessary meetings. While the team is remote, they’re using that extra time to connect on a more human level, building time into each standup to check in with each other, and carving time out of retros to talk about how they’re coping with the current situation. As Ale explained, “We were able to adapt our last retro to how we were feeling, instead of just focusing on the product process. We understood that was not what we needed to be talking about right now, that we need to talk about how we’re feeling and how we’re coping.”
Ale expects the team will continue to see benefits from these new processes, even once they return to the office. Alignment has increased, communication has improved, and enhanced documentation will make it easier to onboard new team members. Plus, when the team reverts to their partially-distributed structure, they’ll do so with a greater sense of unity. As Ale explained, “We now have a lot more empathy for our remote team members.”

When your team is building a software product, the majority of the work that they do is invisible. As a manager, you have to rely on in-person cues for blocked work or frustrated engineers. When they move to a remote workflow—your team also becomes invisible, and all those critical signals are dropped.
In-person, you might notice:
- Nonverbal clues during stand-ups or retros
- Frequent interruptions as developers are pulled into meeting after meeting
- Tension between team members as they work through problems
Acting on these signals is one of the most important ways you can help your team. You might say: “I noticed you seem frustrated each time you worked with Jack—is everything okay?” Or “I noticed that you’ve been helping the marketing team a lot, do you have too much on your plate right now?”
When you transition to a remote workflow, you lose indicators that anyone is stuck, demotivated, or overworked. To adjust, you have to find new ways to broaden the now-limited purview that remote work allows.
Signals to Remain Context-Aware From Afar
When thinking about productivity or output, many software leaders think in terms of features or story points. They get a general sense of how things are moving (or not moving) based on whether these features are getting completed. But these metrics are lagging indicators, and they’re not diagnostic. If you know that you’ve shipped fewer features one sprint than you did in the previous, you have no insight into what you can do to improve things.
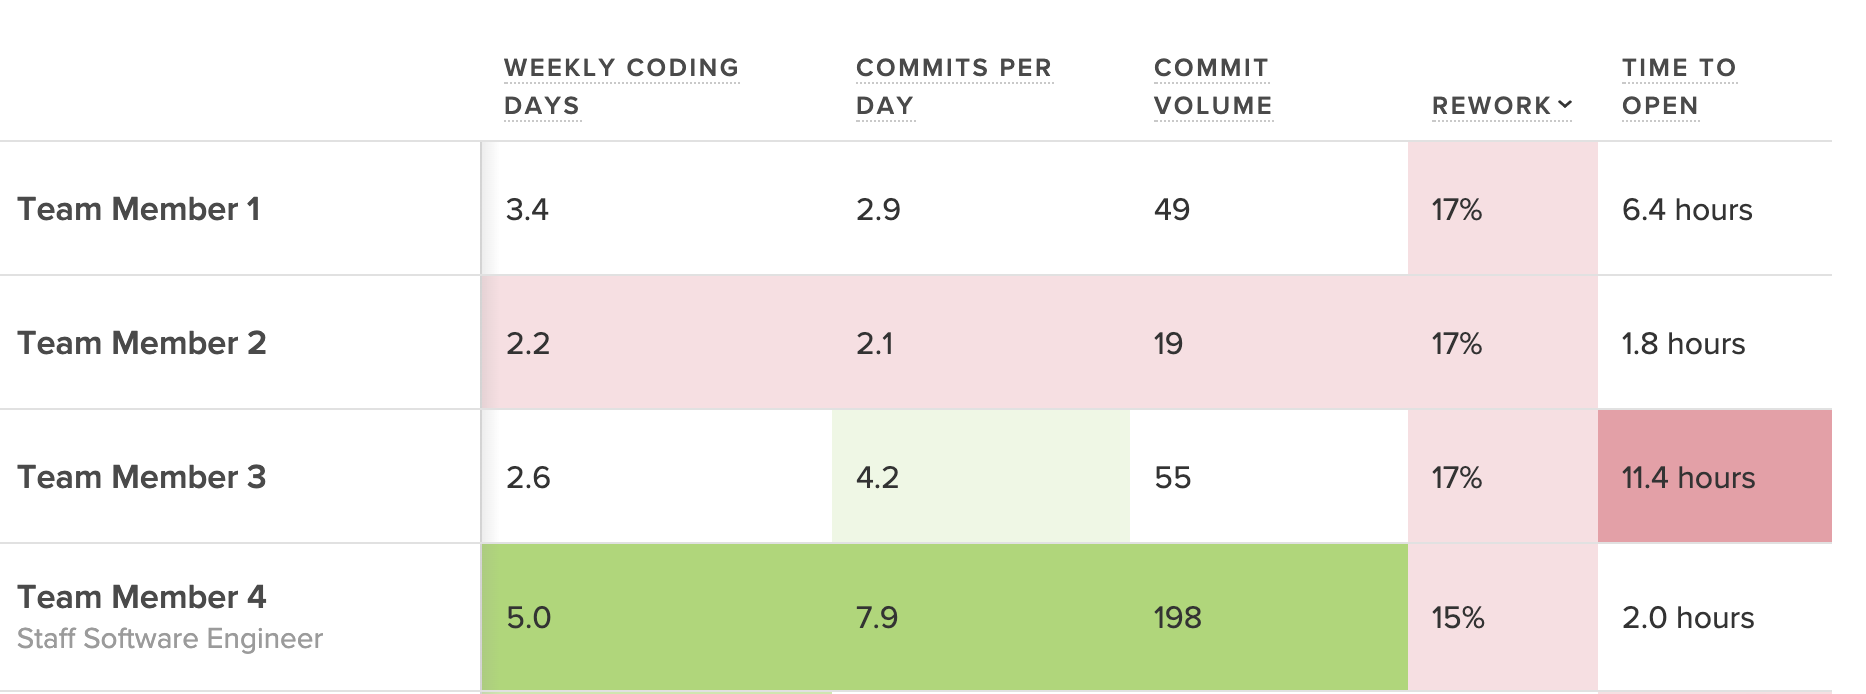
Fortunately, we can derive much more granular signals for the speed and effectiveness of software development from the systems in which engineers already work. Data from how a developer works in their version control system, such as Commit Volume, Code Churn, or Pull Request Cycle Time, better clues you into how your team is working in real-time.
These metrics are imperfect (as all metrics are), but they give you much more to work with in terms of diagnosing process problems within your newly-distributed workflow. Below, we’ve recommended a set of metrics that you can look at on a daily, weekly, and monthly basis to stay connected with how your team is working.
Daily Signals for Stuck Work
The most imminent threat to an efficient and happy remote team is stuck work.
An engineer might be stuck because they are unsure of how to implement a change, because they’re unfamiliar with a portion of the codebase or for a number of other reasons. Any unit of work that isn’t moving through the Software Delivery Process quickly enough is a signal for you to check in. Look out for:
- Infrequent pushes: Are team members working incrementally? Are they working on a particularly tough portion of the codebase?
- Rework: Are team members reworking the same lines of code over and over again? Is there clear communication surrounding feature implementation?
- Long-running Pull Requests: Are there Pull Requests that have been open for more than three business days? Is this causing multi-tasking?
- Pull Requests with 3+ participants: Is a single Pull Request taking up the attention of several engineers who may be in disagreement?
- Pull Requests stuck in code review: Are there Pull Requests that have been passed back and forth between the reviewer and the author several times?
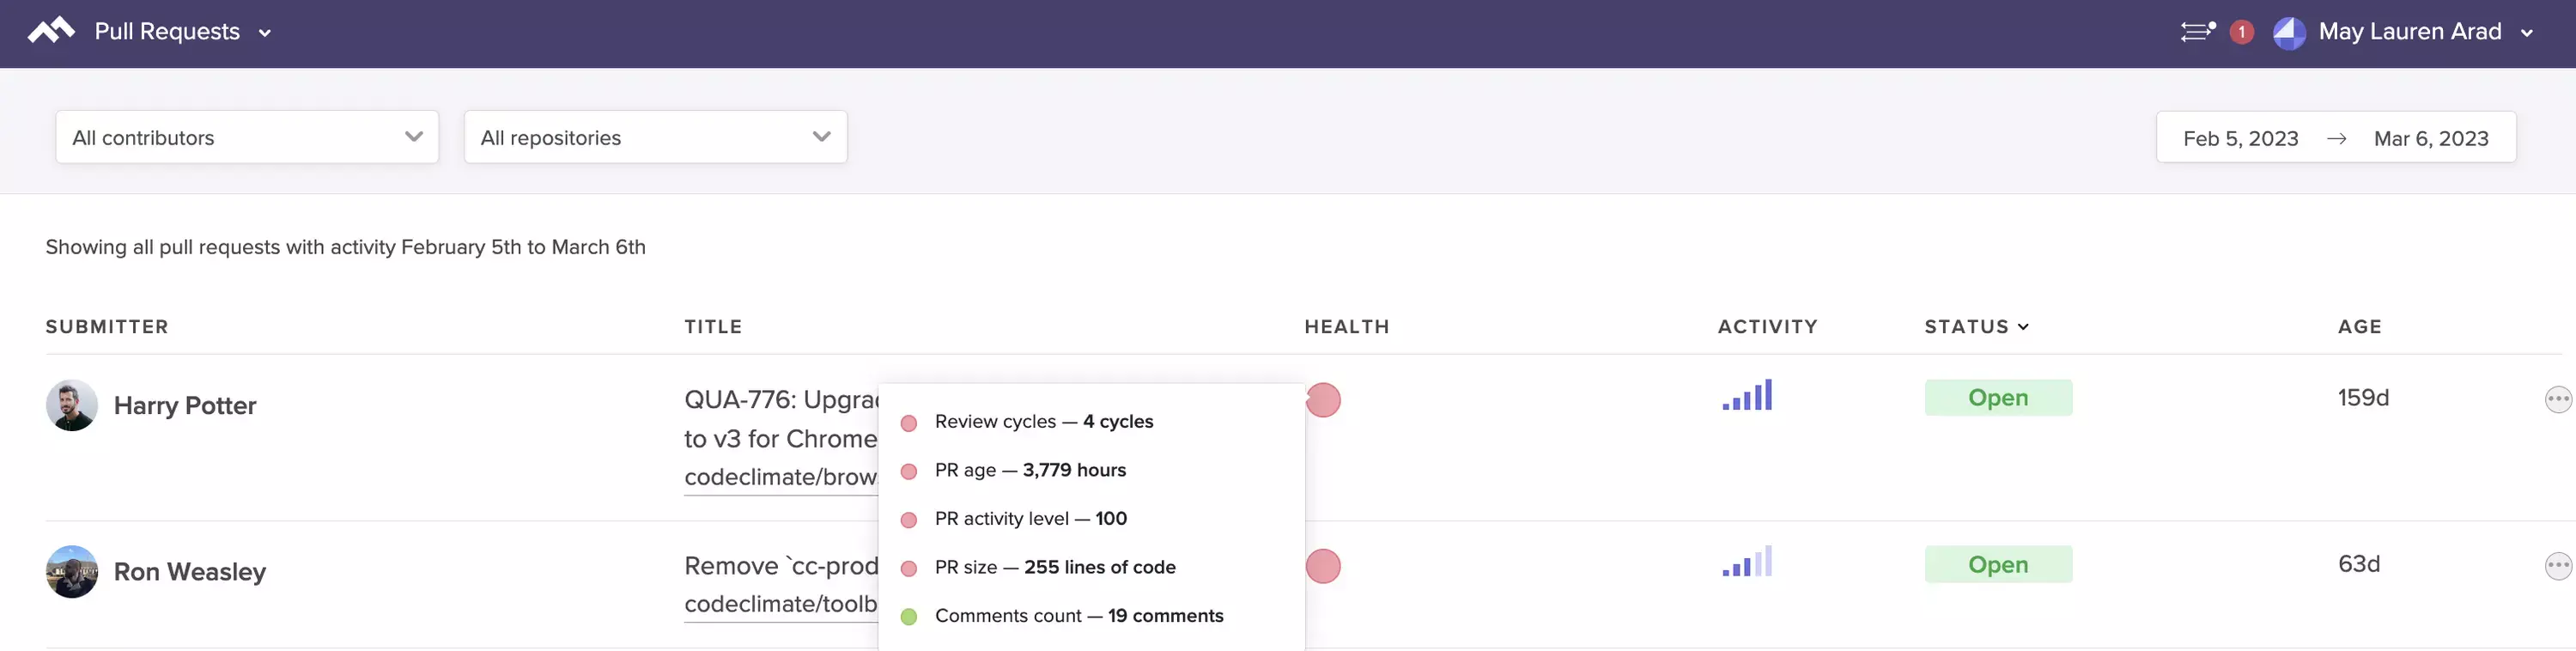
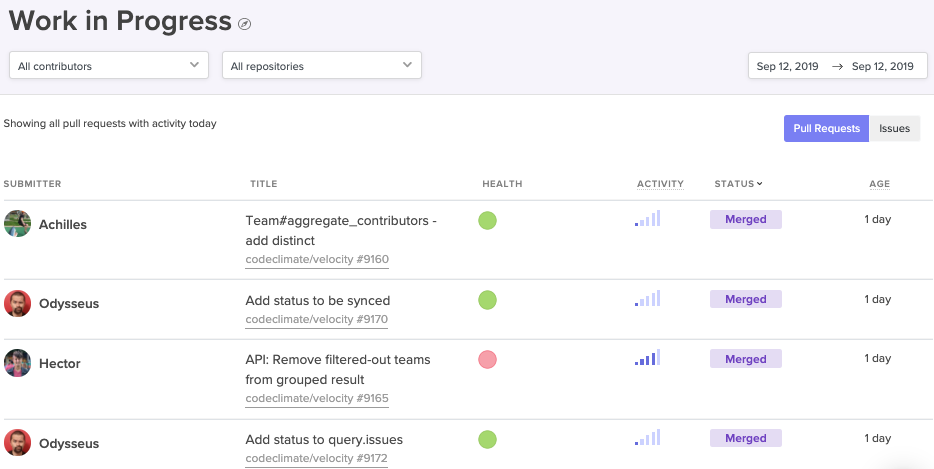
See at-a-glance the Pull Requests that are most likely to impede your team.
If you look at these signals with your team, you’ll have a shared understanding of how things are moving and where someone might be stuck. This data will take the pressure off developers to raise their hand during daily stand-ups when something’s off track, and enable you, as a manager, to know when you can step in and help.
Weekly Signals for Goal Setting
Once you’ve started tracking daily signals to keep your team on track, you can take a step back and start looking at how your engineers are working. If individual engineers are spending days working through a problem on their individual device, then opening huge Pull Requests that are perpetually getting stuck in the review process, your team will constantly feel stuck and frustrated.
Agile and Continuous Delivery workflows demand that team members commit frequently, work in small batches, and limit work in progress. These habits set in motion what we call the Virtuous Circle of Software Delivery:
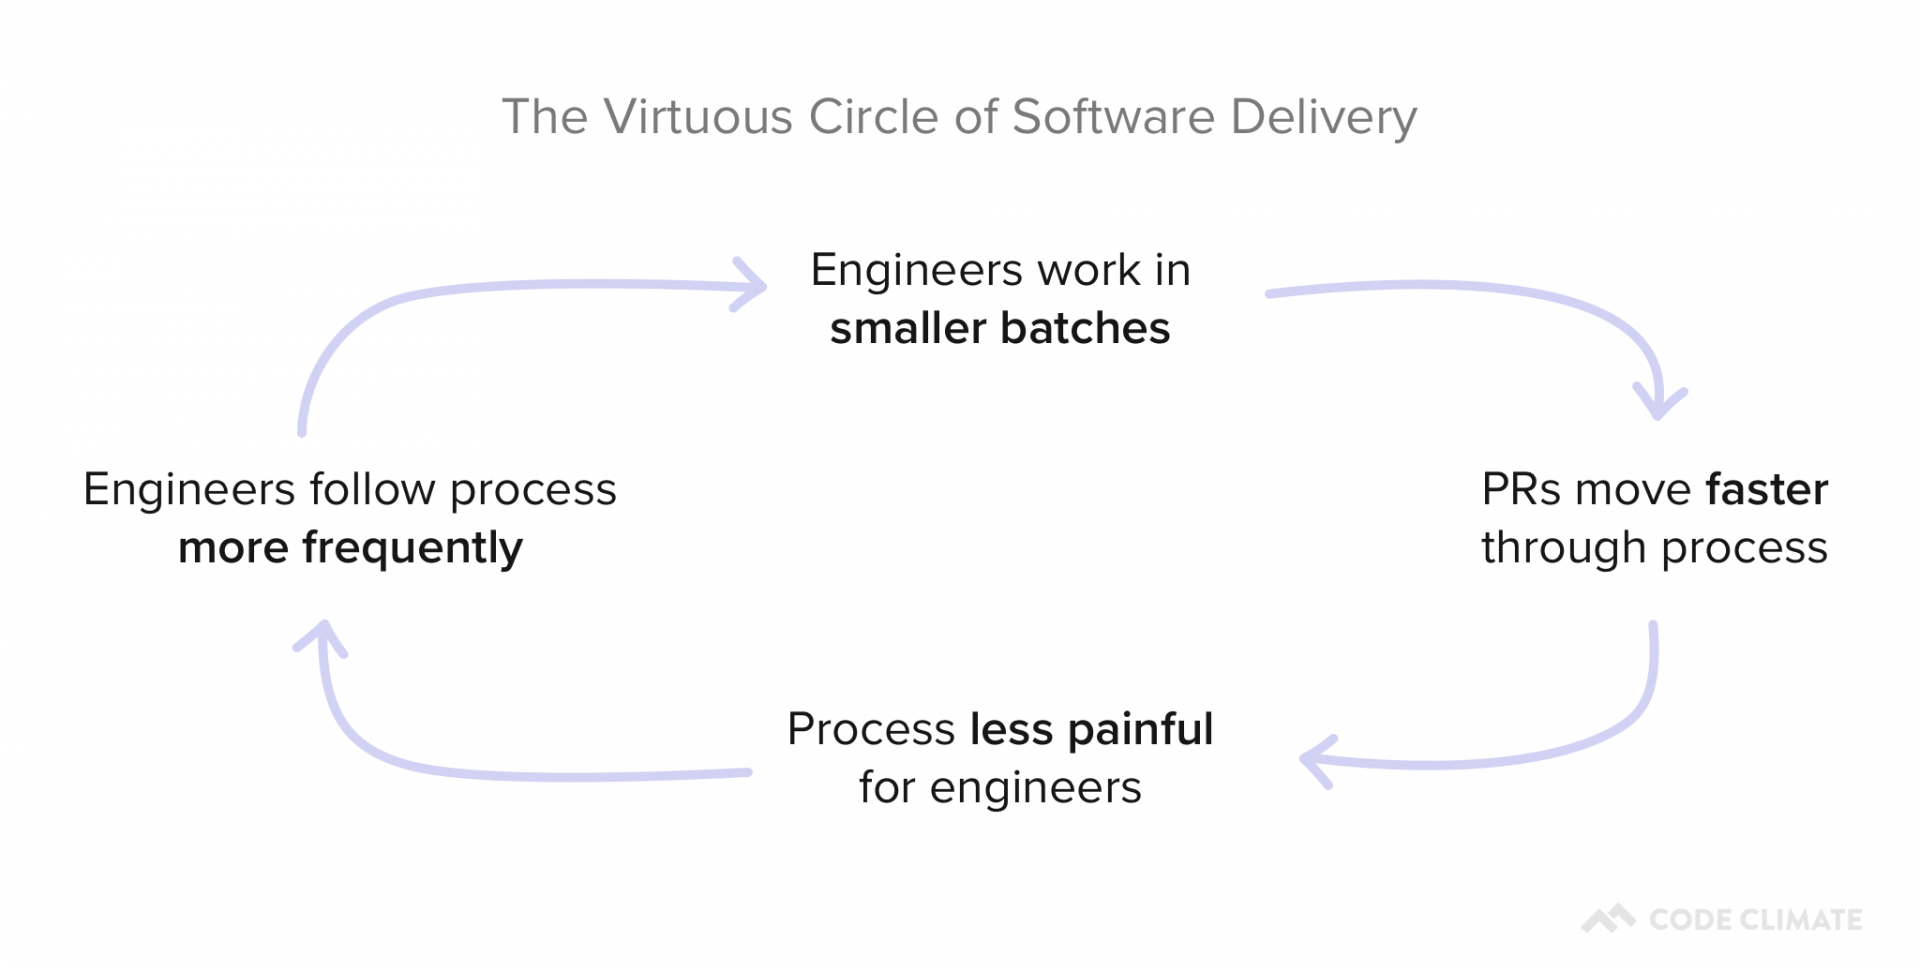
Building these habits is crucial to minimize the risk associated with merging a PR and decrease the chances that an individual unit of work will get stuck in the process.
For this, we recommend working with team members to set up process SLAs for good collaborative practices every week. Then, during retros and 1:1s, developers can work through concrete examples of when something went off track.
You can set targets for things like:
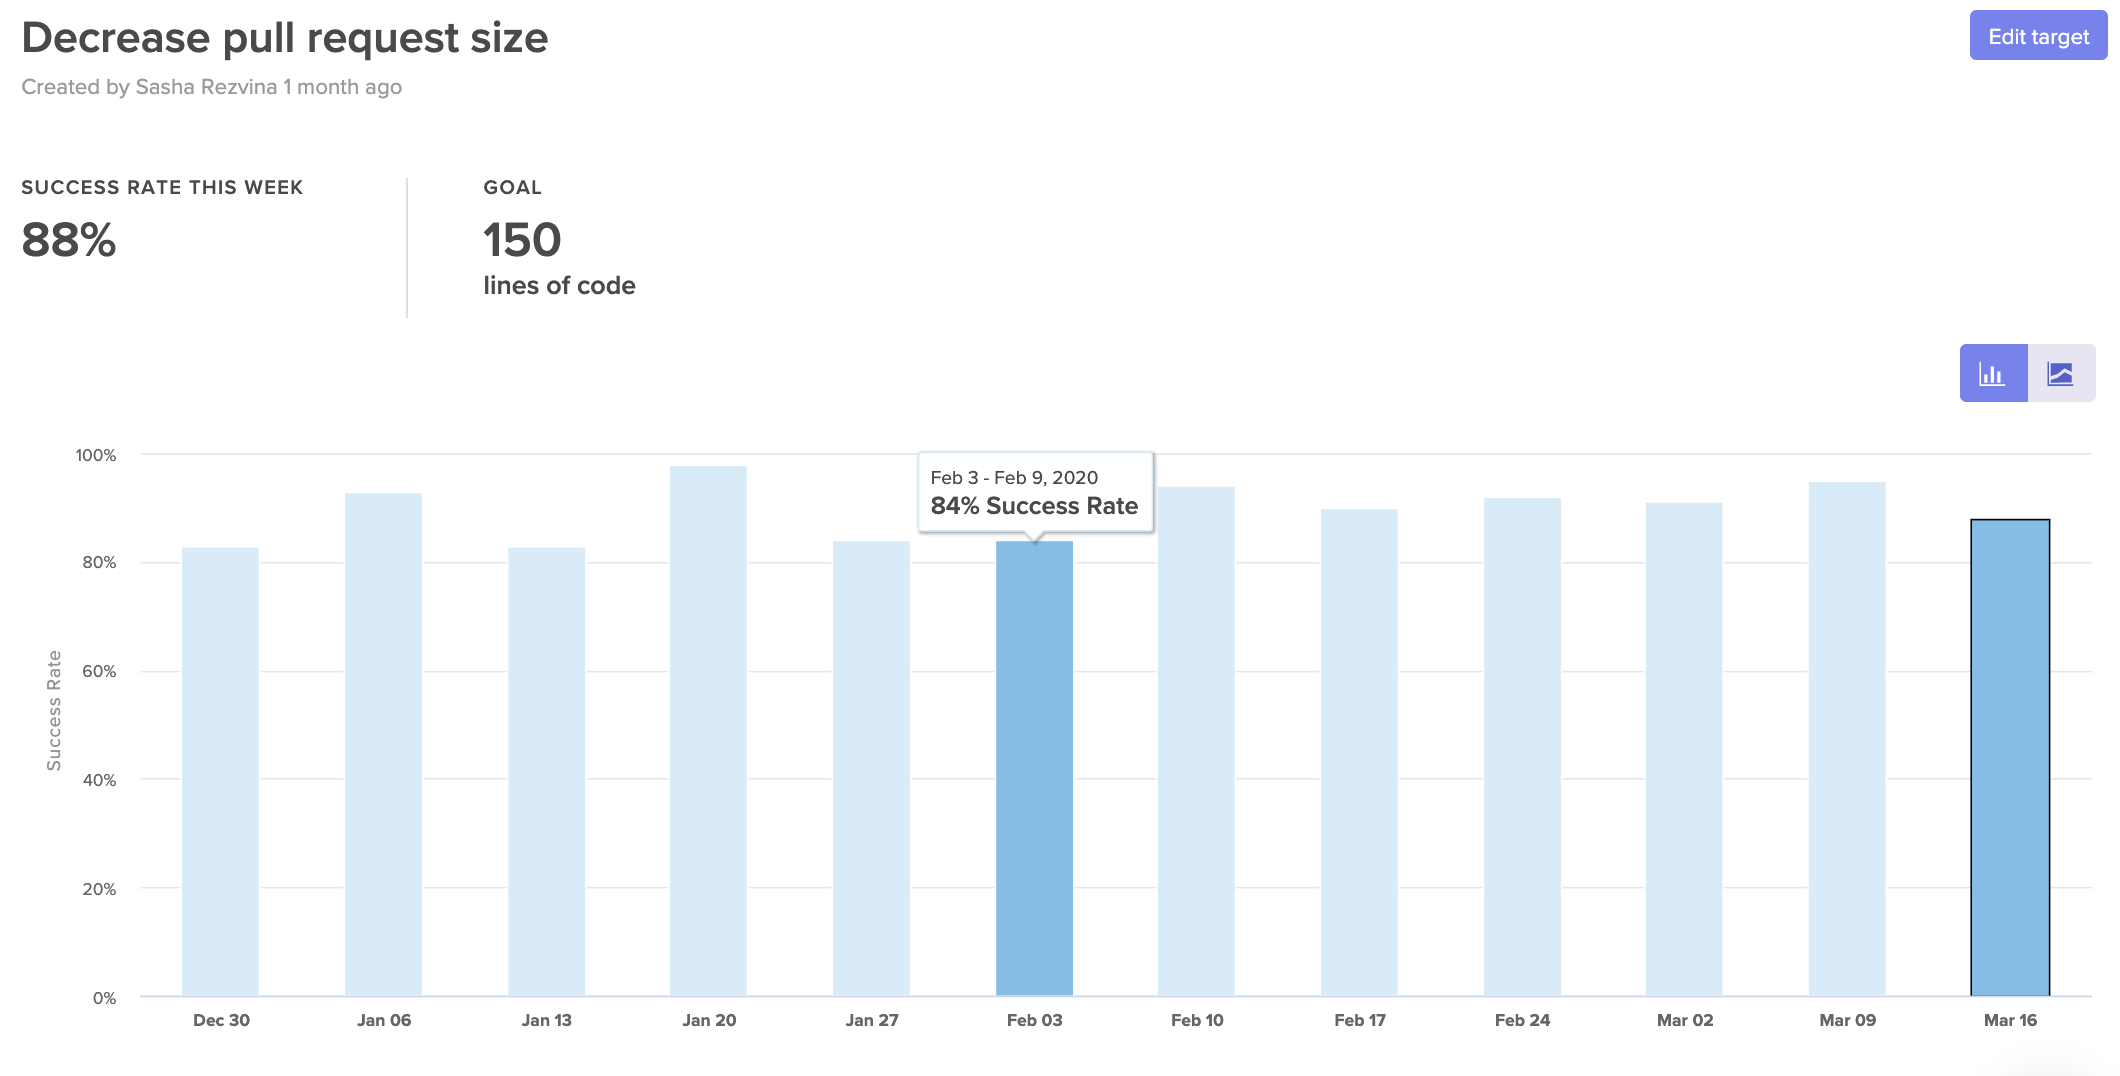
- Pull Request Success Rate: Can we agree that 95% of PRs should be successfully merged? We’ll investigate PRs that were closed or abandoned.
- Pull Request Time to Review: Can we agree to get to code reviews within 8 hours for 80% of Pull Requests? We’ll look deeper into PRs that couldn’t be reviewed quickly.
- Pull Requests Review Cycles: Can we agree to keep Review Cycles under 2 for 95% of Pull Requests? We’ll look into any PRs that get passed back and forth between author and reviewer multiple times.
- Workload Balance: Can we agree that 70% of the work should be done by at least 50% of the team? We’ll investigate deeper if just a few individuals seem to be doing most of the work.
Set SLAs to help hold your team accountable to their goals.
Naturally, you don’t need to look at all of these metrics right away—just pick one or two that represent commonly reported issues. Selecting a granular metric, like Workload Balance, will be a much more effective indicator of what’s going amiss than a metric like Features Completed.
Over time, your team can build habits that minimize the opportunity for work to get stuck and slow down the team.
Monthly Signals for Continuous Improvement
Once you’ve identified signals that can point you towards daily and weekly improvement opportunities, you’ll want to start looking at your processes end-to-end to ensure that they’re working for, not against, your team members.
First, you’ll want to make sure your processes work. If you’re working in a traditional Git workflow, you’ll want to make sure that PRs are moving along the “happy path” from Open to Reviewed to Approved to Merged. Any PRs that skip steps are working outside your process and represent opportunities for deeper investigation.
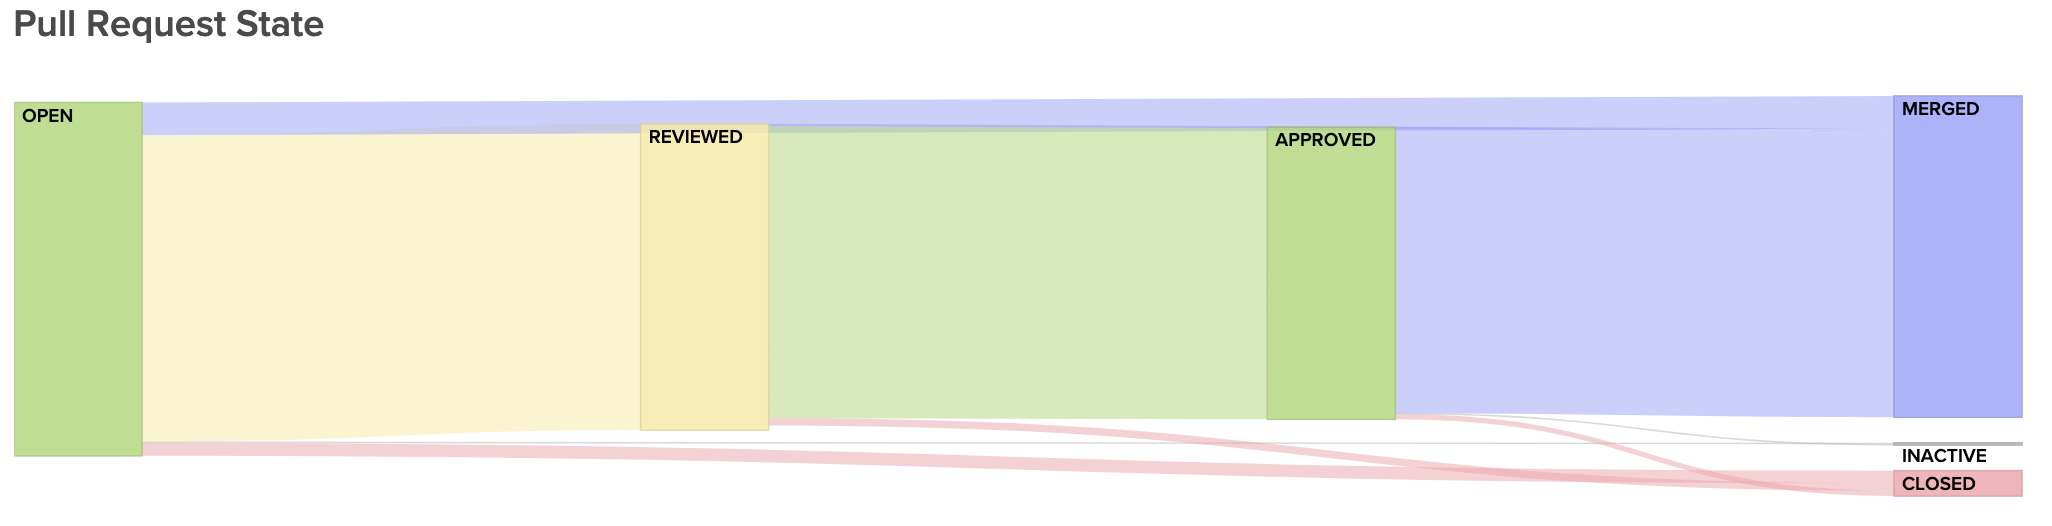
Visualize the journey of your Pull Requests from open to merged. Below, you can see metrics that represent constituents of this journey to better diagnose slowdowns.
Next, you’ll want to see how well this process is enabling a low time-to-market. If it takes days or weeks for changes to get into the hands of customers, your team will have a hard time quickly mitigating issues in production, and, ultimately, keeping up innovation.
For this, you’ll want to keep an eye on your team’s delivery Cycle Time, or how long, on average, it takes PRs to go from a developer’s laptop to being merged to production.
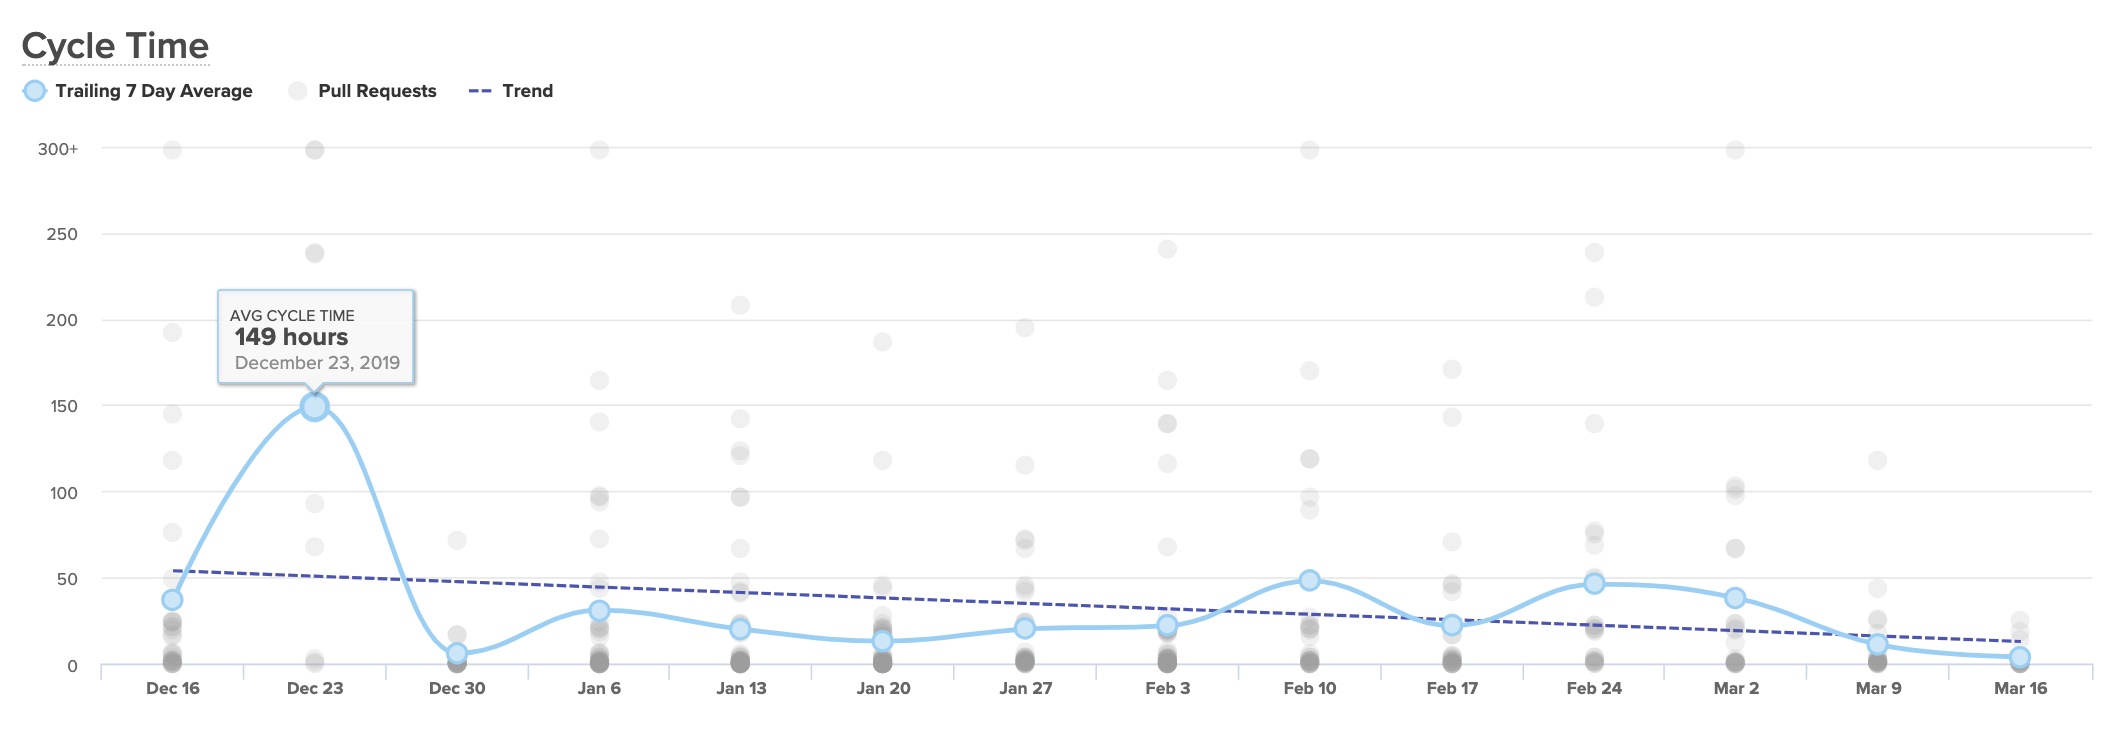
A Cycle Time that’s short and consistent is an indicator that your team is working with little friction, and your processes are enabling rapid innovation. If your Cycle Time is spikey, you’ll know to look into the units of work that make up a particularly high week.
If your Cycle Time seems consistently high, you’ll want to break it up into components to see, specifically, which processes or practices are dragging down your speed. We recommend looking at:
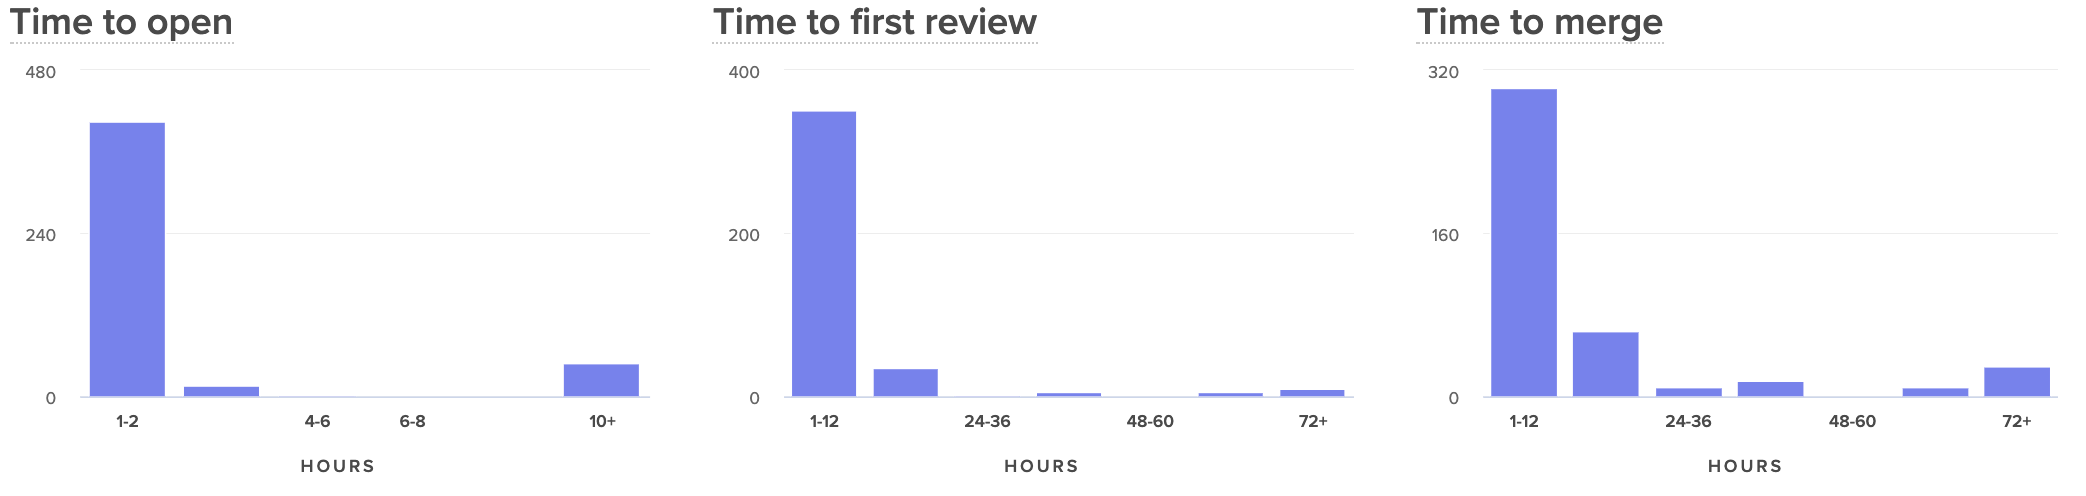
- Time to Open: How much time passes between the earliest commit and the opening of a Pull Request?
- Time to First Review: How much time passes between when a PR is opened and when it is first reviewed?
- Time to Merge: How much time passes between when a PR is opened and when it is merged to production?
Comparing these side by side will help you see where in your process your developers are being slowed down.
When your team moves the needle and improves Cycle Time, it means you’re working together to boost the efficiency of the development process and to accelerate innovation. It’s important to communicate and celebrate success surrounding this metric to encourage continuous improvement on your team.
Remote Engineers Deserve Great Leaders
An unexpected transition to remote work is one of the most trying experiences for many software engineers. The already-isolating job of writing code becomes even harder when team members can’t chat or take breaks together. Leadership that is disconnected or not aware of all the challenges that they’re facing can be the final nudge that can disengage a team member.
Fold in just a few extra signals to stay aligned with engineers and lend a hand when they need it most.
Request a consultation to learn more.Request a consultation to learn more.

This post is the fourth article in our Tactical Guide to a Shorter Cycle Time five-part series. Read the previous post here.
As the engineering industry has moved towards Continuous Delivery, teams have left behind many of the manual quality control measures that once slowed down delivery. Along this same vein, some engineering leaders are doubting whether Code Review still has value:
The annual survey conducted by Coding Bear revealed that 65% of teams are dissatisfied with their Code Review process– yet teams consistently identify Code Review as the best way to ensure code quality. Most people agree Code Review is important, but few know how to prevent it from wasting valuable engineering time.
Before giving up on Code Reviews altogether, we recommend looking at Code Review metrics to identify where you can avoid waste and increase the efficiency of this process.
Defining “Successful” Code Reviews
An effective Code Review process starts with alignment on its objective.
A study at Microsoft a few years ago surveyed over 900 managers and developers to understand the motivation behind Code Reviews. “Finding defects” was the primary motivator of the majority of those surveyed, but when the results were analyzed, the researchers discovered that the outcomes didn’t match the motivations. Improvements to the code were a much more common result of the reviews.
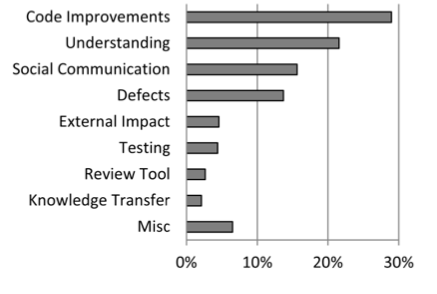
Work with team leaders to determine which outcomes you’re optimizing for:
- Catching bugs and defects
- Improving the maintainability of the codebase
- Keeping consistency of code style
- Knowledge sharing throughout the team
Determining your Code Review priorities helps your team focus on what kind of feedback to leave or look for. Reviews that are intended to familiarize the reviewer with a particular portion of the codebase will look different from reviews that are guiding a new team member towards better overall coding practices.
Once you know what an effective Code Review means for your team, you can start adjusting your Code Review activities to achieve those goals.
Code Review Diagnostics
Historically, there has been no industry standard for Code Review metrics. After speaking with and analyzing work patterns of thousands of engineering teams, we identified the following indicators:
- Review Coverage: the percentage of files changed that elicited at least one comment from the reviewer.
- Review Influence: the percentage of comments that led to some form of action, either in the form of a change to the code or of a reply.
- Review Cycles: the number of back-and-forths between reviewer and submitter.
These metrics were designed to give a balanced representation of the Code Review process, showing thoroughness, effectiveness, and speed. While imperfect (as all metrics are), they provide concrete measures that help you understand the differences between teams and individuals.
Diving into outliers will enable you to finally bring a quality and efficiency standard to Code Reviews across your organization.
Review Coverage
Review Coverage indicates how much attention is spent on reviews and represents review thoroughness. If you’ve identified that the purpose of Code Reviews is to catch defects or improve maintainability, this metric, together with Review Influence, will be a key indicator of how effective this process is.
Low Review Coverage can point you toward incidents of under-review or rubber-stamping. Under-review may be happening as a result of a lack of familiarity with the codebase, disengagement on the part of the reviewer, or poor review distribution.
Unusually high Review Coverage could be an indicator of a nitpicker who’s leading to inefficiency and frustration on the team. This case will likely require realignment on what “good” is.
Review Influence
Any action that is taken as a result of a review comment is proof that the reviewer is taken seriously and their feedback is being considered. When this metric dips low, feedback isn’t resulting in change, indicating that reviews are not perceived to be valuable.
See core Code Review metrics and how they compare across teams or individuals so you can pinpoint the problem.
If you consider this metric in tandem with Review Coverage, you may identify cases where individuals or teams leave many comments (have high thoroughness) but those comments yield no action (are low impact). This can signal that there needs to be a re-alignment on the function or purpose of Code Review.
When the Review Influence is low, you’ll want to dive into the reviews that are being left on each Pull Request. When feedback that was intended to be actioned is ignored, it may indicate that the comments were unclear or the suggestion was controversial.
Review Cycles
Each time a Pull Request is passed back and forth, developers are required to context switch and spend more time on one particular line of work.
If this happens frequently, the review process can become a bottleneck to shipment and directly increase your team’s Cycle Time. Even worse, it can serve as a source of demotivation to engineers and contribute to burnout.
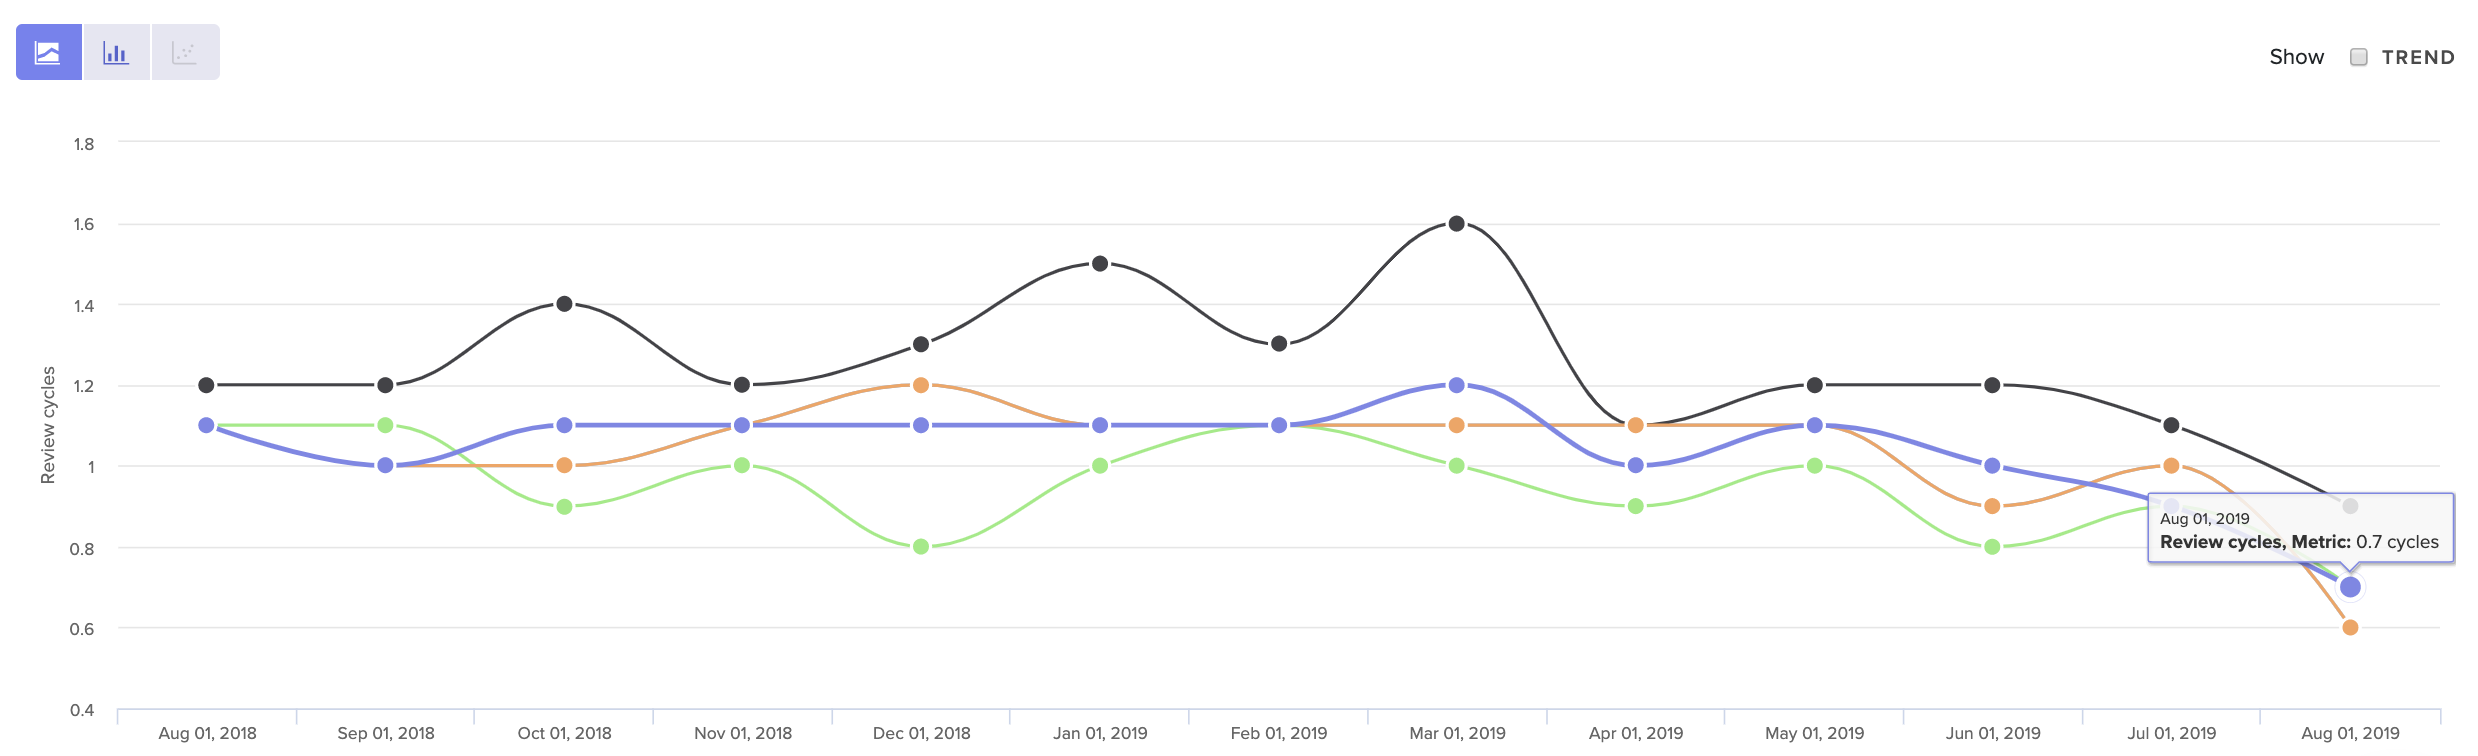
See core Code Review metrics over time, so you can get a sense of what’s normal for your team.
Look at your Review Cycle count over time to get a sense of what is typical for your team. Note that a high number of Review Cycles is typical for less experienced team members who are still becoming familiar with your codebase. Otherwise, when Review Cycles spikes, it typically represents some form of misalignment.
The source of that misalignment could be upstream, due to unclear technical direction. It may indicate that there’s a disagreement about how a solution should best be implemented. Or, more simply, team members may not have clarity about what “done” means.
Bring this data into your retros or 1:1s to start the conversation about where this misalignment may have taken place.
When to Revisit Code Review
Of all the components that influence Cycle Time, Code Review is the most difficult to get right. It requires taking a hard look at metrics, but also frequently requires difficult conversations about how to leave constructive yet respectful feedback. Often, the culture of one team is not conducive to processes have worked well for another.
For this reason, we recommend revisiting your Code Review process after any significant change to processes or team structure. This will get easier after you’ve done it once since you’ll have a clear sense of your expectations and the tools with which to communicate them.
To learn where your team should focus next, check out the other articles in our Tactical Guide to a Shorter Cycle Time five-part series:

This post is the third article in our Tactical Guide to a Shorter Cycle Time five-part series. Read the previous post here.
Every hour that a Pull Request spends awaiting review represents waste–but also threatens to slow down several subsequent lines of work.
An engineer who’s waiting on a code review will move onto the next Pull Request to feel productive until it too gets stuck in the queue. If this pattern continues, reviewers will be faced with a daunting stockpile of unreviewed Pull Requests, and each developer will be juggling three or four simultaneous lines of work. Code review will become a universally painful experience.
A poor Time to First Review (the time it takes for a reviewer to pick up a review) can jeopardize the effectiveness of your entire code review process. Here’s what you can do to mitigate the first significant bottleneck in the software delivery pipeline.
Benchmarking Success
First, you’ll want to define what a “low” Time to First Review means, across the industry and in the context of your organization.
In our analysis of over 19k contributors’ data we uncovered the following benchmarks for Time to First Review:
- The top 25% of engineering organizations get Pull Requests reviewed in under 4 hours.
- The industry median is about one day.
- The bottom 25% take over a day and a half.
You want to lower this metric as much as you can, without it coming at a cost to the focus and productivity of the reviewers. This delicate tradeoff means that you’ll want to understand the dynamics of your specific team before setting metrics-based goals.
First, look at this metric for your organization and team-by-team. Once you know what’s “normal” for your organization, you can further investigate two kinds of outliers:
- Teams with fast reviewers, who have found a way to create an effective process and juggle a difficult team dynamic. Their processes may be worth sharing with the rest of the organization.
- Teams with inconsistent reviewers, who are frequently blocked and struggling to get to code reviews quickly.
From here, dive into individual and team metrics to better understand precisely why your Time to First Review is high or inconsistent.
Time to First Review Diagnostics
Before diagnosing this particular phase of the software delivery process, make sure that it’s not a symptom of an earlier process. (Read our previous post about leveraging Time to Open to better understand how inefficiencies during the first stage can have significant, negative downstream effects.)
If everything earlier in the PR process is streamlined, however, there are three data points you can look at to fully diagnose this slowdown.
Pull Request Size
Pull Request Size is a byproduct of a high Time to Open and usually points to inconsistencies with how your team manages Pull Request scope.
For many teams, opening a Pull Request doesn’t indicate that the changeset is ready for review. Team members tend to continue making changes before the Pull Request gets into the hands of a reviewer.
At this time, a Pull Request can grow, deterring reviewers from picking it up because either A) they aren’t sure if it’s ready, or B) because it has grown in complexity and is, therefore, more difficult to review.
Surface the oldest and most active open PRs, so your frontline managers can mitigate issues before they grow out of hand.
Encourage managers to check in on individual Pull Requests that have been open for longer than a day (but not yet reviewed). If they find patterns among teams or individuals that indicate a lack of scope management, they’ll want to coach their teams on how to control the scope from the onset of the change set, by, for instance, giving PRs titles that are discrete and specific.
Review Workload Balance
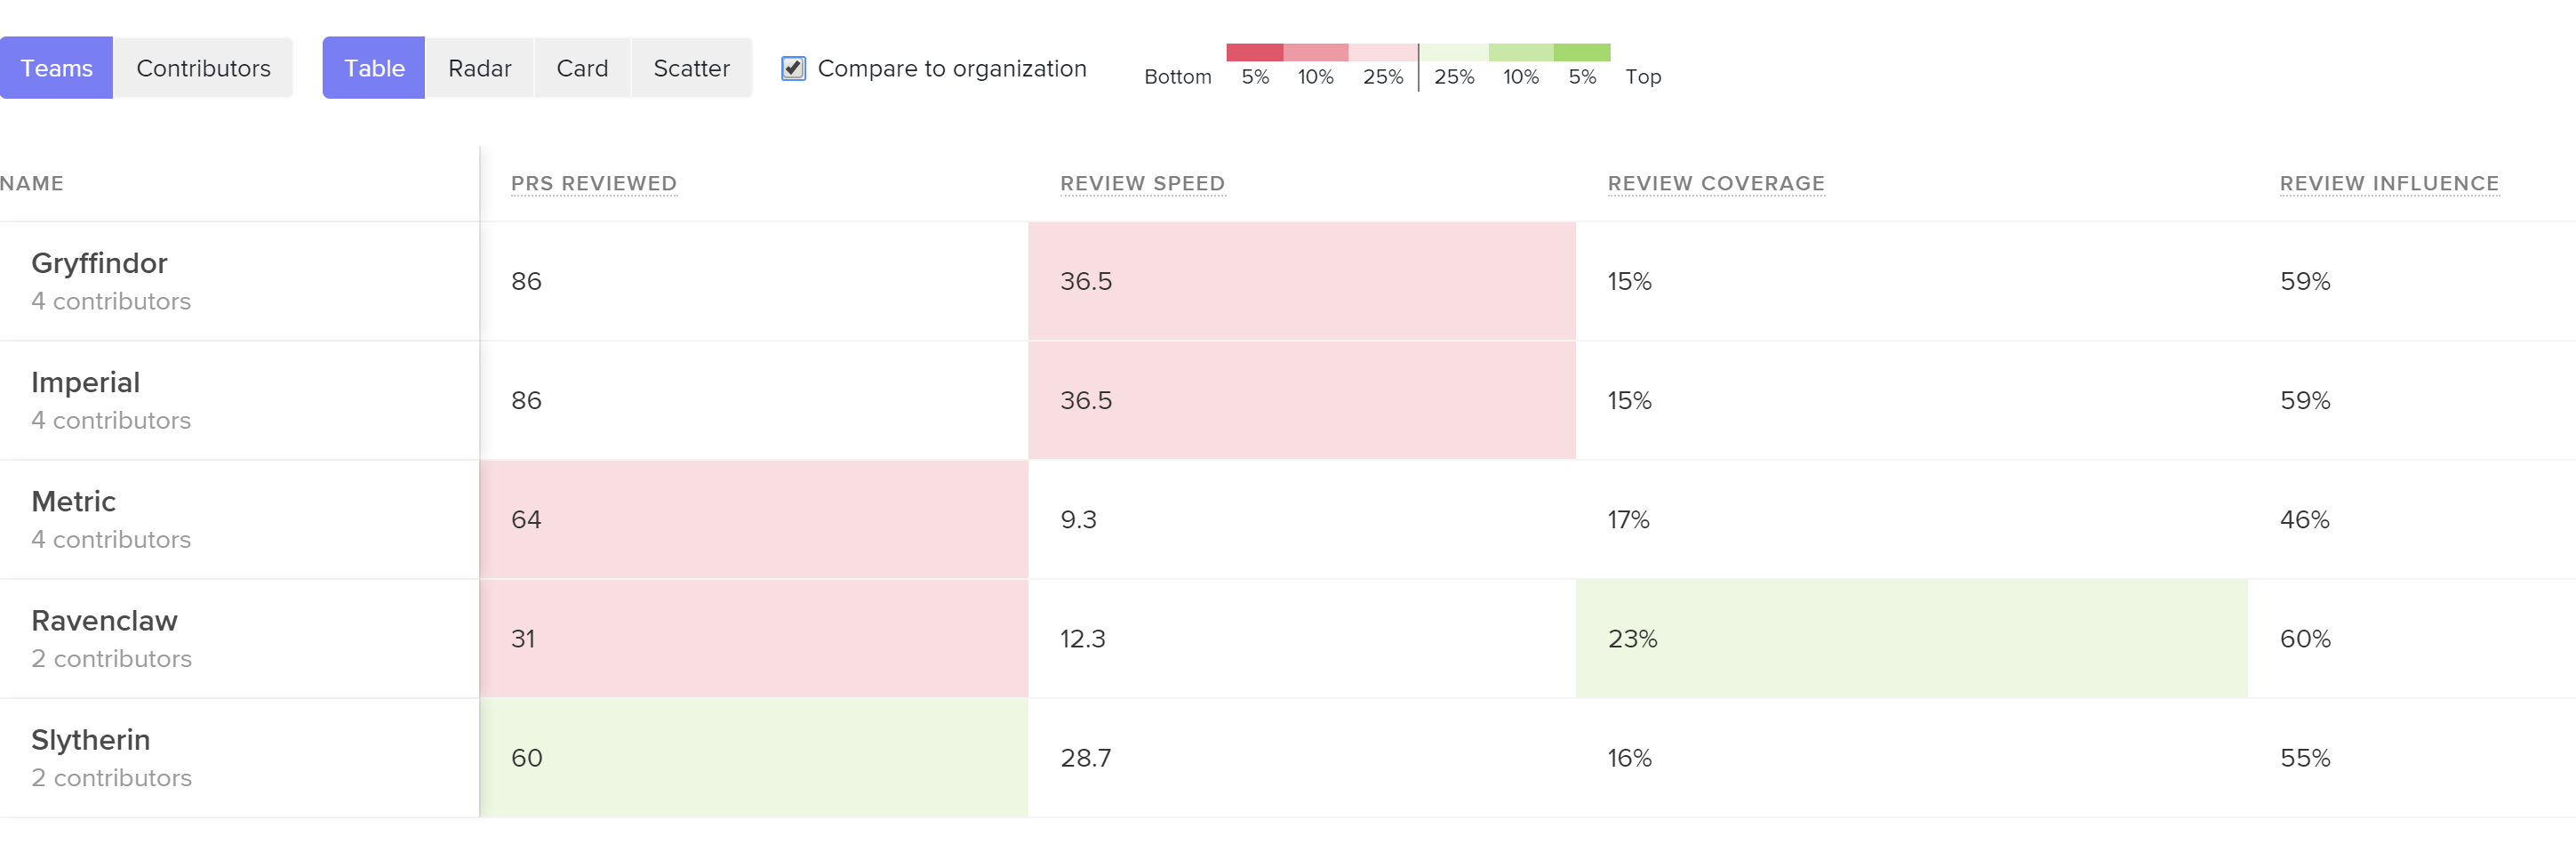
Look at Review Involvement (i.e., the percent of reviews that reviewers participate in) across the team to understand how the burden of code review is distributed. If the same few people are handling all the reviews, work will start piling up, creating a lasting bottleneck.
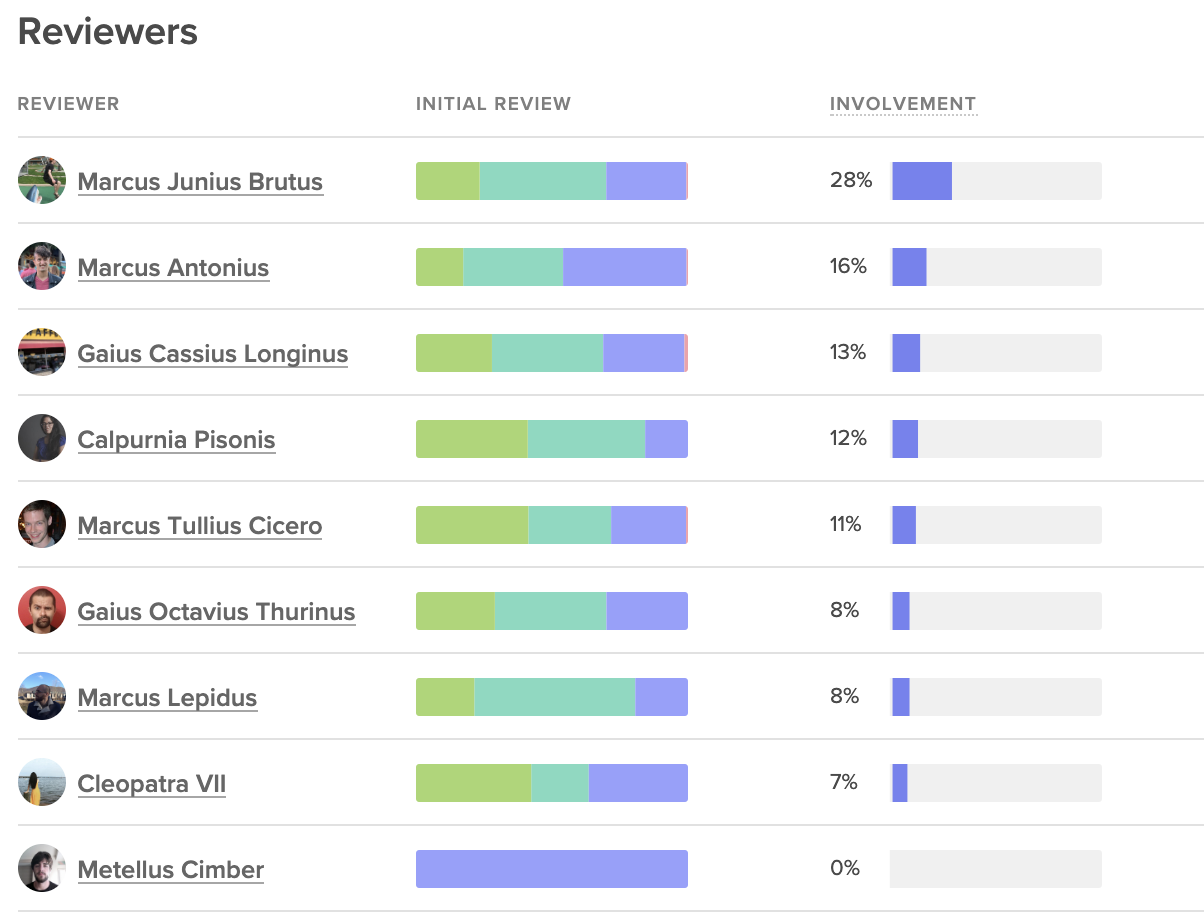
Code Climate's insights show involved each team member is on code reviews, next to the outcomes of those reviews.
Poor distribution may represent a difference of enthusiasm about code review. Some team members may be more keen to pick up reviews, while others consistently prioritize their own coding. This issue can be solved with automated code review assignments or a re-emphasis on code review across the team.
Poor distribution of code reviews can also represent a lack of confidence. The proper response will vary from team to team, but you’ll want to make sure there’s clarity around the expectations of a code review and training on how new team members can ramp up and start participating more deeply in the team-wide collaborative processes.
Review Speed
Unlike Time to First Review, which is used to understand team collaboration patterns, Review Speed is an individual metric, indicating how long each person takes to leave a review.
Review Speed helps you understand how well your team is prioritizing code review.
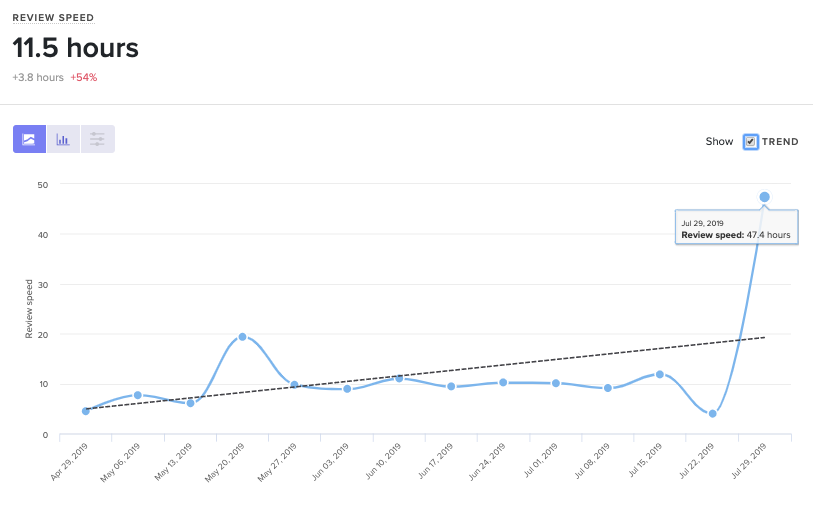
Code Climate's insights can show you how any metric is trending as your team scales or changes.
A high or inconsistent Review Speed can point to cultural or technical blockers.
A cultural blocker can only be uncovered through conversations with specific team members and managers. If you find that a team or a team member is not prioritizing code review, work with them to reprioritize, along with their other responsibilities. Encourage team members to optimize for this metric until Cycle Time decreases and Pull Request authors are quickly unblocked.
A technical barrier at this stage usually indicates that there may be a lack of tooling. Team members, while working in their individual environment, don’t have the signals or alerting systems that inform them of Pull Requests ready for review.
Start Code Review on the Right Foot
Code Review is one of the most difficult processes to get right on a software development team. A different balance between thoroughness and speed exists on most teams– yet few have a solid idea of what their code review objectives should be. Adding an endless queue of unreviewed Pull Requests to this equation makes the entire process unduly more difficult.
If Time to Review is a problem, a small reprioritization or retooling may be necessary– but the effects will be well worth it.
To learn where your team should focus next, look out for the upcoming articles in our Tactical Guide to a Shorter Cycle Time five-part series:

Last Thursday, DORA released their 6th annual State of DevOps report, identifying this year’s trends within engineering departments across industries.
The good news: a much higher percentage of software organizations are adopting practices that yield safer and faster software delivery. 25% of the industry is performing at the “elite” level, deploying every day, keeping their time to restore service under one hour, and achieving under 15% change failure rate.
The bad: the disparity between high performers and low performers is still vast. High performers are shipping 106x faster, 208x more frequently, recovering 2,604x faster, and achieving a change failure rate that’s 7x lower.

Accelerate: State of DevOps 2019
This is the first of the State of DevOps reports to mention the performance of a specific industry. Engineering organizations that worked within retail consistently ranked among the elite performers.
The analysis attributes this pattern to the death of brick-and-mortar and the steep competition the retail industry faced online. Most importantly, the authors believe that this discovery forecasts an ominous future for low performers, as their respective industries grow more saturated. They warned engineering organizations to “Excel or Die.”
There are No Trade-Offs
Most engineering leaders still believe that a team has to compromise quality if they optimize for pace, and vice versa– but the DevOps data suggests the inverse. The authors assert that “for six years in a row, [their] research has consistently shown that speed and stability are outcomes that enable each other.”
This is in line with Continuous Delivery principles, which prescribe both technical and cultural practices that set in motion a virtuous circle of software delivery. Practices like keeping batch size small, automating repetitive tasks, investing in quick issue detection, all perpetuate both speed and quality while instilling a culture of continuous improvement on the team.
Thus for most engineering organizations, transitioning to some form of Continuous Delivery practices shouldn’t be a question of if or even when. Rather, it should be a question of where to start.
The Path Forward: Optimize for DORA’s Four Key Metrics
The DORA analysts revealed that rapid tempo and high stability are strongly linked. They identified that high-performing teams achieve both by tracking and improving on the following four key metrics.
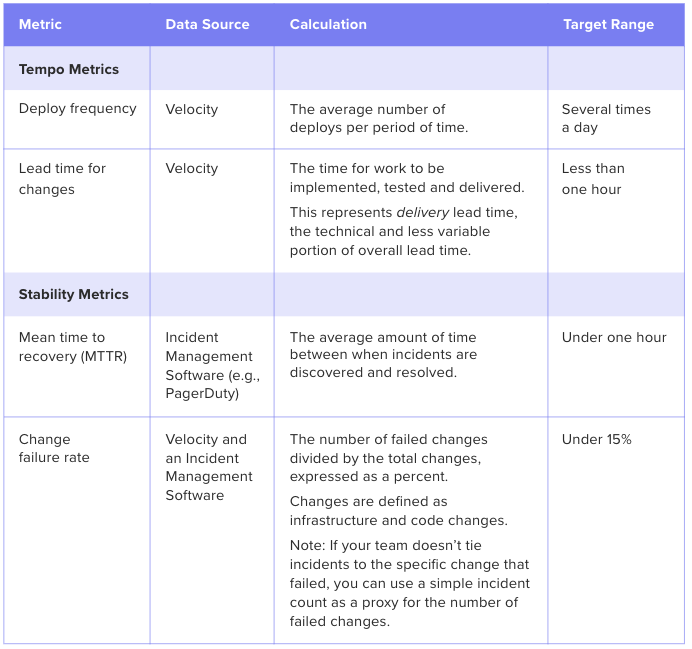
Software Engineering Intelligence (SEI) solutions provide out-of-the-box visibility into key metrics like Deploy Frequency and Lead Time. The analytics tool also reveals underlying drivers, so engineering leaders understand what actions to take to drive these metrics down.

This post is the second article in our Tactical Guide to a Shorter Cycle Time five-part series. Read the previous post here.
You discover your engineering team has a long Cycle Time compared to the rest of the organization or compared to the industry’s top performers. Now what?
When we ran an analysis on 19k+ contributors’ data, we uncovered that of all the identified key drivers, a low Time to Open (time between the earliest commit in a pull request and when the pull request is opened) had the highest correlation to a short Cycle Time.

The correlation coefficient chart above illustrates that Time to Open has the highest impact on overall Cycle Time of all analyzed drivers.
Since Time to Open is a component of Cycle Time, it’s natural to expect some correlation. What’s remarkable, however, is that work practices that take place before a pull request is opened have a higher impact on Cycle Time than those that take place after (including the Code Review process).
This data supports the most important principle of Continuous Delivery: keeping batch sizes small has significant positive downstream effects. By virtue of being small and discreet, each change will easily move through each phase of the software delivery process:
- Review will happen sooner because reviewers perceive the work to be less challenging and time-consuming to review.
- Approval will happen sooner because there will be fewer back-and-forths and the revisions will be less substantial.
- Deploy will happen sooner since less work in progress combined with lower risk encourages developers to deploy quickly.
Time to Open is thus one of the most impactful software metrics and serves as a great starting point for optimizing your Cycle Time.
Scoping the Opportunity for Improvement
Before going in and making changes to improve Time to Open, you’ll want to have an understanding of what “good” looks like. You can look at this metric team-to-team to see how your top performers are doing:
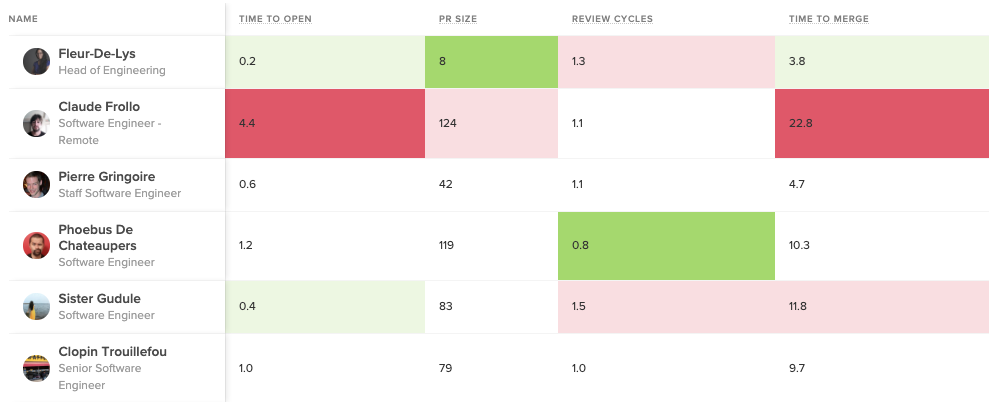
Bright green represents the top 5%, while bright red represents bottom 5% in each metric.
You can also gauge the performance of your entire organization by comparing them to the industry average. This will help you understand your starting point and how to benchmark progress.
Our data analysis reveals the following benchmarks for Time to Open:
- The top 25% of engineering orgs open pull requests in under 3 hours on average
- The industry median is about one day
- The bottom 25% take over two days to open a pull request

Once you know how your teams and your organization as a whole are doing, you can start diving into where, specifically, your team is experiencing friction in the beginning of your software delivery process.
Time to Open Diagnostics
A long Time to Open indicates one or several of three things might be happening on your team:
- Batch sizes are too large, evidenced by the Pull Request Size metric
- There is a high amount of code churn, evidenced by the Rework metric
- There’s a lot of multi-tasking and task-switching, evidenced by the amount of Work in Progress there is at any one given time.
Use the software metrics below as signals in conjunction with qualitative data to understand how to improve your Time to Open.
Pull Request Size
Look at pull request sizes (i.e., batch sizes) to see whether your team is consistently pushing small, easy-to-review changes. Our analysis shows that high-performing teams typically open PRs that are smaller than 150 LOC.
Look at this metric for the entire organization, each team, and then individuals to isolate the problem.
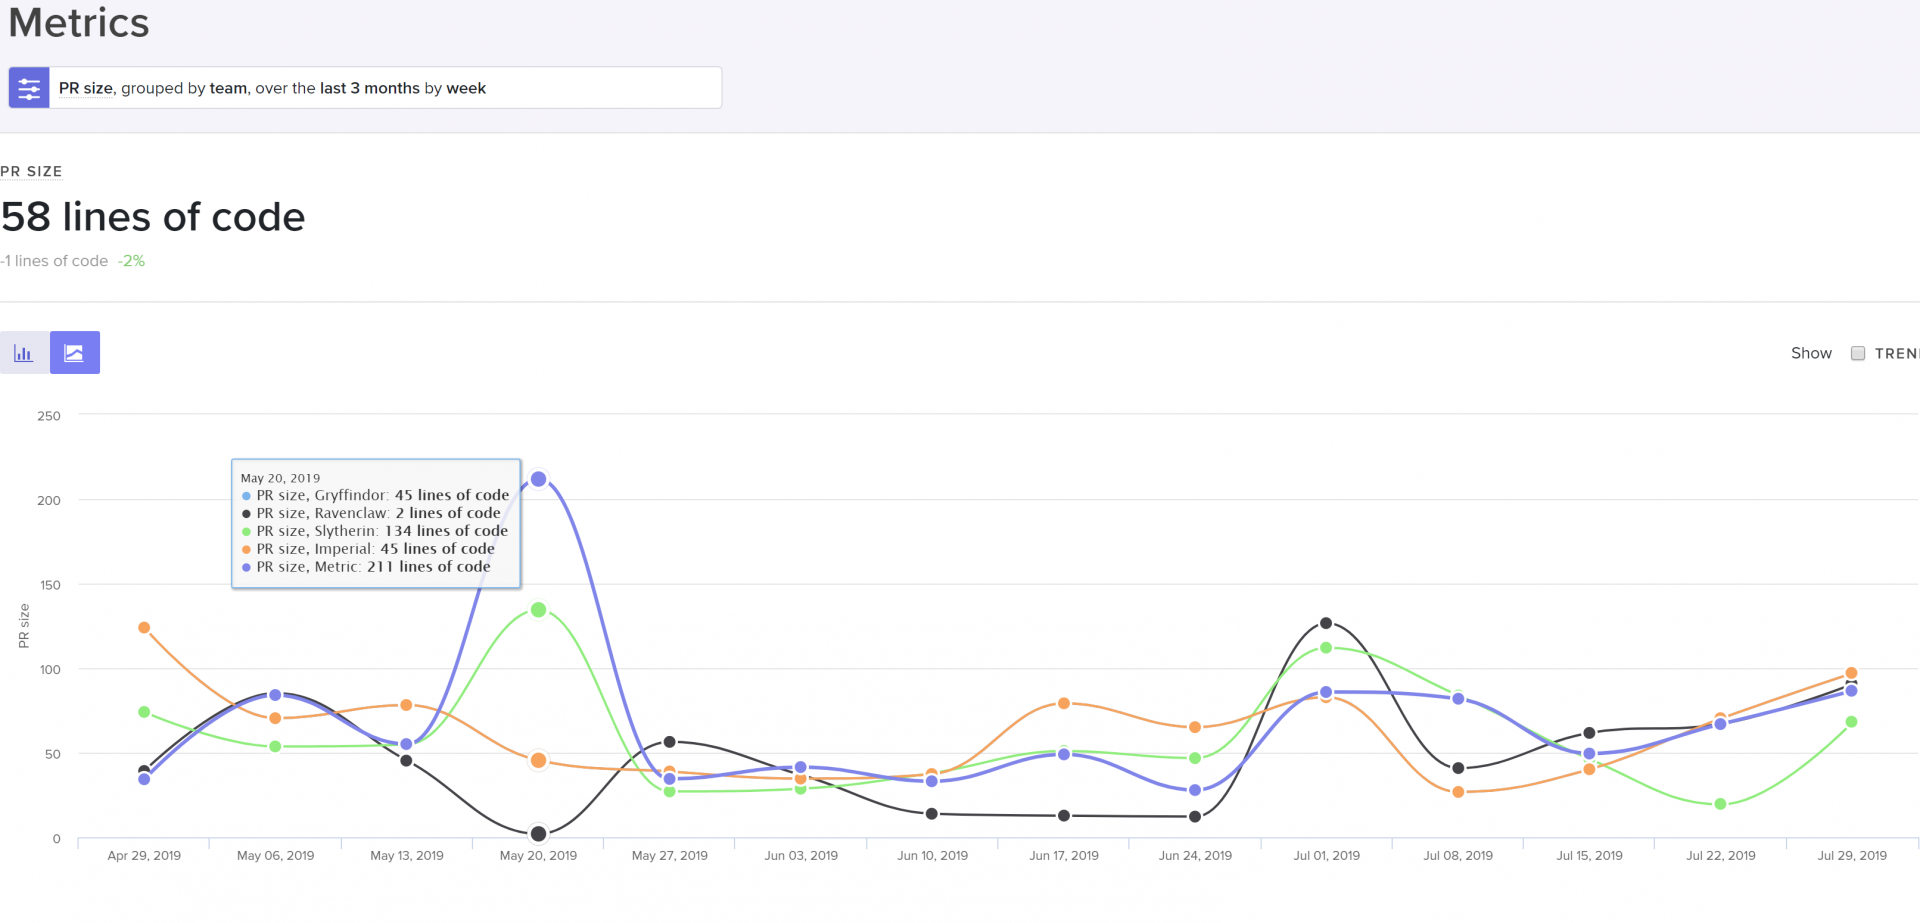
PR size grouped by team, cohort, or individual to help identify the scope of the problem.
If PR Size is high, it may indicate:
- The practice of pushing small batch sizes isn’t viewed as important,
- There’s a lack of experience with keeping batch sizes small,
- Your team hasn’t built up this habit yet
When large PR sizes are systemic across your team or organization, bring this data into discussions with your managers to find out why the team feels comfortable with large changes. Encourage teams to optimize this metric until it drives down Cycle Time and the effects of less bottlenecks are felt.
When this metric is high for an individual, it presents a coaching opportunity. Encourage mentors to show how to approach problems with smaller, more incremental changes.
Rework
We define Rework, or code churn, as a percentage of code changes in which an engineer rewrites code that they recently updated (within the past three weeks). We’ve found that top-performing teams keep their Rework under 4%, but this number can vary.
While some Rework is a natural and expected part of the software development process, high or increased Rework indicates wasted effort that is both slowing down productivity and frustrating engineers.
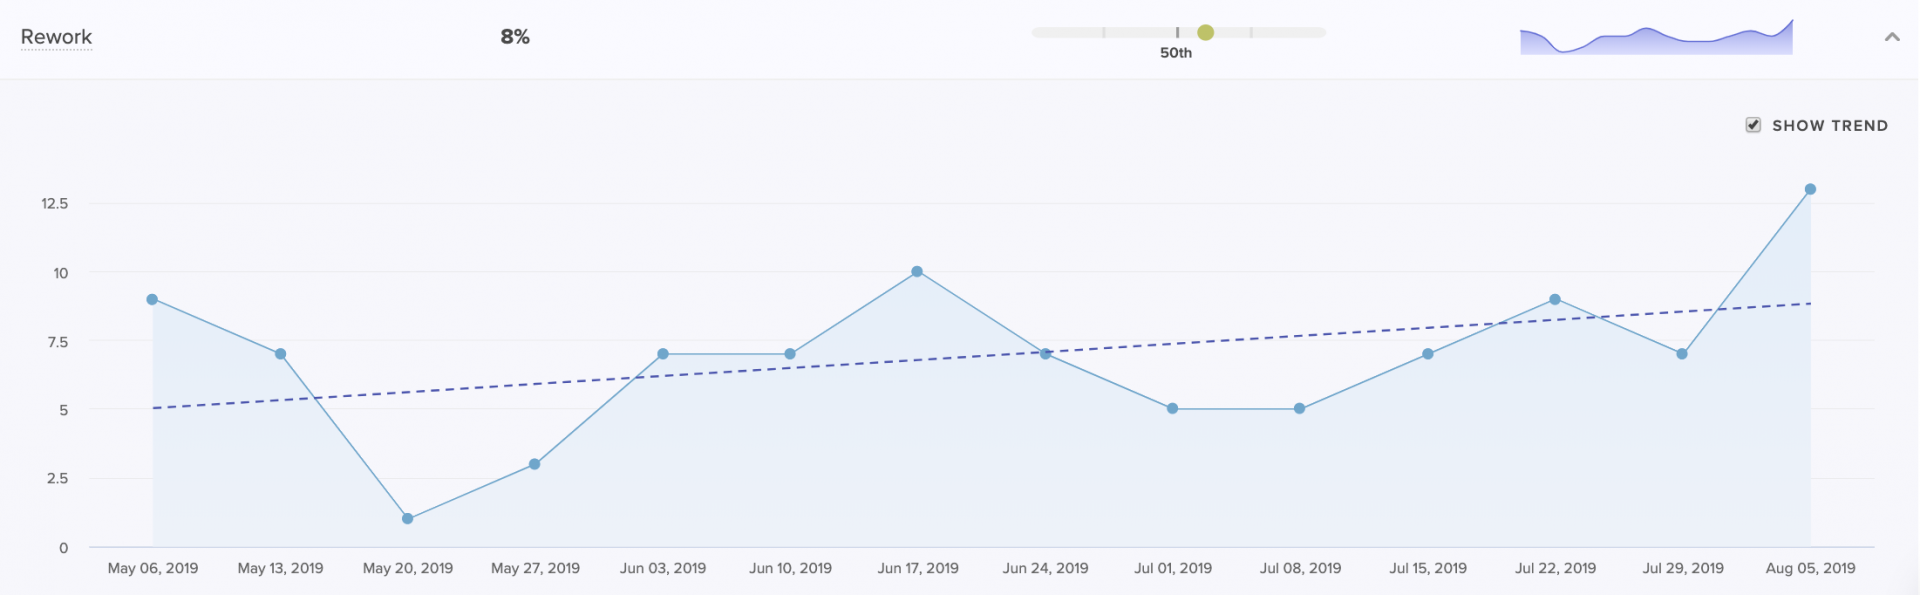
A Coaching Summary for managers to see how Rework of a particular team or individual compares to the rest of the org.
High Rework on the team or organization level can be a signal that there was a misalignment between product and engineering. It often indicates unclear technical direction or consistently late changing product requirements.
When Rework is high for individuals, it’s often a symptom of a lack of experience. Newer team members tend to have higher Rework. If this isn’t decreasing significantly throughout the onboarding of a team member or cohort, consider improving onboarding or mentoring processes.
Work in Progress (WIP)
A principle of lean product development, often discussed in the context of Kanban, is limiting Work in Progress. Practically, this means your team should be consistently progressing the unit of work that is closest to complete so that context-switching is minimal.
Looking at WIP per contributor helps you understand whether your teams are juggling multiple tracks of work, slowing the time to completion for each.
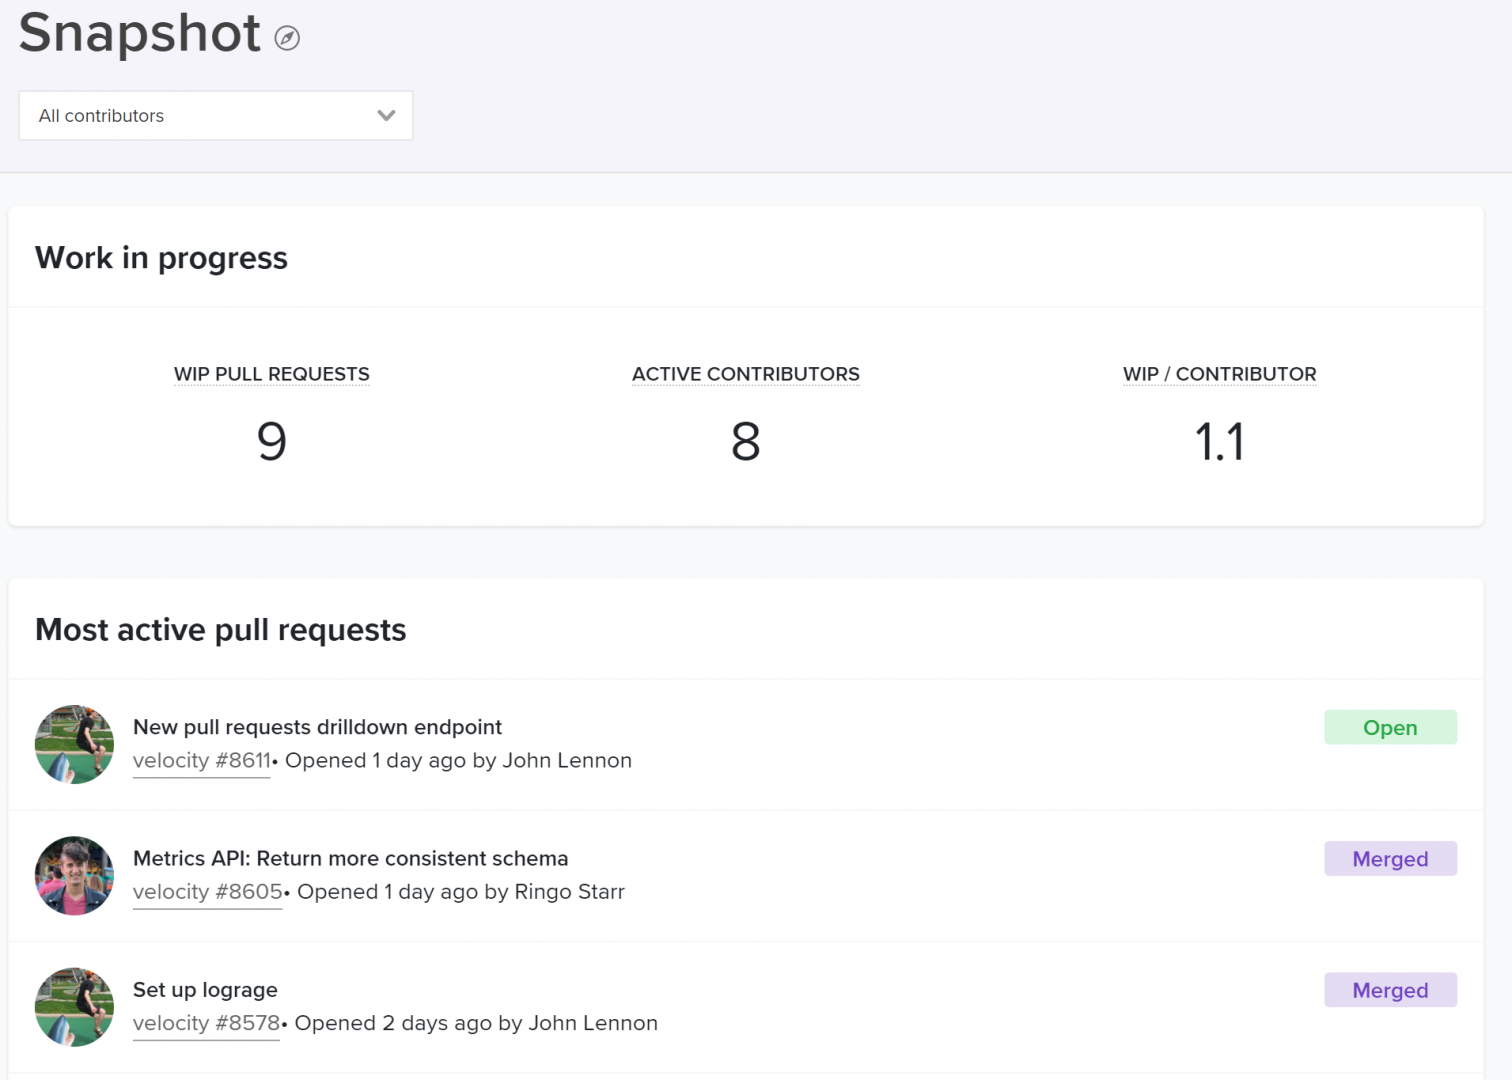
The WIP per contributor with a breakdown of the most active pull requests below.
High WIP for your team or organization is another indication of unclear or conflicting priorities, which cause team members to abandon work and move onto the next project. Similarly, high WIP per Contributor can be systemic in a team with too many dependencies. When team members are constantly blocked, they have no choice but to move forward onto other tracks of work.
High WIP for an individual can be indicative of a bad work habit and should be addressed by mentors or managers through coaching.
What’s Next
The effects of improving Time to Open will immediately improve Cycle Time and team morale. Once engineers feel unblocked and see the impact of their work more frequently, they’ll be eager to uncover more opportunities to further optimize how they work. This will set in motion a Virtuous Circle of Software Delivery which managers can use to facilitate a culture of continuous improvement.
To learn where your team should focus next, stay tuned for the upcoming articles in our Tactical Guide to a Shorter Cycle Time five-part series:

This post is the first article in our Tactical Guide to a Shorter Cycle Time five-part series.
Low Cycle Time is a characteristic of high performing teams–and the authors of 9 years of DevOps Reports have the data to prove it. In their book, Accelerate, they’ve found a direct link between Cycle Time and innovation, efficiency, and positive engineering culture.
Our data analysis of over 500 engineering organizations corroborates their findings. It also reveals helpful benchmarks for teams to gauge how they compare to the rest of the industry. We’ve uncovered that:
- The top 25% achieve a Cycle Time of 1.8 days
- The industry-wide median is 3.4 days
- The bottom 25% have a Cycle Time of 6.2 days
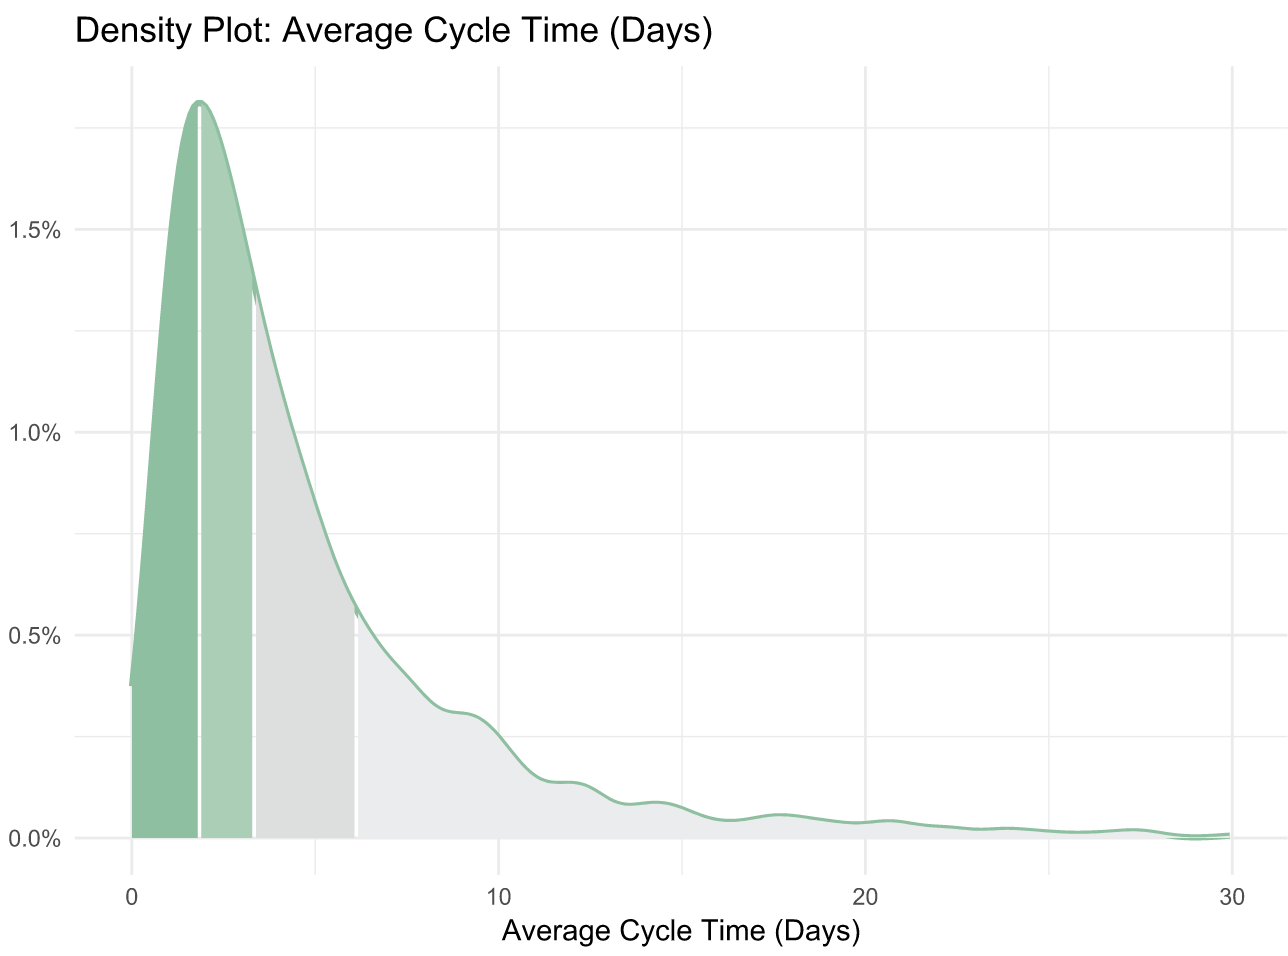
The Accelerate authors discovered the “elite” performers (making up just 7% of the industry) reach a Cycle Time of less than one hour. This means that the median Cycle Time is 80 times higher than that of the best performing organizations. This spread suggests that the majority of the industry either doesn’t measure Cycle Time, doesn’t know what a good Cycle Time is, or doesn’t know how to fix it.
This is why today, we’re kicking off our Tactical Guide to a Shorter Cycle Time, a 5-part series to help you accomplish all of the above.
The Virtuous Circle that Spurs Continuous Improvement
We define Cycle Time as the time between first commit and deploy of a changeset. Whether or not your definition matches ours precisely, optimizing the amount of time between these two events will significantly improve your engineering team’s efficiency (we’ve observed increases of at least 20%).
Measuring and improving this metric has a long term effect that’s even more significant than the initial bump in productivity. It sets in motion a Virtuous Circle of Software Delivery, in which optimization that encourages better engineering practices, paired with the positive reinforcement that comes from unblocking, encourages more optimization that sparks better coding practices, and so on.
The process of improving each portion of your Cycle Time will create a culture of Continuous Improvement on your team.
Where to Start
First, you’ll want to know what your Cycle Time is and how it compares to the industry average.
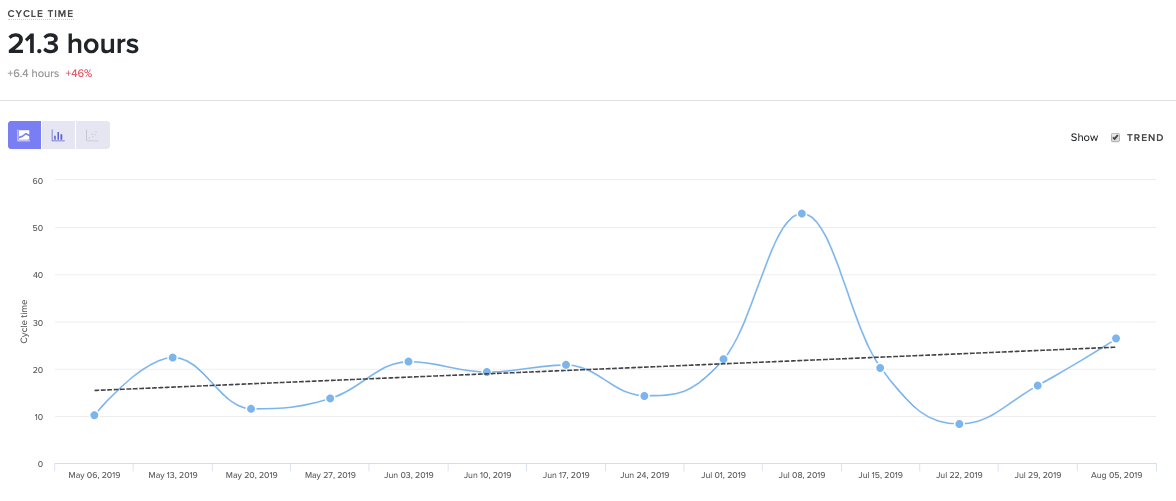
Cycle Time with 3 years of historical data out of the box.
At face value, Cycle Time is a great metric to gauge success, but it isn’t diagnostic. To understand why your Cycle Time is high or low, you’ll want to look at its four constituents:
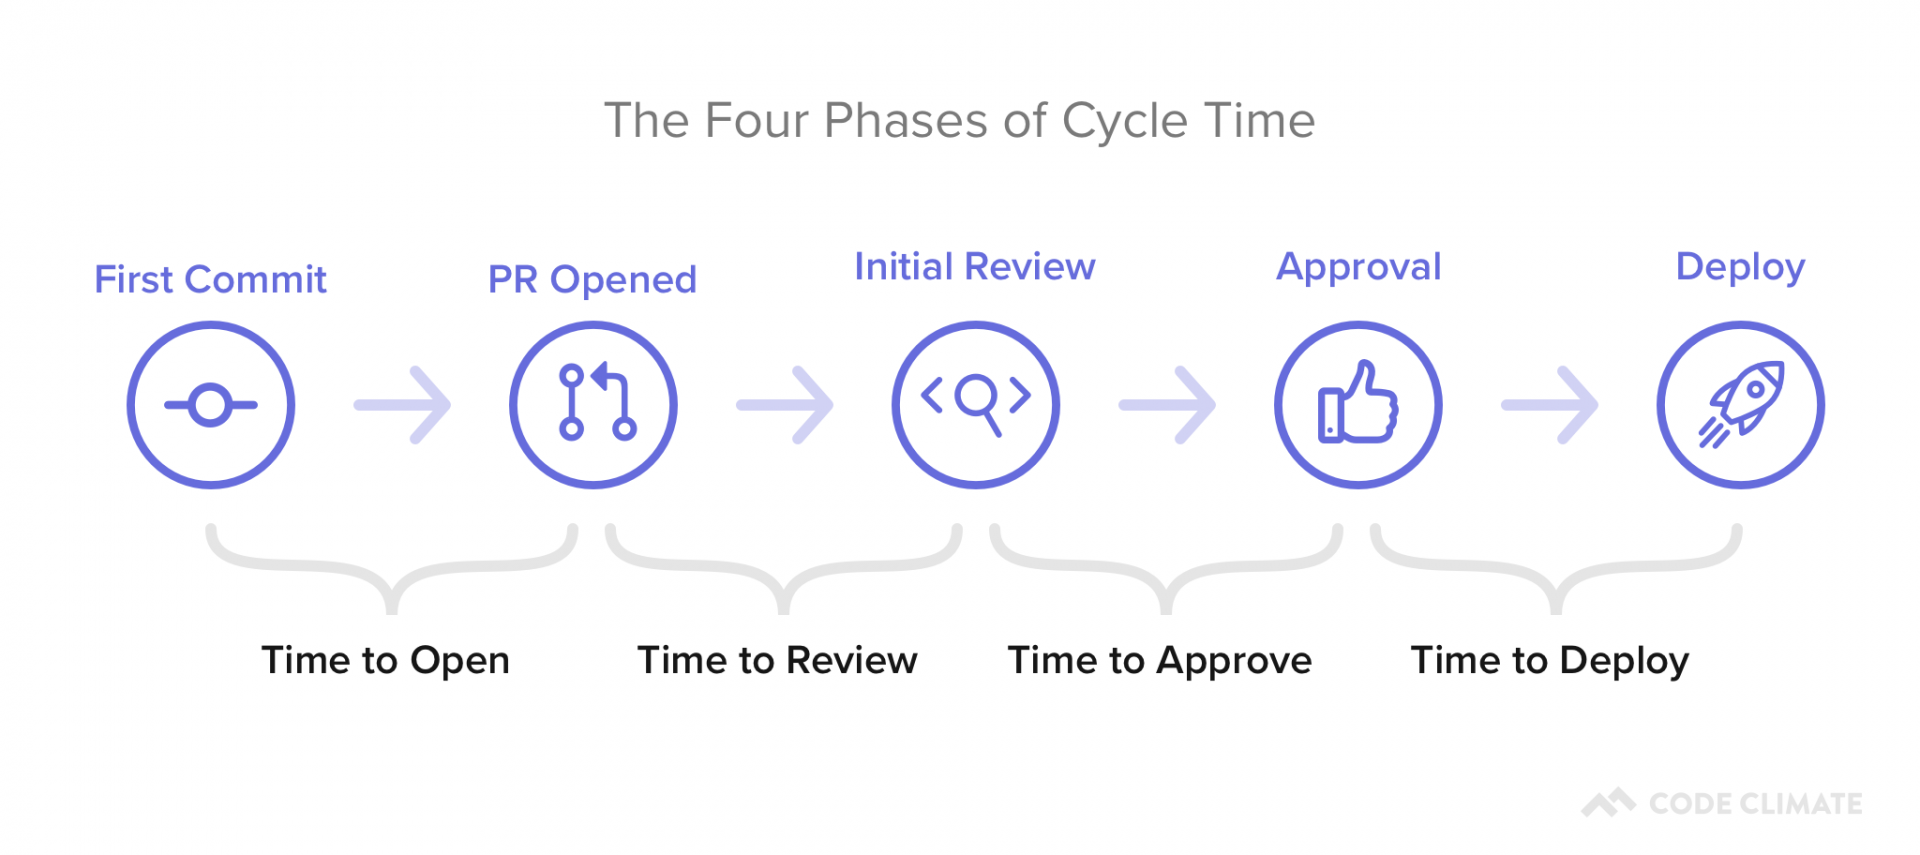
- Time to Open: The time between an engineer’s first commit and when they open a pull request in their version control system. Our data shows that this metric has the highest correlation with Cycle Time, so this is a great place to start optimizing.
- Time to Review: The time between when a pull request is opened and when it receives its first review. Delays at this stage incentivize multi-tasking, so you’ll want to minimize the time a PR is left waiting for review.
- Time to Approve: The time between when a pull request receives its first review and when it is approved, also known as the Code Review process. You don’t want to completely minimize the time spent in this phase, but you do want to make sure you reduce inefficiencies while still getting the value on Code Review you anticipate.
- Time to Deploy: Any additional time following the pull request approval, before the change reaches production.
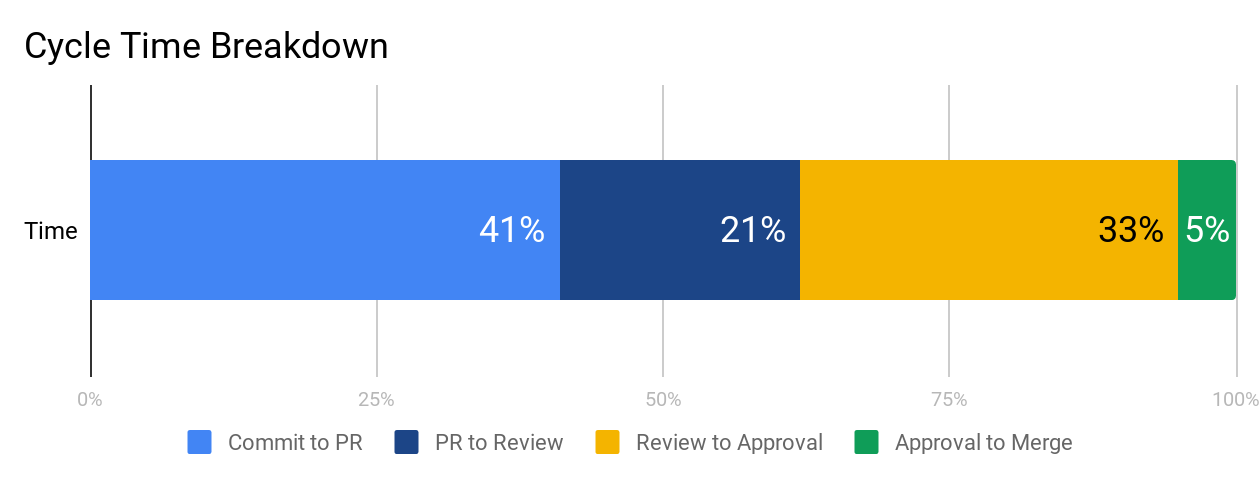
You can plot these metrics side-by-side and look at them in terms of hours or percentage of time spent, so you know what your team’s starting point is before optimizing.
We recommend working on each phase from left to right because inefficiencies tend to compound from earlier stages. When a very large pull request is opened, it also affects how long it’ll wait for review and how likely it is to get stuck in the code review process. Start with Time to Open to ensure your team has streamlined individual practices before moving on to collaborative ones.
What’s Next
The next four parts of our series will dive deep into each component of Cycle Time:
- Part I: The Virtuous Circle of Software Delivery
- Part II: The Single Greatest Lever in Shortening Cycle Time
- Part III: How to Stop Code Review from Bottlenecking Shipping
- Part IV: Keep Code Review from Being a Waste of Everyone’s Time
- Part V: The Last Mile to True Continuous Delivery
We’ll include industry benchmarks, based off our analysis of 500+ engineering teams’ data, further data points to investigate, and tactical advice on how to improve each stage.