
Code Climate
OpenTable is a renowned leader in restaurant tech, with products that anticipate the ever-evolving needs of both restaurants and diners. Its website, opentable.com — which helps restaurants fill more than 1.6 billion seats a year — is supported by globally distributed teams of engineers.
In 2019, the site was rearchitected, and OpenTable was faced with the challenge of bringing together many teams as the commercial site was rebuilt as a monolith. During this project, Code Climate supported engineering leaders in gaining further visibility into their engineering processes, which enabled them to bring consistency and reliability to development — ultimately empowering their teams to collaborate more effectively.
Reliable Engineering Management with Code Climate
John Nolan, Senior Director of Engineering at OpenTable, said their approach to rearchitecting was essential for consolidating ideas and ensuring consistency across many globally distributed teams. Code Climate helped them to better measure effectiveness and more easily identify bottlenecks that might hold up progress.
After learning about the benefits of Software Engineering Intelligence platforms at a Code Climate event, Nolan knew Code Climate could provide the insight OpenTable needed to more formally measure engineering impact.
Code Climate delivered insight into engineering processes so that the business could better understand if their changes were effective. For instance, he was able to see the changes over time in Code Climate for metrics like Pull Request (PR) Throughput and Cycle Time.
The goal was to work with Code Climate and identify opportunities to help the teams work together more effectively. Ultimately, they would support improvements in efficiency and productivity as they improved communication and collaboration. In the first year, PR Throughput per Contributor increased by 40%. With more people working more productively, the team realized gains in output.
“Code Climate gave us valuable data to see that the things we were doing were solving the problems that we needed to,” Nolan said. “We saw metrics get better because we were building the right things in the right way.”
Critical Insight for Engineering Leadership
Nolan is in a new role and another step away from the code, and he finds the insight from Code Climate valuable in understanding the complexities of the engineering organization at OpenTable. Both standard and custom reports have proven helpful in identifying activity patterns and maintaining development speed across their widely distributed teams. He said that, while individual engineering managers often know about their own teams’ activities, the visibility Code Climate provides is useful in identifying trends and understanding team-by-team activity.
OpenTable has expanded Code Climate use and has now deployed the platform across all product engineering teams throughout its global engineering organization. Because Code Climate built its solution with enterprises in mind, with an unique ability to ingest and normalize data with reliability and speed at scale, supporting the engineering team at OpenTable to better visualize metrics and understand engineering impact and team health.
“It's invaluable to have a glance at teams' health and have the data necessary to understand where we need to address any issues,” he said.
After OpenTable again expanded their partnership with Code Climate, it has further increased visibility and supported leaders in identifying more opportunities to improve throughput and move faster as an organization. With that information, it was possible for the organization to make changes that kept PR Throughput high while decreasing Cycle Time by 57% and Time to Merge by 23%.
Code Climate supports OpenTable with the data they need. With Code Climate, they have the visibility and understanding necessary to maintain consistency across teams, ensure efficiency, and cultivate a culture of engineering excellence throughout the organization.
Key Highlights
- In the first year, PR Throughput per contributor increased by 40%
- In 2023, OpenTable saw a 57% decrease in Cycle Time
- In 2023, they saw a 23% decrease in Time to Merge
To find out how Code Climate can support you in identifying opportunities for improvement, speak to an expert.
The DORA research group, (DevOps Research and Assessment), now part of Google Cloud, identified four key software engineering metrics that their research showed have a direct impact on the teams' ability to improve deploy velocity and code quality, which directly impacts business outcomes.
The four outcomes-based DORA metrics include two incident metrics: Mean Time to Recovery (MTTR) (also referred to Time to Restore Service), and Change Failure Rate (CFR), and two deploy metrics: Deployment Frequency (DF) and Mean Lead Time for Changes (MTLC).
Gaining visibility into these metrics offers actionable insights to balance and enhance software delivery, so long as they are considered alongside other key engineering metrics and shared and discussed with your team.
The Mean Time to Recovery metric can help teams and leaders understand the risks that incidents pose to the business as incidents can cause downtime, performance degradation, and feature bugs that make an application unusable.
What is Mean Time to Recovery?
Mean Time to Recovery is a measurement of how long it takes for a team to recover from a failure in production, from when it was first reported to when it was resolved. We suggest using actual incident data to calculate MTTR, rather than proxy data which can be fallible and error-prone, in order to improve this metric and prevent future incidents. While the team may experience other incidents, MTTR should only look at the recovery time of incidents that cause a failure in production.
Why is Mean Time to Recovery Important?
Even for high-performing teams, failures in production are inevitable. MTTR offers essential insight into how quickly engineering teams respond to and resolve incidents and outages. Digging into this metric can reveal which parts of your processes need extra attention; if you’re delivering quickly but experiencing frequent incidents, your delivery is not balanced. By surfacing the data associated with your teams’ incident response, you can begin to investigate the software delivery pipeline and uncover where changes need to be made to speed up your incident recovery process.
Recovering from failures quickly is key to becoming a top-performing software organization and meeting customer expectations.
What is a good Mean Time to Recovery?
Each year, the DORA group puts out a state of DevOps report, which includes performance benchmarks for each DORA metric, classifying teams as high, medium, and low-performing. One of the most encouraging and productive ways to use benchmarking in your organization is to set goals as a team, measure how you improve over time, and congratulate teams on that improvement, rather than using “high,” “medium” and “low” to label team performance. Additionally, if you notice improvements, you can investigate which processes and changes enabled teams to improve, and scale those best practices across the organization.
More than 33,000 software engineering professionals have participated in the DORA survey in the last eight years, yet the approach to DORA assessment is not canonical and doesn’t require precise calculations from respondents, meaning different participants may interpret the questions differently, and offer only their best assumptions about their teams’ performance. That said, the DevOps report can provide a baseline for setting performance goals.
The results of the 2022 State of DevOps survey showed that high performers had a Mean Time to Recovery of less than one day, while medium-performing organizations were able to restore normal service between one day and one week, and low-performing organizations took between one week and one month to recover from incidents. For organizations managing applications that drive revenue, customer retention, or critical employee work, being a high performer is necessary for business success.
How To Improve Your Mean Time to Recovery
Visibility into team performance and all stages of your engineering processes is key to improving MTTR. With more visibility, you can dig into the following aspects of your processes:
Work in Progress (WIP)
A long MTTR could indicate that developers have too much WIP, and lack adequate resources to address failures.
Look at Other Metrics and Add Context
One of the benefits of using a Software Engineering Intelligence (SEI) platform is that you can add important context when looking at your MTTR. An SEI platform like Code Climate, for example, allows you to annotate when you made organizational changes — like adding headcount or other resources — to see how those changes impacted your delivery.
You can also view DORA metrics side by side with other engineering metrics, like PR Size, to uncover opportunities for improvement. Smaller PRs can move through the development pipeline more quickly, allowing teams to deploy more frequently. If teams make PR Sizes smaller, they can find out what’s causing an outage sooner. For example, is debugging taking up a lot of time for engineers? Looking at other data like reverts or defects can help identify wasted efforts or undesirable changes that are affecting your team’s ability to recover, so you can improve areas of your process that need it most.
Improve Documentation
What did you learn from assessing your team’s incident response health? Documenting an incident-response plan that can be used by other teams in the organization and in developer onboarding can streamline recovery.
Set Up an Automated Incident Management System
To improve your team’s incident response plan, it’s helpful to use an automated incident management system, like Opsgenie or PagerDuty. With an SEI platform like Code Climate you can push incident data from these tools, or our Jira incident source, to calculate DORA metrics like MTTR. In Code Climate's platform, users can set a board and/or issue type which will tell the platform what to consider an “incident.”
Talk to Your Team
We spoke with Nathen Harvey, Developer Advocate at DORA and Google Cloud, for his perspective on how to best use DORA metrics to drive change in an organization. Harvey emphasized learning from incident recovery by speaking with relevant stakeholders.
Looking at DORA metrics like Mean Time to Recovery is a key starting point for teams who want to improve performance, and ensure more fast and stable software delivery. By looking at MTTR in context with organizational changes and alongside other engineering metrics, speaking with your team after an incident, and documenting and scaling best practices, you can improve MTTR overall and ultimately deliver more value to your customers.
Learn how you can use these metrics to enhance engineering performance and software delivery by requesting a consultation.

In 2022, IT spending for organizations worldwide exceeded $4.4 trillion, underscoring the essential role of tech in today’s economy. Gartner’s research shows that investment in technology is key to business success, spurring a heightened focus on the software engineering organizations behind that technology.
Engineering organizations are now under greater pressure to maximize ROI, effectively allocate resources, communicate with stakeholders on progress, and deliver quality software quickly. To achieve this, engineering leaders need visibility into engineering processes, where resources are going, and how their teams are working.
The challenge of visibility in engineering
In the past, leaders have relied on homegrown solutions and surveys to assess the state of the engineering organization. These solutions can be error-prone and time consuming, requiring leaders to manually gather information from a variety of sources like project management tools and version control systems.
To gain critical context and dependable data, leaders should leverage a Software Engineering Intelligence (SEI) platform. An SEI platform ingests, cleans, links, and analyzes data from teams’ existing systems, surfacing those insights via alerts, custom reporting, and intuitive visualizations. This gives leaders the visibility they need to evaluate tradeoffs, mitigate risk, enhance communication, boost engineering efficiency, and improve value delivery.
Gartner predicts that 70% of organizations will have an SEI platform by 2026, up from 5% in 2023.
(Source: Innovation Insight for Software Engineering Intelligence Platforms, March, 2023)
How can engineering leaders best evaluate which SEI platform is the best option for their organization?
We’ve put together a comprehensive buyer’s guide outlining what leaders should look for in an SEI platform, including key features and capabilities.

We recommend assessing SEI platforms on the following categories:
- Process and Team Health: An SEI platform should provide a multidimensional picture of team health, while adapting to variations in team process.
- Allocations and Business Value: It’s imperative that an SEI platform help leaders accurately assess resource allocation and quantify engineering impact.
- Efficiency and Predictable Delivery: The right SEI platform should help leaders improve their team’s ability to deliver code consistently, predictably, and at high quality.
- Team Effectiveness: An SEI platform will offer insight into whether interruptions, wasted work, or other factors are impacting engineering’s ability to deliver value.
- Data Hygiene and Analysis: The best SEI platform will deliver trustworthy insights while working in tandem with the tools and workflows a team is already using.
- Scalability and Customization: An SEI platform should be able to meet the unique needs of complex, large, and ever-evolving organizations.
- Security: The best SEI platforms will prioritize the security of your data.
Code Climate’s enterprise-level insights platform is the only one to offer enterprise-grade security and scalability. From day one, Code Climate maximizes engineering impact with trusted and actionable insights for leaders and teams at all levels — from capacity and delivery to quality, culture, and costs.
As outlined in the guide, Code Climate's platform provides unique advantages in four key areas:
- Clear Focus on Improving the Efficiency and Output of Engineering Teams: Code Climate's platform provides critical visibility into development processes, including insights for coaching and for improving the overall health and efficiency of an engineering organization.
- Security and Scalability for Large, Complex Organizations: Code Climate adapts to our customers’ needs, and our security and scalability capabilities are built to handle the largest enterprises.
- Personalized Customer Experience: Code Climate offers a superior customer experience from Day 1, with white-glove support, thorough technical onboarding, multiple training options, and a consultative approach to change management.
- Customizations That Adapt to How Our Customers Work: Code Climate's platform is highly customizable, adapting to the way our customers work. The platform offers autonomy for each of your engineering teams so that they can best leverage metrics to improve performance.
Download the complete guide to choosing an SEI platform and find out more about the advantages of SEI, including what to look for when evaluating each of the key capabilities, and a detailed breakdown of how Code Climate measures up.

Engineering teams know that technical debt, or “tech debt,” is an inevitable, and often necessary, part of software development. Yet, it can be difficult to explain the significance of tech debt to stakeholders and C-suite leadership. While stakeholders might want to prioritize constant innovation over paying down tech debt, letting tech debt build up can ultimately slow down an engineering team. When that happens, it can be challenging to prove that the resulting delays and complications don't fully reflect an engineering team's adeptness.
What are the reasons an engineering team might accrue tech debt, and how can they overcome it before it impacts delivery?
What is technical debt?
Technical debt is a term used to describe the implications of immature code being pushed through the software development pipeline to expedite delivery. Because the code was merged prematurely, or was a quick fix to a complex problem, it often needs to be refactored or redone, resulting in a backlog of work that will need to be taken on at some point in the future.
The term "technical debt" was first coined by Ward Cunningham, who posited that "a little debt speeds development so long as it is paid back promptly with refactoring. The danger occurs when the debt is not repaid."
Tech debt can be thought of similar to financial debt. Taking out a loan for a larger purchase makes it possible to expedite the purchase, rather than waiting to save up a large sum of cash. In exchange, you must repay the loan plus interest, which builds up exponentially over time.
With technical debt, the interest is not only the extra developer time spent refactoring the code, but the consequences resulting from not addressing that refactoring early on. As the work builds up and other work is prioritized, going back to deal with the technical debt becomes increasingly costly and difficult. In this sense the time needed to address tech debt grows, similar to interest.
Reasons for accruing technical debt
First, it's important to note that technical debt is inevitable in order to remain competitive in the industry, and doesn't necessarily imply that an engineering team has done something "wrong."
Similar to financial debt, there are reasons for intentionally racking up technical debt. The marketplace today moves lightning fast and, to stay afloat, you might opt for shortcuts that lead to technical debt in order to ship new features quickly and bring in revenue.
The associated tech debt you take on might be worth it when you compare it against the downsides of waiting to bring your features to the market. This is completely normal — the danger arises when, as Cunningham said, the debt isn't properly repaid.
Why should you care about technical debt?
Instead of working on developing new features, engineers are often left to work through technical debt, further slowing innovation and impacting a slew of business outcomes.
Even while there are good reasons why organizations accrue tech debt, the earlier it’s addressed, the better. It’s vital for engineering leaders to pay attention to tech debt and be aware of the issues it can pose to the organization:
- Tech debt can curtail developer productivity; one study estimates that developers spend 23% of their working time on tech debt.
- Poorly maintained code can be complex for new developers to navigate. When developers take time to improve this code, it can contribute to the overall technical debt.
- Tech debt snowballs over time.
- The longer tech debt goes unaddressed, the more expensive it will be to resolve.
Overcome technical debt by getting curious
To minimize or overcome tech debt, start by investigating the source.
Engineering leaders can take a cue from one Code Climate customer, and use a Software Engineering Intelligence (SEI) platform — sometimes known as an Engineering Management Platform (EMP) — to demonstrate how tech debt can limit deployment. The engineering team at a popular crowdsourcing platform often worked with legacy code, and had nearly a decade’s worth of tech debt.
The company’s VP of Engineering had a relatively easy time getting developers on board to prioritize the backlog of tech debt. When it came to getting executive buy-in, however, the VP of Engineering needed concrete data to present to stakeholders in order to justify dedicating resources to refactoring the legacy code.
Using Code Climate's solutions, the engineering leader was able to demonstrate, in real time, how many Pull Requests (PRs) were left open for longer than is ideal while authors and reviewers sent comments back and forth. Code Climate's insights showed this as a lasting trend with high-risk PRs stacking up. They used this as evidence to executives that legacy code was significantly impacting deployment.
Once you outline how to tackle your current tech debt, think about how you can manage new debt going forward. Team leaders might decide to be mindful of high-risk PRs and monitor them over time to ensure that tech debt does not become insurmountable; or, you may have developers take turns refactoring legacy code while others put their efforts towards innovation. Use concrete evidence from an SEI platform to request additional resources. Once you find what works, you can scale those best practices across the organization.
Adopt a holistic approach to managing technical debt
Technical debt is inevitable, and even mature engineering teams will need a strategy for mitigating the debt they’ve accrued. Communicate with your company leadership about tech debt and its implications, work to find the root cause within your teams, and adopt a slow-but-steady approach towards a resolution.
You will never be able to address and solve all technical debt at once, but you can prioritize what to tackle first and move toward a more efficient future.
A Software Engineering Intelligence platform can provide the visibility leaders need to refine engineering processes. Request a consultation to learn more. Request a consultation to learn more.

Read on for highlights from the conversation, and watch the full webinar on demand here.
In an effort to understand the markers of a productive engineering team, the DORA (DevOps Research and Assessment) group, founded by Dr. Nicole Forsgren, Jez Humble, and Gene Kim, designed their research to answer core questions about DevOps:
Does technology matter for organizations? If so, how can we improve software delivery and engineering performance?
Through rigorous academic and analytical research, the group was able to demonstrate that improving software delivery and engineering performance leads to increased profitability and customer satisfaction. They identified four key metrics, now known as the DORA metrics, which address the areas of engineering most closely associated with success, and established benchmarks, enabling engineering teams to improve performance and balance the speed and stability of their software delivery.
How can organizations get started with DORA metrics and turn those insights into action? Code Climate’s Director of GTM Strategy and Intelligence, Francesca Gottardo, sat down with DORA expert Nathen Harvey to discuss how leaders leverage DORA metrics to improve engineering team health and truly drive change in their organization.
Francesca Gottardo: How did the DORA team choose between metrics that measure the quality of software versus how quickly it was getting shipped?
Nathen Harvey: Delivering technology can enable and accelerate any business. We all want to accelerate the delivery of that technology to enable great customer experiences.
So we look at two metrics: Deployment Frequency, how frequently are you pushing changes out to your users? And Lead Time for Changes, how long does it take for code to go from committed to actually in the hands of your users? The challenge there is that moving fast is good, but not enough, so we also have two stability metrics that complement that. The stability metrics are your Change Failure Rate, what I like to call the ‘Oh, Expletive’ rate — when you push a change to production and someone shouts out an expletive – and Time to Restore, how do we as a team quickly respond and recover when there is an incident or an outage that impacts our users?
That traditional thinking leads us to believe that these two are trade-offs of one another: we can either be fast or we can be stable. But what the data shows us over almost a decade now, is that these two ideas move together in lockstep. There are teams that are good, are good at all four metrics and the teams that are performing poorly are performing poorly across all four metrics as well.
Francesca: Who are DORA metrics for? Are they best suited for a specific type or size of company?
Nathen: We've seen teams of all shapes and sizes using DORA and insights from it successfully. But there were also some challenges there. First, measuring those metrics at an organizational level doesn't really give you a whole lot of value. How frequently does Google deploy? A lot, but what are we going to learn from that?
We really want to look at an application or a service, a particular set of capabilities, if you will, that we deliver to our customers, so first we have to measure at that level. And let's also make sure that we're using or getting insights across the entirety of the team that's responsible for prioritizing, building, deploying, and operating that application or service — it often takes a cross-functional team focused on one application or service.
The technology really doesn't matter. You can use those four metrics to look at how you’re doing with the custom application that you’re building for customers, but you could also do that for the commercial off-the-shelf software that you're using to deliver to your customers, or a SaaS that you're using.
Francesca: Is there a specific type of view or a few specific metrics that a leader of a few teams should look at?
Nathen: From a leadership perspective, I think the best insights you can get from the DORA metrics are just really to understand how your teams are doing. But here's the pitfall there: you're not using this to weigh teams against one another. Instead, what DORA really tries to get at is embracing a practice and a mindset of continuous improvement.
You might want to look across your teams to understand how each team is doing, find those teams that are doing really well, and identify what lessons you can learn from that team. Of course, the context is so important here. If you're shipping a mobile application or if you're working on the mainframe, we can use those same four measurements, but we don't expect the values are going to be the same across those teams. As a leader, I think that there are really good ways to have insight into what sort of investments you need to make in the team, and what sort of support each of your teams need.
Francesca: What are some other common pitfalls you find when people start using DORA metrics?
Nathen: The biggest one is this idea that we have to reach peak performance. Really, the goal is improvement. Don't worry about how other teams are doing. It's nice to have a benchmark to understand where you sort of fit, but the more important thing is, how do you get better? In fact, looking at the four metrics, it's difficult to say, ‘How do I get better? My Deployment Frequency isn't what I want, so I need to get better.’ You don't get better just by mashing the deploy button more frequently. That's not the right approach. The research actually goes a little bit deeper beyond those four key metrics into some capabilities — practices or tools or things that your team does regularly.
The capabilities that the research investigates are technical capabilities like version control, continuous integration, and continuous testing. There are also process capabilities: How much work do you have in-flight at any given time? Maybe shrink down your amount of work-in-progress. What does that change approval look like? Focusing on that change approval process is maybe the thing that's going to unlock value.
Most important of the capabilities are the cultural capabilities. How do the people in your team show up? How do they communicate and collaborate with one another? How are they rewarded? What's incentivized? All of these things really matter, and DORA is really about taking that comprehensive view of what capabilities a team needs to improve in order to drive those four metrics.
Francesca: What is the starting point that you recommend leaders look at?
Nathen: One of the beautiful things about these four metrics is thinking about them holistically. You may want to improve Deployment Frequency, but do you know how you're going to get there? You're going to make your lead times shorter. You're going to make your Change Failure Rate go down and you're going to restore service faster. It doesn't matter which one you focus on; changes are likely going to have good impacts across all four, and we really encourage you to look at all four as a whole.
How do you get started from there? You really then need to go deeper into the capabilities. Start with the capabilities where your teams have a lot of opportunity for growth. It's really about finding your constraint and making improvements there.
Francesca: And you would say as you're measuring that opportunity for growth, it's really relative to the benchmark, correct?
Nathen: Oh, absolutely. Let's say that continuous integration popped up as the thing that you should focus on. Now we have to figure out how we get better at continuous integration. Let's go put some new things in place. Those new things might be new measures, so we can test how well we're doing with continuous integration. There's certainly going to be new practices, maybe even new technologies, but after you've made some of that investment, you have to go back to those four key metrics, back to the benchmarks. Did this investment actually move those metrics in the way that we expected it to?
Francesca: Sometimes leaders can have a hard time getting buy-in for new forms of measurement, or the individual developers on a team have seen a lot of flawed measurement and can be skeptical. How do you suggest that leaders get their teams on board to be measured like this?
Nathen: Yeah, I don't like to be measured either. I get it. I think honestly, the best way to help teams get on board with this is for leaders to share the idea of these metrics and then step out of the way and give the teams the autonomy that they need to make the right choices. If a leader comes to me and says, ‘I'm going to measure your team's performance based on these four metrics,’ that's fine, but what I don't want that leader to do is tell me exactly how to improve those four metrics, because the leader isn't attached to the daily work of our team. But if that same leader says, ‘These are the metrics by which you'll be measured and we want to improve these metrics, what can we do?’ Now, as a team, we’ve been given that trust and the autonomy to select where we should invest and what we should do. A leader's job really is to support that investment, support that learning of the team.
Francesca: How could you ensure that you're comparing kind of apples to apples as you're looking at DORA metrics for teams that may be looking or working in different platforms?
Nathen: You are in fact comparing apples to oranges, and so the thing that I encourage folks to do is celebrate the teams that make the most progress. Maybe you can get to a derivative: This team increased their Deployment Frequency by 10%, this team increased their Deployment Frequency by 50%. Maybe that 50% team went from annual deployments to twice a year, but that's still a 50% improvement, and that's worthy of celebration. I think really looking at the progress that you're making instead of the raw numbers or that sort of benchmark data is the best way to go.
Francesca: One thing I've heard is that it's really important for teams to improve to a higher performance bucket, rather than stay within that bucket.
Nathen: We put out an annual report and people are hungry for benchmarks, and they really want those benchmarks and want to understand how they measure up to peers, to others in the industry. And each year, we do a cluster analysis of those four key measures, and these clusters emerge from the data. We don't set in advance what it means to be a low performer or medium performer. We let the data answer that question for us, but then we have to put labels on those clusters to make them consumable by a leader and by teams, and unfortunately, we use labels like low or medium or high or elite.
Nobody wants to be a low performer. It's not very encouraging to show up to work as a low performer. But I try to encourage folks to recognize that this is not a judgment and maybe just discard the label; it's about that improvement. How are you making progress against that? As you're making changes, you're likely to have some setbacks as well.
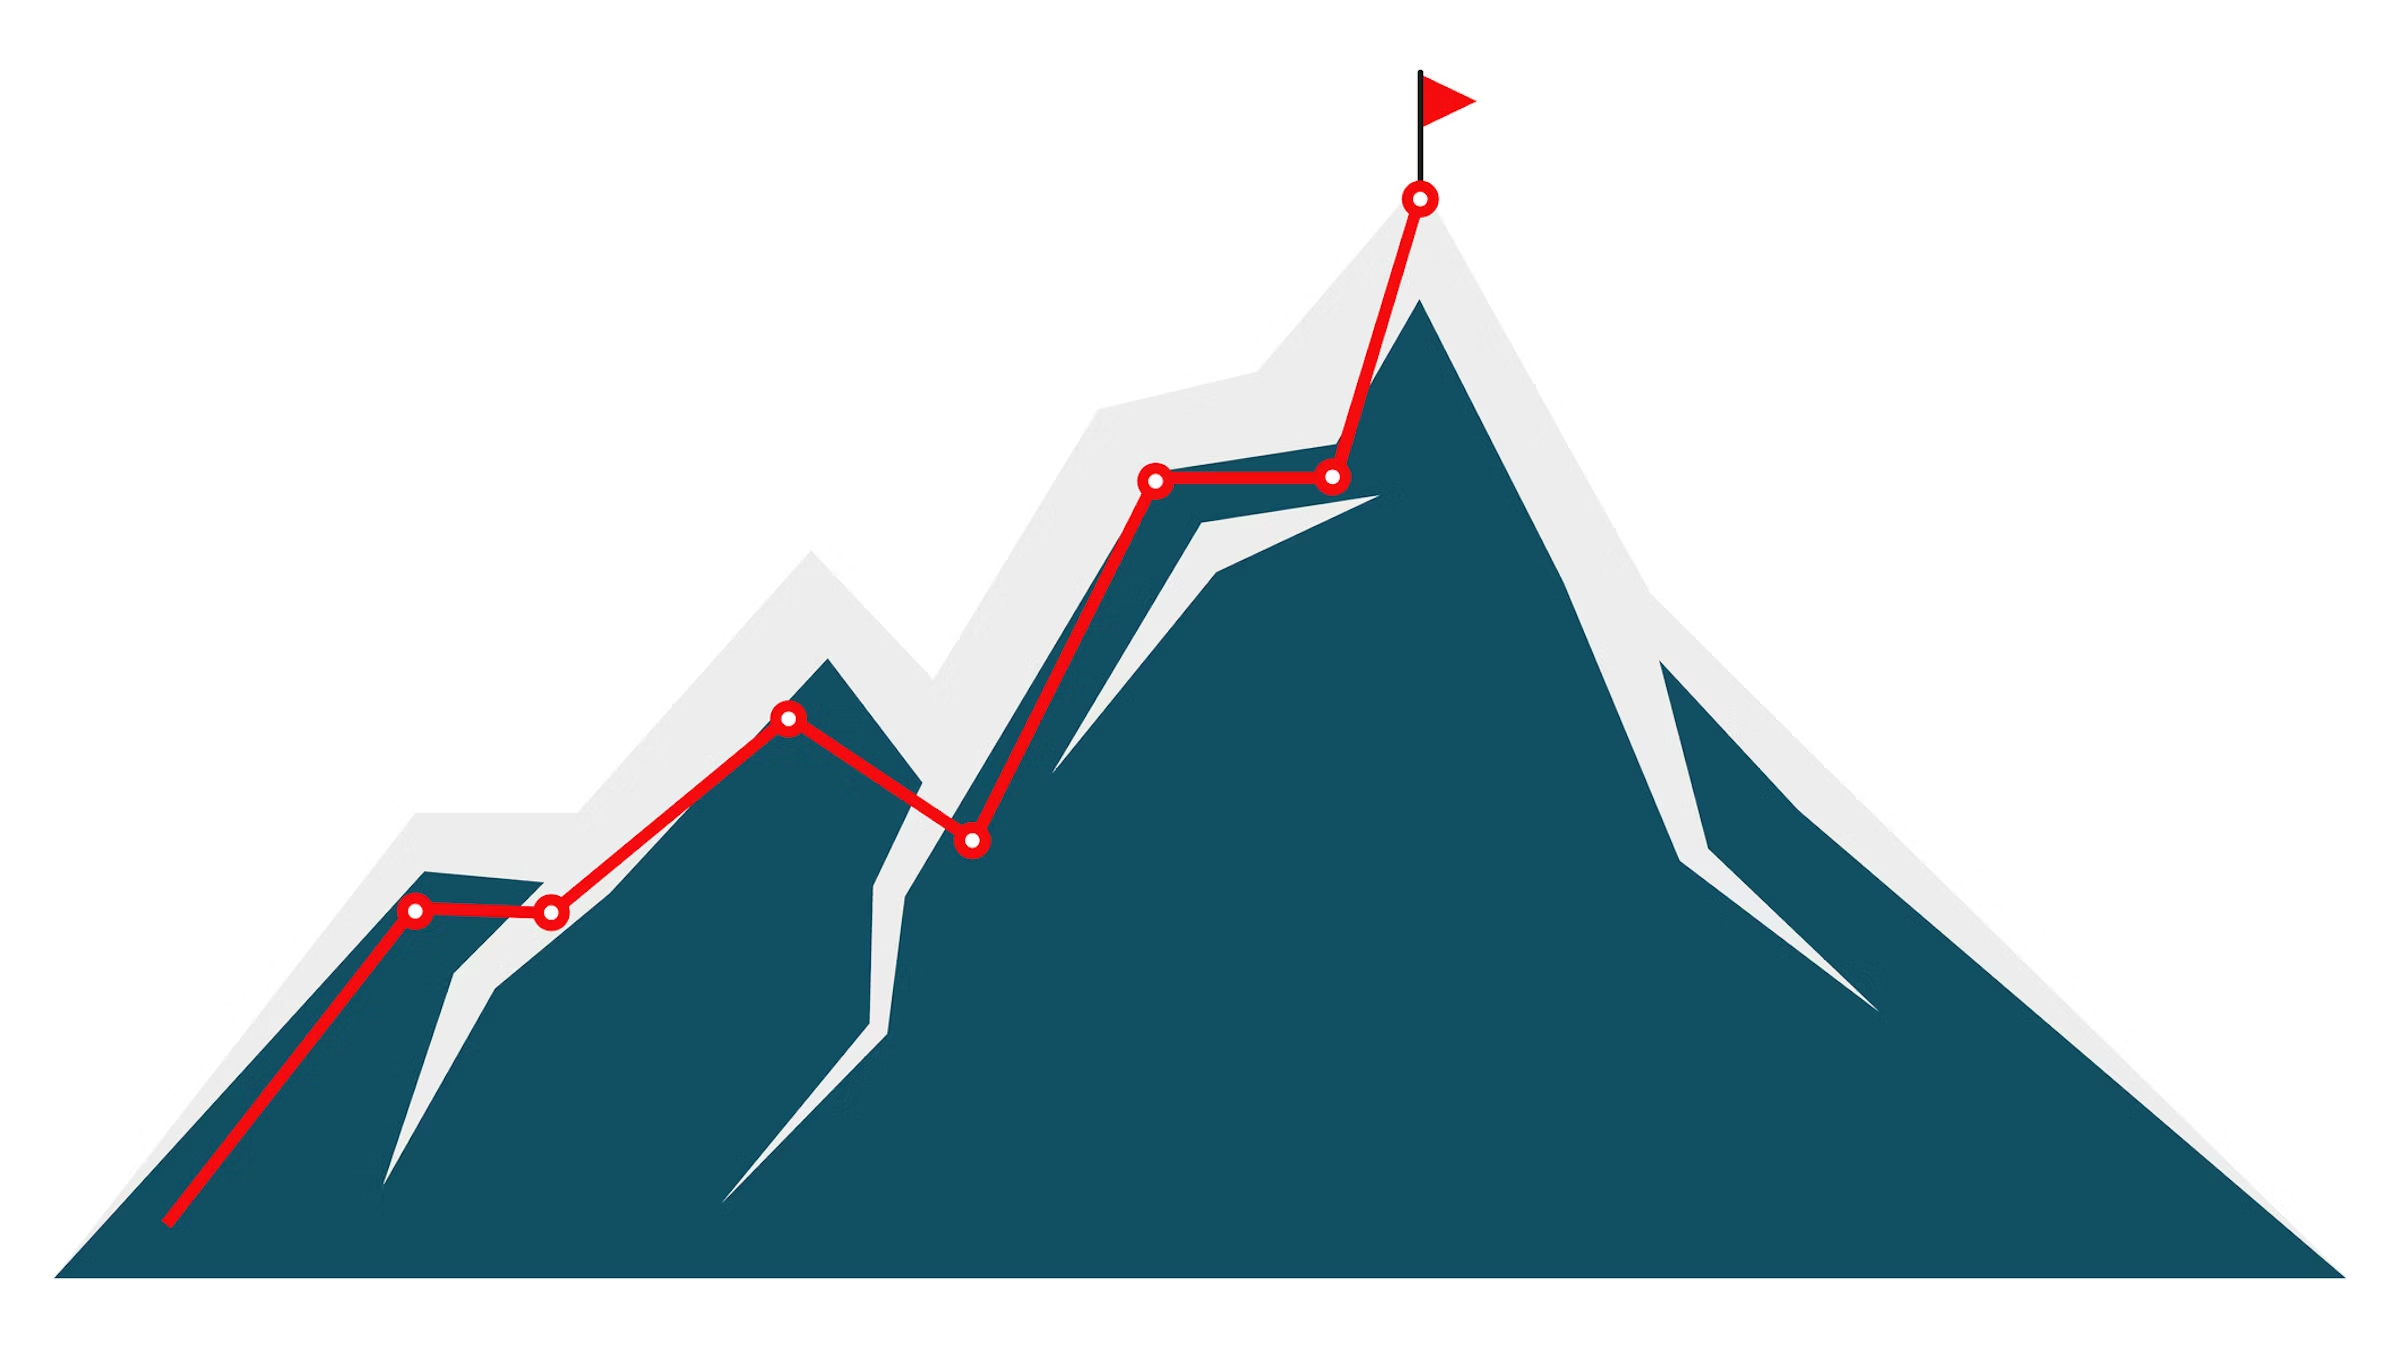
In 2020, we did an investigation into reliability practices, and we saw that some teams, as they began their journey changing some of their reliability practices, the reliability of their systems dropped. But over time, as they stayed committed and got more of their teams involved and more of the practices honed within their team, they saw this J curve illustrating impact across the team. So I think the important takeaway there is that this requires commitment. We're asking people to change process and technology. It's going to take some commitment.
Francesca: DORA metrics have had a huge impact in this space and are a popular starting point for taking a data-driven approach. What are your thoughts on how popular they’ve become?
Nathen: It's really exciting for me and for my team, and of course for the researchers, to see that it's had such a lasting and big and expanding impact on the industry. I think that it is important, though, to remember that the research is focused on that process of software delivery and operations. Oftentimes people ask about developer productivity or developer experience. This isn't particularly measuring that, although I would say that a developer is going to have a much better experience knowing that the code that they wrote is actually in the hands of users.
So it's not a direct measure there, it is an outcome of that process. When it comes to any sort of metric that we are looking at, it is important to remember which of these measures are inputs, which of these measures are outcomes. Even something like software delivery as an outcome is an input to organizational performance. It's really important just to understand the full context of the system, which of course includes the people in the system.
Francesca: If you're looking at DORA metrics in a tool like ours, there's also the context available so that you can have those conversations upward and people aren't going to be using that data in the ways that it wasn't intended.
Nathen: Absolutely. And with tools like Code Climate, you can go beyond those four keys. What are the inputs that are driving that? As an example, what is the quality of the code that's been written? Is it following the practices that we've set within our team? How long does a peer review of this code take? All of these things are really, really important and drive those overall metrics.
Francesca: We've seen that Deployment Frequency really is closely related to PR Size. So that's a great place to look first.
Nathen: Yeah, I think that one in particular is interesting because those four measures really, I think what the researchers really wanted to measure were batch sizes.
But how do we ask you, ‘What's the size of your batch?’ Smaller for you might be a medium for me. So those four metrics can really be used as a proxy to get at batch size and you're going to improve if you make that batch size smaller.
What is the size of our PRs? We can actually look across teams and say, ‘This team that has large PRs, lots and lots of code changes, they tend to go out slower.’ We could also start to look at things like from the time the change is committed, that lead time, what does it do for our Change Failure Rate? We've worked with customers who can pull out data and show us on a dashboard that the longer this change takes to get to production, the higher chance it's going to fail when it reaches production.
Francesca: Can you talk a little bit more about the importance of having metrics be standardized or making sure that Deploy Frequency, for example, means the same thing to everybody in the organization?
Nathen: I think it can be a real challenge, and I think that one of the values of DORA is that it gives us a shared language that we're communicating with one another. Deployment Frequency is a really interesting one. Of course, it's just how frequently you’re pushing changes out to your customers, but then there can be a lot of nuance.
The most important thing there is that you have consistency over time within a team. And then the second most important thing is across an organization as you're looking across teams, even if you can't get to a consistent definition, at least you can publish or write down and probably store in version control, how are we measuring this thing so that it's clearly communicated across those teams?
Francesca: So how do people connect something like Deployment Frequency and Lead Time to higher levels of work? For example, a story, a project, or business feature where you're really delivering that end-user value.
Nathen: DORA metrics are really focused on this idea of software delivery. We are looking only at code commit through to code deploy, but of course there's a lot of stuff that happens before we even get to code commit. Teams want to know things like feature velocity. How fast am I able to ship a feature? That's a different question than ‘How fast am I able to ship a change?’ because a feature is likely multiple changes that get rolled up together. This is where other metrics frameworks, like the flow metrics, might start to come in, where we look at a broader view of that entire value chain. And I think that it can be very difficult. Is a feature brand new thing that we're launching from fresh, or is a feature changing the location of this particular button? They're both features, they both have very different scales. One of the reasons that the DORA research really focuses on that software delivery process is it gives us a little bit more sort of continuity. A change, is a change, is a change, is a change. If we're shipping a change, it should follow the same process. There should be less variability in the size of that or in the duration of how frequent or how long that takes.
Francesca: A lot of the questions that we've been getting from the audience are more about digging deeper into the context of each of these metrics because they're very big picture outcomes. So let's take Mean Time to Recovery, for example. How do you suggest digging into this one?
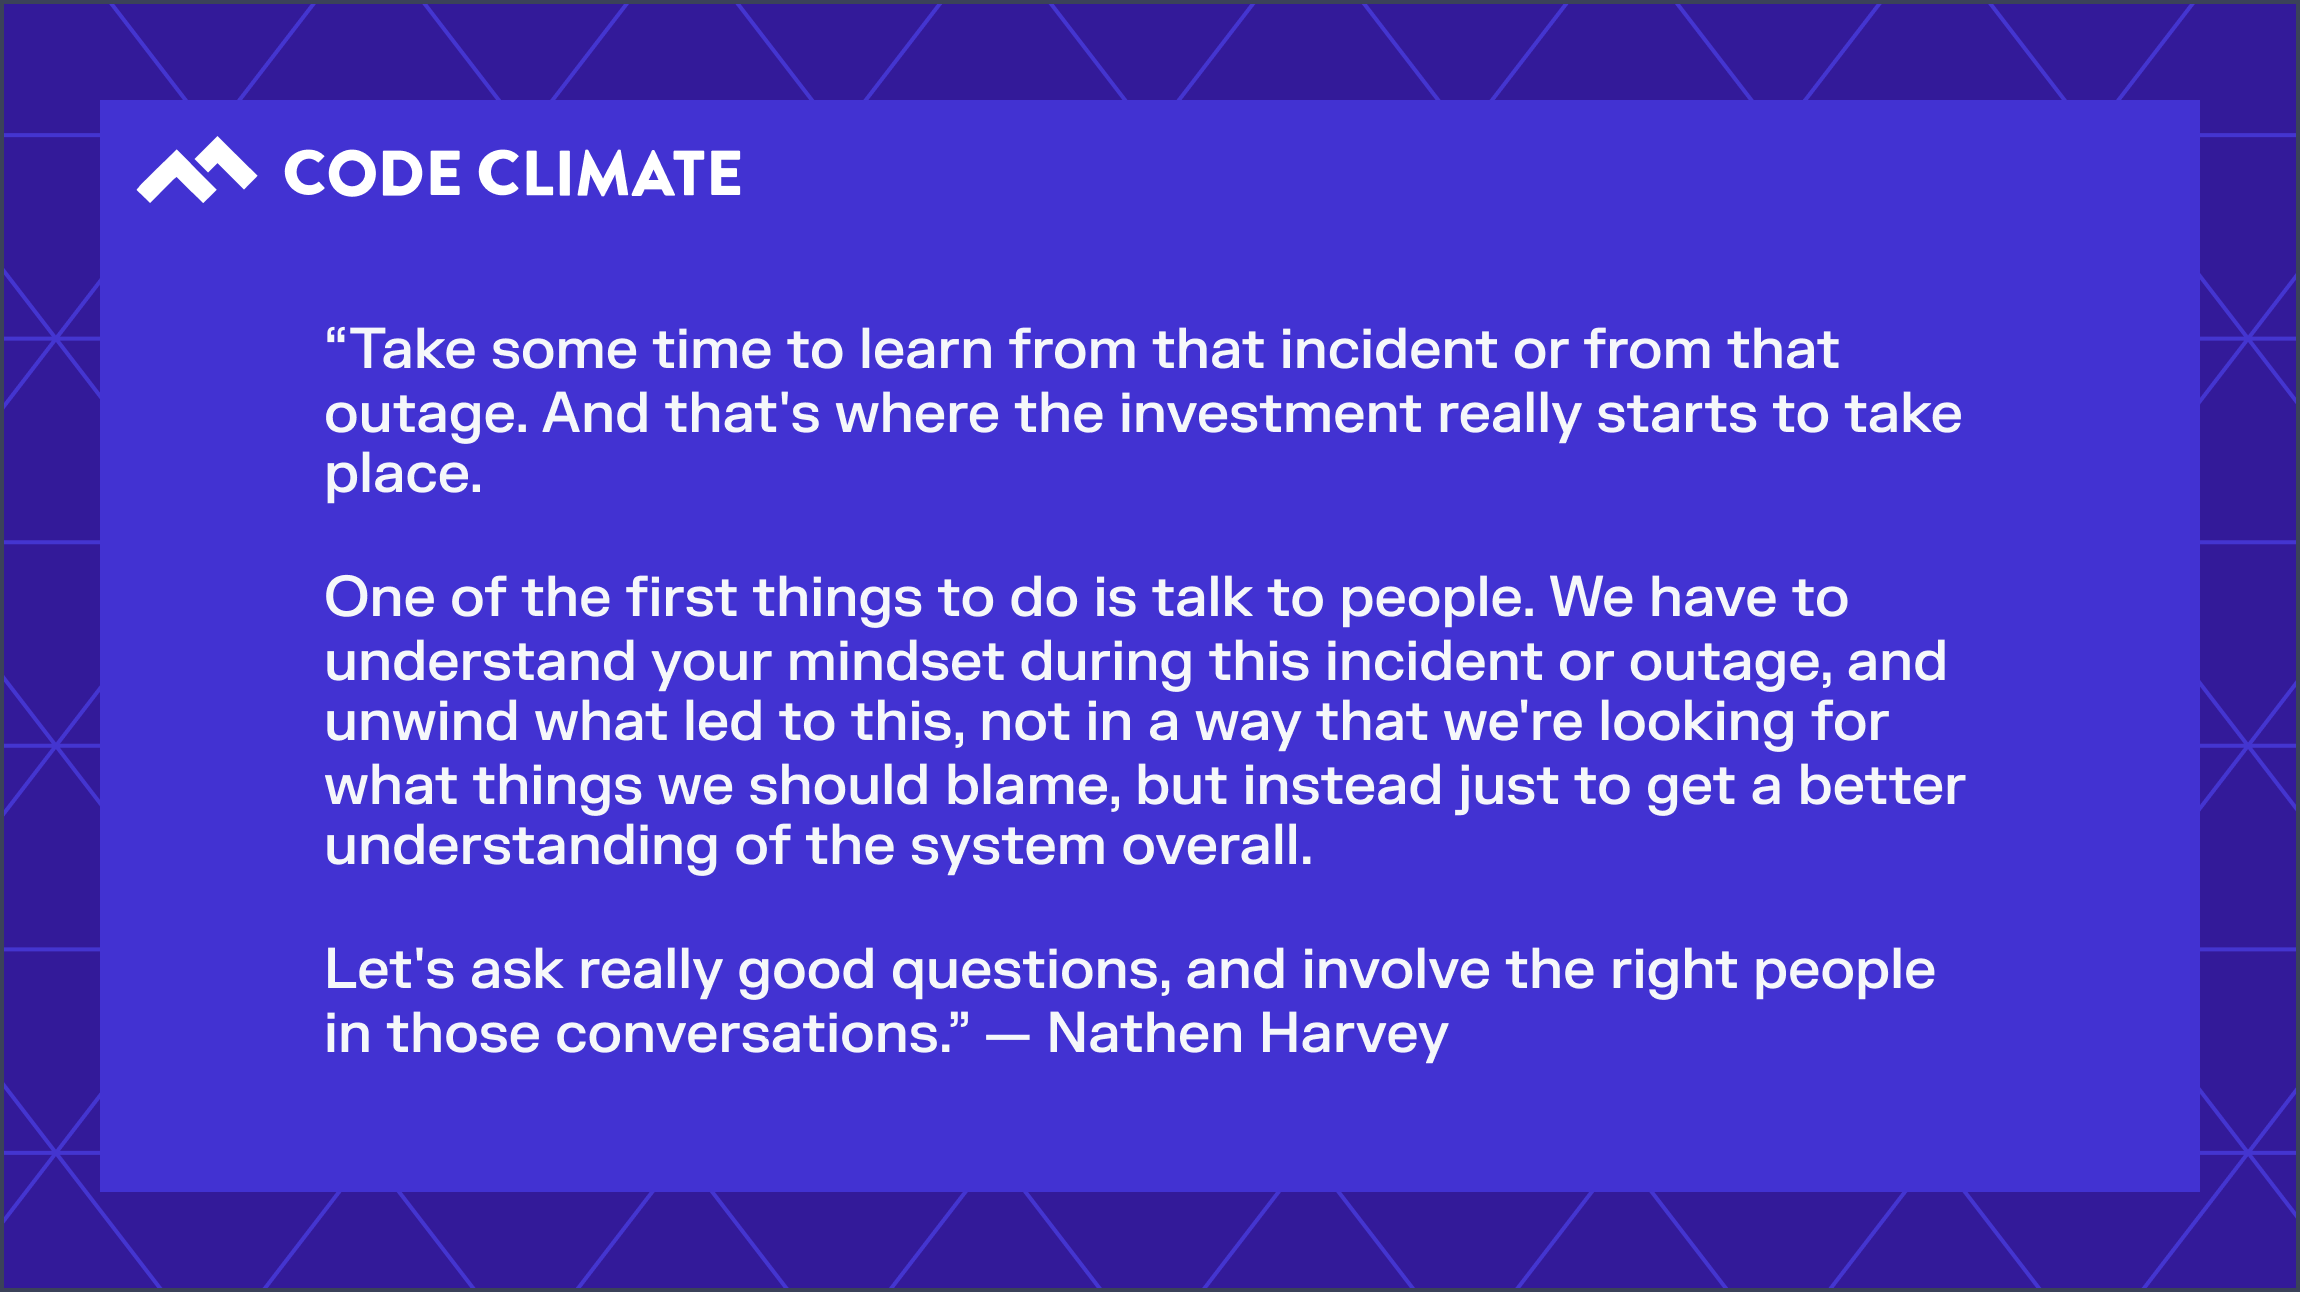
Nathen: I think the best thing to do is look at something that just happened. So let's say you just had an incident or an outage, something that you recovered from. First and foremost, make sure you're recovered, make sure your users are happy again. Now that we're there, let's take some time to learn from that incident or from that outage. And that's where the investment really starts to take place.
One of the first things we have to do is go talk to people. We have to understand your mindset during this incident or outage, and really try to unwind what led to this, not in a way that we're looking for what things we should blame, but instead just to get a better understanding of the system overall. Let's ask really good questions, and involve the right people in those conversations.
Francesca: Your research is in the abstract, but when you’re seeing DORA metrics practices in actuality, what were some surprises?
Nathen: What I so often see is a thing that you mentioned earlier: it really comes down to the process and the people. The people really matter.
The truth is that as we're trying to change culture and the way that teams and people show up at work, it is oftentimes the case that you have to change how they work to change how they think. Technology and culture are kind of stuck together. You can't just change out a tech and expect that the culture's going to change, nor can you just change the culture and expect that the technology's going to follow. These two amplify and reinforce one another. I think that we're reminded again and again and again that there is not a magic wand. There are no silver bullets. This takes consistent practice. It takes commitment and it takes looking at the entire system if you want to improve.
Francesca: If the need and desire for measuring DORA isn't coming from leadership, how do you suggest a team goes about implementing it?
Nathen: In my opinion, these measures matter for the teams that are building the software. And in fact, I don't mind if a leader isn't pushing me to measure DORA metrics. What I really want is for the team of engineers, the team of practitioners that come together to ship that software, to care about these metrics. Because at the end of the day, the other thing that we know is that these teams are more productive when they're able to hit those metrics. And a productive team is a happy team.
I often ask this question: is a happy team productive or is a productive team happy? I think the answer is yes, right? As an engineer, when I'm productive, when I'm able to be in the flow of my work and get fast feedback on the work that I'm doing, that makes me happier. I have better days at work. There's even research from GitHub that looks exactly at that. What does a good day look like? It's when that engineer, that developer is in the flow doing the work that they love to do, getting that fast feedback. So these metrics really matter for the team.
Francesca: It's what we see in how people use our tool as well, and that so often people or customers will come to us either wanting to fix some inefficiencies in their SDLC or wanting to improve team health, and they may be one and the same when you're really looking at the big picture.
Nathen: Absolutely. I don't know of any CEO who has come to a team and said, ‘Wow, you've deployed more frequently this year. Congratulations. Here's a big bonus.’ The CEO cares about the customer. These metrics can help reinforce that. As technologists, it's easy for us to get caught up in the latest, greatest new technology, this new microservices framework, this new stuff from AI. But at the end of the day, we're here to deliver value to our customers and really understand what they need out of this. That's what our CEO cares about. Frankly, that's what we should care about. We're using technology to further those goals and to keep our customers happy.
Francesca: In the polls, 26% of people said that they have philosophical or cultural barriers to implementing DORA. If leadership doesn't see it as a priority, how can managers still motivate the team?
Nathen: I think that one approach that is successful is to — and this pains me a little bit — stop using the word DORA. Stop using the word DevOps. Don't talk about those things, don't talk about those labels. Turn to a more curious mindset and a questioning mindset. What would it be like for our customers, for our organization, for our team, if we were able to deliver software faster? Imagine that world because we can do that. We can get there and do that in a safe way. Imagine or ask the question, ‘What happens if we don't improve? What happens if we stay stagnant and our practices aren't improving?’ And really start at digging into some of those questions to find that intrinsic motivation that we have. As an engineer, like I said, I want to ship more things. I want to get feedback from that faster. I want to do the right thing for my customers.
Francesca: What is the future of DORA? Are there additional metrics you think of exploring or avenues outside of stability, outside of speed, that you think are important to include in the future?
Nathen: Yeah, absolutely. I think this is really where we get back to those capabilities. Number one, we will continue this research and continue our ongoing commitment to that research being program and platform-agnostic, really trying to help teams understand what capabilities are required to drive those metrics forward. Number two, like you mentioned earlier, we're seeing more and more teams that are trying to use the DORA framework and the metrics and the research to drive those improvements. In fact, we've recently launched dora.dev as a place where the community can start to come together and learn from one another and collaborate with one another and answer these questions.
Don't ask Nathen, let's ask each other. Let's learn from each other and the lived experiences of everyone here. And then, of course, I mentioned that the research will continue. So stay tuned. In the next couple of months, we'll launch the 2023 state of DevOps survey. And the best thing about the survey is the questions that it asks. And I think that teams can really get a lot of value by carefully considering the questions that are posed in the survey. Just by looking at those questions, a team is going to start to identify places where they could make investments and improvements right now.
Francesca: Something that is going to stick with me from what you've said today is that the benchmarks that are standardized may not be what we should all be spending so much time on. It's really about how we compare to ourselves and where we can improve.
Nathen: It is that practice and mindset of continuous improvement. Now, look, the benchmarks are still important because we have to have dashboards, we have to have ways to report, we have to have ways to test that what we're doing is making things different. Whether that's good, better, or worse, at least these benchmarks give us a way to test that and prove out the theories that we have.
To learn how your engineering team can implement DORA metrics to drive improvement, request a consultation.

Delivering software is a complex and often fragmented process, requiring countless dependencies, tools, and teams. A value stream management (VSM) solution aims to bring order to that chaos, mapping the process of delivery from idea to market.
Engineering leaders who oversee product roadmaps, operations, and the development of applications, can benefit from investing in value stream management.
What is value stream management?
Value stream management is the practice of tracking the efficiency, cost, and speed of an organization’s software delivery. As organizations focus on delivering even more value to customers, many are adopting value stream management tools to fully optimize their processes from end to end.
Value stream management provides layers of visibility into the DevOps pipeline and helps improve the flow of software delivery to ensure that maximum value is being delivered to customers.
What is a value stream management platform?
Value stream management platforms (VSMPs) are tools that assist software organizations in managing their DevOps processes. These platforms pull data from your existing tools and create visualizations so that software engineering leaders can gather sophisticated insights about their organization’s software delivery processes.
VSMPs surface engineering metrics and analytics related to the delivery processes, such as allocation of resources, progress towards key goals, and granular insight into software development lifecycle (SDLC) stages, to help engineering leaders spot potential bottlenecks or issues.
What does a value stream management platform do?
Companies can use VSMPs to understand their progress towards delivery commitments, the overall efficiency of their engineering processes, and the impact of their allocation of time and resources.
VSMPs help engineering leaders and teams align engineering activities with business objectives, ultimately helping to strengthen business outcomes.
How do value stream management platforms work?
VSMPs connect to other software development tools to surface software delivery data all in one place, allowing engineering leaders to identify where their teams can improve processes.
Value stream management can help leaders answer specific questions about their processes and delivery, such as:
- Are they spending the right amount of time and resources on specific products and features? VSMPs can illustrate where developers or teams are spending their time, giving leaders detailed visibility into how resources are distributed, and allowing them to investigate whether processes need to be altered, improved, or even scaled and applied across the organization.
- Are engineering and business OKRs aligned? Engineering metrics and business metrics should be complementary, but if they are siloed, it can be difficult to see how they affect one another. If organizations use a VSMP, it’s easier to visualize business and engineering alignment by surfacing software delivery alongside product roadmaps, for example.
- Are teams meeting their delivery goals? By setting targets within a VSMP, engineering teams can better track progress towards meeting delivery deadlines.
- Are their processes efficient? With a comprehensive tool that offers insight into every part of the SDLC, engineering leaders can drill down into units of work and understand how long certain processes, like code review or deploys, are taking, and make adjustments if necessary.
- Are their opportunities to automate best practices? Rules for automation can be built into the value stream to free up engineering resources. Automation of specific tasks can minimize risk, enforce quality, and speed up software delivery.
- Is process data being captured and normalized? VSMPs integrate with existing SDLC tools in order to capture DORA metrics, flow metrics, and lean metrics like process and wait time. With actual process data, teams can optimize processes and increase the rate of innovation.
- Are customers satisfied with the product? VSMPs can help leaders foster a culture of continuous delivery, so that new features or updates can be delivered to customers more quickly, allowing organizations to get feedback on their products more often.
What are value stream metrics?
Value stream metrics incorporate data for an organization’s entire software development life cycle (SDLC) process. They include:
Business metrics: These track performance and customer satisfaction, and can include ROI, indicators of product value, and product quality.
Product delivery metrics: These measure indicators of product development and can include productivity metrics like DORA metrics and efficiency and flow metrics.
Technical metrics: These metrics assess your code quality, delivery speed, refactoring, and technical debt.
Reliability metrics: These help measure the digital experience of your customers, and can include service-level objectives (SLOs) and Mean Time to Recovery from incidents.
Code Climate adds value to the value stream
A Software Engineering Intelligence (SEI) platform like Code Climate offers solutions that overlap with the capabilities of a value stream management platform. SEI platforms offer end-to-end insight into the SDLC by allowing engineering teams to track and improve efficiency, resource allocation, and speed of software delivery. Additionally, like value stream management platforms, SEI platforms can help leaders communicate the business impact of engineering to non-technical stakeholders.
As an SEI platform and solution, Code Climate offers additional insights outside the bounds of value stream management. Code Climate gives leaders a more holistic view of the software delivery process, including team health and performance. We encourage engineering leaders to look not only at the SDLC, but to also focus on the teams that make it run. Spending time on identifying factors that could affect engineers’ experience is critical to business success.
To learn more about the actionable insights provided by Code Climate, request a consultation.

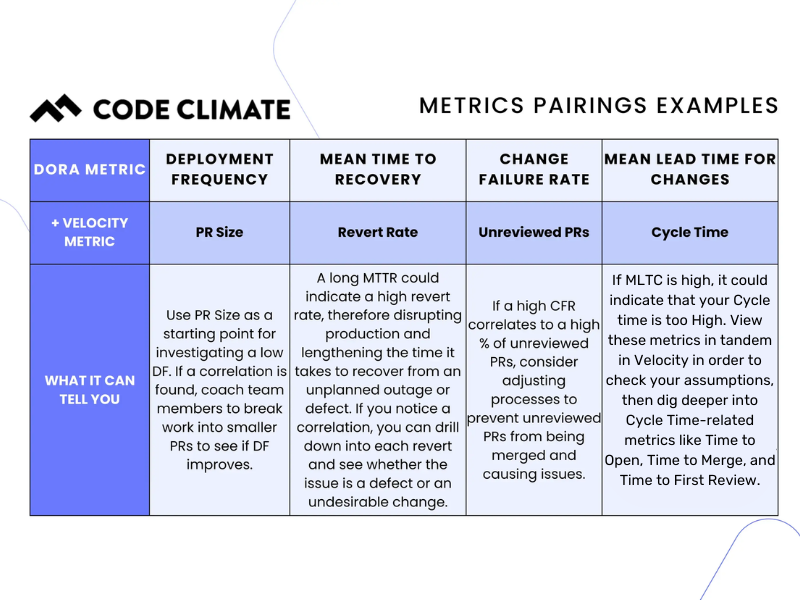
The four DORA Metrics — Deployment Frequency, Change Failure Rate, Mean Time to Recovery, and Mean Lead Time for Changes — were identified by the DevOps Research and Assessment group as the metrics most strongly correlated to a software organization’s performance.
These metrics are a critical starting point for engineering leaders looking to improve or scale DevOps processes in their organizations. DORA metrics measure incidents and deployments, which can help you balance speed and stability. When viewed in isolation, however, they only tell part of the story about your engineering practices.
To begin to identify how to make the highest-impact adjustments, we recommend viewing these DORA metrics in tandem with their non-DORA counterparts, which can be done through Velocity’s Analytics module. These close correlations will help are a great starting point if you're looking for opportunities to make improvements, or might highlight teams that are doing well and might have best practices that could scale across the organization.
While there is no one-size-fits-all solution to optimizing your DevOps processes, certain pairings of metrics are logical places to start.
DORA Metric: Change Failure Rate
Velocity Metric: Unreviewed Pull Requests
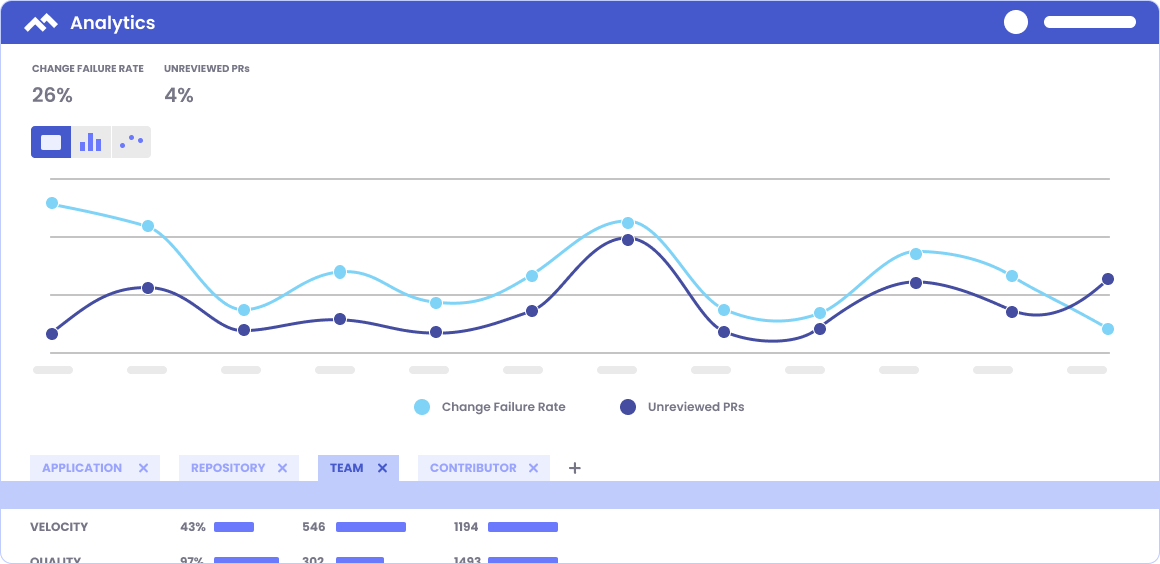
Change Failure Rate is the percentage of deployments causing a failure in production, while Unreviewed Pull Requests (PRs) refers to the percentage of PRs merged without review (either comments or approval).
How can you identify the possible causes of high rates of failures in production? One area to investigate is Unreviewed PRs. Code review is the last line of defense to prevent mistakes from making it into production. When PRs are merged without comments or approval, you’re at a higher risk of introducing errors into the codebase.
In Velocity’s Analytics module, choose Unreviewed PRs and Change Failure Rate to see the relationship between the two metrics. If you notice a high Change Failure Rate correlates to a high percentage of Unreviewed PRs, you have a basis for adjusting processes to prevent Unreviewed PRs from being merged.
Engineering leaders may start by coaching teams to improve on the importance of code review so that they make it a priority, and if necessary, setting up a process that assigns reviews or otherwise makes it more automatic. If you’re using Velocity, you can note the date of this change right in Velocity in order to observe its impact over time. You can take this data to your team to celebrate successes and motivate further improvements.
For reference, according to the State of DevOps report for 2022, high-performing teams typically maintain a CFR between 0-15%.
DORA Metric: Deployment Frequency
Velocity Metric: PR Size
Deployment Frequency measures how frequently the engineering team is successfully deploying code to production, and PR Size is the number of lines of code added, changed, or removed.
Our research shows that smaller PRs pass more quickly through the development pipeline, which means that teams with smaller PRs are likely to deploy more frequently. If you’re looking to increase Deployment Frequency, PR size is a good place to start your investigation.
If you view these two metrics in tandem and notice a correlation, i.e. that a larger PR Size correlates to a lower Deployment Frequency, encourage your team to break units of work into smaller chunks.
While this may not be the definitive solution for improving Deployment Frequency in all situations, it is the first place you might want to look. It’s important to note this change and observe its impact over time. If Deployment Frequency is still trending low, you can look at other metrics to see what is causing a slowdown. Within Velocity’s Analytics module, you also have the ability to drill down into each deploy to investigate further.
DORA Metric: Mean Time to Recovery
Velocity Metric(s): Revert Rate or Defect Rate
Mean Time to Recovery (also referred to as Time to Restore Service) measures how long it takes an engineering team to restore service by recovering from an incident or defect that impacts customers.
Debugging could account for a significant amount of the engineering team’s time. Figuring out specifically which areas in the codebase take the longest time to recover could help improve your MTTR.
In Analytics, you can view MTTR and Revert Rate or Defect Rate by Application or Team. Revert Rate is the total percentage of PRs that are “reverts”— changes that made it through the software development process before being reversed — which can be disruptive to production. These reverts could represent defects or wasted efforts (undesirable changes). Defect Rate represents the percentage of merged pull requests that are addressing defects.
By viewing these metrics side by side in the module, you can see which parts of the codebase have the most defects or reverts, and if those correlate to long MTTRs (low-performing teams experience an MTTR of between one week and one month).
If you notice a correlation, you can drill down into each revert, speak to the team, and see whether the issue is a defect or an undesirable change. To prevent defects in the future, consider implementing automated testing and/or code review. To prevent wasted efforts, the solution may lie further upstream. This can be improved by focusing on communication and planning from the top down.
DORA Metric: Mean Lead Time for Changes
Velocity Metric: Cycle Time
Mean Lead Time for Changes is the time it takes from when code is committed to when that code is successfully running in production, while Cycle Time is the time between a commit being authored to a PR being merged. Both are speed metrics, and can offer insight into the efficiency of your engineering processes.
Low performing teams have an MLTC between one and six months, while high-performing teams can go from code committed, to code running in production in between one day and one week.
If your team is on the lower-performing scale for MLTC, it could indicate that your Cycle Time is too high or that you have issues in QA and testing. View these metrics in tandem in Velocity in order to check your assumptions. If your Cycle Time is high, you can dig deeper into that metric by investigating corresponding metrics, like Time to Open, Time to Merge, and Time to First Review.
Conversely, if your Cycle Time is satisfactory, the problem could lie with deployments. You should investigate whether there are bottlenecks in the QA process, or with your Deploy Frequency. If your organization only deploys every few weeks, for example, your team’s PRs could be merged but are not being deployed for a long time.
The power of DORA metrics in Analytics
DORA metrics are outcome-based metrics which help engineering teams identify areas for improvement, yet no single metric can tell the whole story of a team’s performance. It’s important to view DORA metrics with engineering metrics to gain actionable insights about your DevOps processes.
To learn more about using DORA metrics in Velocity, talk to a product specialist.
Today, businesses across all industries are powered by software. In order to remain relevant and competitive in their fields, companies need to ensure their engineering organizations are the best they can be. Customers and clients expect a positive, painless experience when interacting with a service or product, putting pressure on engineering teams and leadership to deliver value more efficiently and frequently than ever before.
There is no replacement for the expertise of an engineering leader or the talent of experienced software developers. Yet to maximize the impact of leaders and teams, data-driven insights are imperative. A Software Engineering Intelligence (SEI) platform, sometimes known as an Engineering Management Platform (EMP), can provide these insights, helping engineering leaders align with business goals, communicate the impact of engineering on the business, focus on the areas of the organization that need the most attention, and make informed operational decisions.
What is a Software Engineering Intelligence platform?
A Software Engineering Intelligence platform is a comprehensive tool that helps leaders and teams deliver quality software efficiently by providing data-driven visibility into the engineering team’s health, investment of resources, operational efficiency, and progress towards key goals.
While engineering decisions have historically been reliant on gut feel or highly manual solutions, like error-prone spreadsheets, SEI platforms enable engineering leaders to make data-informed decisions that will drive positive business outcomes, and foster consistent collaboration between teams throughout the CI/CD process.
What does a Software Engineering Intelligence platform do?
SEI platforms enable engineering leaders to:
- Gain critical visibility into the SDLC to unblock work and deliver quality tech more predictably. Software Engineering Intelligence platforms help organizations identify and remove bottlenecks, leading to more predictable software delivery and increased value for customers. Getting a true understanding of in-flight work, including your coding balance and work in progress PRs, can help you ensure continuous delivery. An SEI platform also provides real-time alerts when work is not progressing as expected.
- Improve team health. An SEI platform helps illustrate how work is distributed among developers to help leaders prevent burnout, identify opportunities for collaboration, and have specific, actionable coaching conversations based on the work itself rather than the individual.
In terms of team health and developer retention, SEI platforms can help leaders spot opportunities for developer and team growth, and make it easier to identify and celebrate team successes. They can also provide benchmarks for team performance compared with others in the industry or within the organization. - Communicate engineering value to your business. To advocate for their team and maintain alignment with the rest of the business, engineering managers and leaders need to translate engineering investments and features into business value. An SEI platform makes it easier to demonstrate impact by illuminating progress towards key goals and illustrating the ROI of the engineering organization.
- Simplify manual and incomplete data collection processes. An SEI platform connects with the VCS and project management tools that teams are already using in order to collect and share data.
- Allocate resources to maximize impact. SEI platforms can inform leaders of actual cost and capacity allocation across engineering work so that they can assign resources to maximize business impact.
How does an SEI platform use data to offer actionable insights?
The best SEI platforms synthesize data from tools that engineering teams are already using daily. This can alleviate the burden of manually bringing together data from a variety of platforms and homegrown solutions.
SEI platforms do this by integrating with tools like Version Control Systems, Project Management platforms, and communication tools like Slack.
Through data integrations and automations, an SEI platform:
- Cleans and analyzes data. An SEI platform allows users to automatically ingest, clean, and link data. With an SEI platform, you can exclude data either manually or by rule so that insights aren’t skewed by outliers or irrelevant information
- Understand and improve quality of work. Specific metrics found in an SEI platform allow users to understand the quality of their team's work. By examining aspects of the software delivery lifecycle (SDLC) like how much code is refactored versus how much is new, as how many PRs are unreviewed or inactive, leaders can evaluate whether code review best practices are being followed and if stability and efficiency of delivery are balanced.
- Creates visualizations of trends, patterns, and correlations. SEI platforms allow engineering leaders to surface data all in one place. Some SEI platforms, show users up to one year of historical data so you can identify past and current trends.
- Offers opportunities to add necessary context to your data. SEI Platforms allow users to note when an organizational change has been made, so you can observe how those changes impact software delivery.
Additional support
More than just a repository tool, the benefits of using an SEI platform include customer support and documentation to help with introducing metrics to the team, and how to support a culture of psychological safety and continuous delivery. Additionally, Code Climate offers expert guidance and advisory services to turn insights into customized action plans.
Data that engineering leaders can get from an SEI platform can be tailored specifically to the organization, including insights at scale, and reports that address your top concerns as an organization.
Are SEI platforms secure?
The security of your team’s data is critical — the best SEI platforms will not store sensitive data, and will allow you to determine who within your organization can access what information.
Enterprise-ready SEI platforms, like what Code Climate offers, are SOC 2 Type 2 compliant, as verified by a third party, meaning they’ve ensured the security, availability, and processing integrity of users’ data.
Why do you need a Software Engineering Intelligence platform now?
In the past, engineering measurements have been largely subjective and nebulous, but the pressures of the software industry require an analytical solution to measure engineering outcomes.
Nearly every department in an organization utilizes some form of measurement and documentation to track the efficacy of their processes. In finance, spending and revenue are closely examined; in marketing, web traffic and conversions are assessed regularly.
Engineering leaders have never before had comprehensive tools to measure objective engineering metrics all in one place, giving them necessary data to improve practices. Concrete data from an SEI platform makes it easier to identify bottlenecks, demonstrate ROI to stakeholders, and establish and reach goals within an engineering team.
This is especially important as many software organizations are up against delivery, budget, and personnel challenges.
The challenges, in numbers:
- According to the Standish Group’s 2020 CHAOS report, which reports on outcomes for their database of 50,000 projects, only 35% of those software projects were fully successful (delivered on time and within the allocated budget).
- In the US, firms spend more than $260 billion on unsuccessful software projects, according to a report by the Consortium for Information & Software Quality (CISQ).
- An extensive study by Korn Ferry estimates that a global skills shortage will result in $8.5 trillion in unrealized annual revenues in 2030.
How do you address engineering challenges?
To remain competitive in the fast-paced software industry, organizations will want to optimize their engineering practices. Demonstrating the impact of an engineering team on the business is critical in a time when resources are scarce.
The only way to fully understand your engineering processes, team health, and the stability and innovation of your product is by investing in a Software Engineering Intelligence platform.
Interested in learning what an Software Engineering Intelligence platform can and should offer? Speak with a Code Climate expert.
The four DORA Metrics — Deployment Frequency, Change Failure Rate, Mean Time to Recovery, and Mean Lead Time for Changes — were identified by the DevOps Research and Assessment group as the metrics most strongly correlated to a software organization’s performance.
These metrics are a critical starting point for engineering leaders looking to improve or scale DevOps processes in their organizations. DORA metrics measure incidents and deployments, which can help you balance speed and stability. When viewed in isolation, however, they only tell part of the story about your engineering practices.
To begin to identify how to make the highest-impact adjustments, we recommend viewing these DORA metrics in tandem with their non-DORA counterparts, which can be done through Velocity’s Analytics module. These close correlations will help are a great starting point if you're looking for opportunities to make improvements, or might highlight teams that are doing well and might have best practices that could scale across the organization.
While there is no one-size-fits-all solution to optimizing your DevOps processes, certain pairings of metrics are logical places to start.
DORA Metric: Change Failure Rate
Velocity Metric: Unreviewed Pull Requests
Change Failure Rate is the percentage of deployments causing a failure in production, while Unreviewed Pull Requests (PRs) refers to the percentage of PRs merged without review (either comments or approval).
How can you identify the possible causes of high rates of failures in production? One area to investigate is Unreviewed PRs. Code review is the last line of defense to prevent mistakes from making it into production. When PRs are merged without comments or approval, you’re at a higher risk of introducing errors into the codebase.
In Velocity’s Analytics module, choose Unreviewed PRs and Change Failure Rate to see the relationship between the two metrics. If you notice a high Change Failure Rate correlates to a high percentage of Unreviewed PRs, you have a basis for adjusting processes to prevent Unreviewed PRs from being merged.
Engineering leaders may start by coaching teams to improve on the importance of code review so that they make it a priority, and if necessary, setting up a process that assigns reviews or otherwise makes it more automatic. If you’re using Velocity, you can note the date of this change right in Velocity in order to observe its impact over time. You can take this data to your team to celebrate successes and motivate further improvements.
For reference, according to the State of DevOps report for 2022, high-performing teams typically maintain a CFR between 0-15%.
DORA Metric: Deployment Frequency
Velocity Metric: PR Size
Deployment Frequency measures how frequently the engineering team is successfully deploying code to production, and PR Size is the number of lines of code added, changed, or removed.
Our research shows that smaller PRs pass more quickly through the development pipeline, which means that teams with smaller PRs are likely to deploy more frequently. If you’re looking to increase Deployment Frequency, PR size is a good place to start your investigation.
If you view these two metrics in tandem and notice a correlation, i.e. that a larger PR Size correlates to a lower Deployment Frequency, encourage your team to break units of work into smaller chunks.
While this may not be the definitive solution for improving Deployment Frequency in all situations, it is the first place you might want to look. It’s important to note this change and observe its impact over time. If Deployment Frequency is still trending low, you can look at other metrics to see what is causing a slowdown. Within Velocity’s Analytics module, you also have the ability to drill down into each deploy to investigate further.
DORA Metric: Mean Time to Recovery
Velocity Metric(s): Revert Rate or Defect Rate
Mean Time to Recovery (also referred to as Time to Restore Service) measures how long it takes an engineering team to restore service by recovering from an incident or defect that impacts customers.
Debugging could account for a significant amount of the engineering team’s time. Figuring out specifically which areas in the codebase take the longest time to recover could help improve your MTTR.
In Analytics, you can view MTTR and Revert Rate or Defect Rate by Application or Team. Revert Rate is the total percentage of PRs that are “reverts”— changes that made it through the software development process before being reversed — which can be disruptive to production. These reverts could represent defects or wasted efforts (undesirable changes). Defect Rate represents the percentage of merged pull requests that are addressing defects.
By viewing these metrics side by side in the module, you can see which parts of the codebase have the most defects or reverts, and if those correlate to long MTTRs (low-performing teams experience an MTTR of between one week and one month).
If you notice a correlation, you can drill down into each revert, speak to the team, and see whether the issue is a defect or an undesirable change. To prevent defects in the future, consider implementing automated testing and/or code review. To prevent wasted efforts, the solution may lie further upstream. This can be improved by focusing on communication and planning from the top down.
DORA Metric: Mean Lead Time for Changes
Velocity Metric: Cycle Time
Mean Lead Time for Changes is the time it takes from when code is committed to when that code is successfully running in production, while Cycle Time is the time between a commit being authored to a PR being merged. Both are speed metrics, and can offer insight into the efficiency of your engineering processes.
Low performing teams have an MLTC between one and six months, while high-performing teams can go from code committed, to code running in production in between one day and one week.
If your team is on the lower-performing scale for MLTC, it could indicate that your Cycle Time is too high or that you have issues in QA and testing. View these metrics in tandem in Velocity in order to check your assumptions. If your Cycle Time is high, you can dig deeper into that metric by investigating corresponding metrics, like Time to Open, Time to Merge, and Time to First Review.
Conversely, if your Cycle Time is satisfactory, the problem could lie with deployments. You should investigate whether there are bottlenecks in the QA process, or with your Deploy Frequency. If your organization only deploys every few weeks, for example, your team’s PRs could be merged but are not being deployed for a long time.
The power of DORA metrics in Analytics
DORA metrics are outcome-based metrics which help engineering teams identify areas for improvement, yet no single metric can tell the whole story of a team’s performance. It’s important to view DORA metrics with engineering metrics to gain actionable insights about your DevOps processes.
To learn more about using DORA metrics in Velocity, talk to a product specialist.