
Hillary Nussbaum

EverQuote prides itself on having a data-driven culture. But even with this organization-wide commitment, its engineering team initially struggled to embrace metrics that would help them understand and improve performance. Many leaders would give up after a failed attempt, but Virginia Toombs, VP of Engineering Operations, took a step back to understand what went wrong so they could try again — and succeed.
Along the way, the EverQuote team learned what to avoid when implementing engineering metrics and how to successfully roll them out. For them, it was all about empowering team members, collecting actionable data in the right platform, and correlating metrics for a more holistic view of what was happening across the organization.
Lessons Learned About Measuring Engineering Productivity
When EverQuote decided to measure engineering productivity a few years ago, it started by purchasing a tool, like many organizations commonly do. But it encountered problems as it hadn’t considered what to measure or how to leverage those insights to improve performance. Because EverQuote didn’t know which engineering metrics best suited its unique team and processes, it ended up with a tool that didn’t have mature throughput or flow metrics — two things it would learn were core to its success. The result? Virginia and her team saw detailed engineering metrics but lacked a comprehensive view of the organization’s performance.
This issue caused a domino effect. Measuring only granular metrics made team members feel that individual performance was being judged, rather than the process itself, and enthusiasm for the program came to a halt. That’s when the engineering operations team decided to rethink the approach and start from scratch.
Using Metrics to Improve Developer Experience
EverQuote’s engineering operations team is a central function within engineering whose main goal is to create an environment where engineers can thrive. This team optimizes processes, encourages collaboration, and coaches on agile techniques. For them, it’s essential to understand how engineering processes are performing so they can make data-driven decisions to improve. This team made two important decisions when rolling out engineering metrics for the second time.
First, they took the time to understand which engineering metrics applied to their organization. Rather than starting with granular metrics, they decided to lead with the big picture, adopting the four original DORA metrics: Deployment Frequency (DF), Mean Lead Time for Changes (MLTC), Mean Time to Recover (MTTR), and Change Failure Rate (CFR). From these high-level metrics, they would still be able to identify bottlenecks or issues and drill down into more granular metrics as needed.
To support DORA, and to provide visibility into its corresponding metrics, EverQuote adopted Code Climate. With Code Climate's Software Engineering Intelligence platform, they could identify organizational trends, look at data by teams or applications, and dig into specific DORA metrics. For example, if they see that MLTC is high, they can click into it to see exactly where the holdup is — maybe a long Time to Open or Time to First Review is preventing the PRs from getting to production as expected. Starting at a high level helps them understand their systems holistically, and then they can drill down as needed, which is more efficient and saves team members from metric fatigue.
Second, they empowered teams to own their metrics by educating them in how to read and interpret the data, and creating processes to discuss performance at the end of a sprint. They held these conversations as a team, not during one-on-ones, and focused on how they could better collaborate to improve as a unit. This strategy exemplifies one of EverQuote’s core principles: If you work as a team, you succeed as a team.
Successfully Implementing DORA DevOps Metrics
The EverQuote journey to measurement has come full circle. Now, engineers embrace engineering metrics as a tool for continuous improvement. After two iterations of implementing metrics, the team has learned three major lessons for successful adoption:
- Collect data you plan to act on. Although measuring and tracking every possible engineering metric may be tempting, it can prevent you from seeing the forest for the trees. Instead, be intentional about the metrics that your organization can derive insights from to take action.
- Correlate metrics and drill down as needed. Measuring DORA metrics gives EverQuote a full view of how engineering systems work at any given time. Being able to double-click into them in Code Climate's platform lets them quickly identify and resolve the root cause of an issue when it arises.
- Use consistent data. EverQuote has 17 engineering teams spread across multiple functions and locations. To maintain consistency, they align on how metrics will be defined and calculated. This process is essential to ensure they speak the same language and can benchmark against other teams and the industry.
Combining DORA DevOps metrics with other engineering metrics in Code Climate's insights platform has helped EverQuote nurture its data-driven culture. To learn more about successfully rolling out engineering metrics within your organization, request a consultation.

Engineering productivity is notoriously difficult to measure. Classic metrics tend to focus exclusively on outputs, but this approach is flawed — in software engineering, quantity of output isn’t necessarily the most productive goal. Quality is an important complement to quantity, and a team that’s measuring success in lines of code written may sacrifice conciseness for volume. This can lead to bloated, buggy code. A team focused on the number of features shipped may prioritize simple features that they can get out the door quickly, rather than spending time on more complex features that can move the needle for the business. The SPACE Framework aims to address this by replacing output-focused measurements with a more nuanced approach to understanding and optimizing developer productivity.
This research-based framework offers five key dimensions that, viewed in concert, offer a more comprehensive view of a team’s status. These dimensions guide leaders toward measuring and improving factors that impact outputs, rather than focusing solely on the outputs themselves.
Importantly, SPACE foregrounds the developer. It recognizes that leaders must empower their team members with the ability to take ownership of their work, grow their skills, and get things done while contributing to the success of the team as a whole.
What is the SPACE Framework?
The SPACE Framework is a systematic approach to measuring, understanding, and optimizing engineering productivity. Outlined by researchers from Github, Microsoft, and the University of Victoria, it encourages leaders to look at productivity holistically, placing metrics in conversation with each other and linking them to team goals. It breaks engineering productivity into five dimensions, Satisfaction and Well-being; Performance; Activity; Communication and Collaboration; and Efficiency and Flow.
Satisfaction and Well-being – Most often measured by employee surveys, this dimension asks whether team members are fulfilled, happy, and practicing healthy work habits. Satisfaction and well-being are strongly correlated with productivity, and they may even be important leading indicators; unhappy teams that are highly productive are likely headed toward burnout if nothing is done to improve their well-being.
Of all five SPACE dimensions, satisfaction and well-being is the hardest to quantify. Objective metrics can’t directly measure developer happiness, but they can point to circumstances that are likely to cause dissatisfaction or burnout. By viewing quantitative metrics in tandem with qualitative information and survey data, engineering leaders can better assess team satisfaction.
With Code Climate's Software Engineering Intelligence (SEI) solution, leaders can view engineering metrics like Coding Balance to get a sense of developer workload. Coding Balance displays the percentage of contributors responsible for 80% of your team’s most impactful work. If work is not evenly distributed, overloaded team members may be overwhelmed, while those doing less impactful work may not be challenged enough.
Another informative measure, Work in Progress PRs, offers a count of Pull Requests with activity over a 72-hour period. A high Work in Progress number could mean that developers are forced to context switch often, which can prevent developers from entering a state of flow. The ideal number of Work in Progress PRs is usually 1-2 PRs per developer.
To get a better understanding of overall satisfaction, engineering leaders should look at both short term changes and overall trends. For example, when an engineering manager at Code Climate noticed a spike in volume of PRs and reviews in a short amount of time, she took it as a sign to further investigate the workload of each developer. When she discovered that engineers were working overtime and on weekends in order to ship new features, she successfully advocated for extra time off to recharge and avoid potential burnout.
Performance – The originators of the SPACE Framework recommend assessing performance based on the outcome of a developer’s work. This could be a measure of code quality, or of the impact their work has on the product’s success.
Metrics that help evaluate performance include Defect Rate and Change Failure Rate. Change Failure Rate is a key performance metric, as it measures the percentage of deployments causing a failure in production, helping engineering leaders understand the quality of the code developed and shipped to customers. Every failure in production takes away time from developing new features and ultimately has a negative impact on customers.
When assessing team performance, PR Throughput is an important counterpoint to quality metrics. This metric counts PRs merged (a bug fix, new feature, or improvement) over time, and is correlated to output and progress. To get a full picture of performance, PR Throughput should be viewed alongside quality metrics; you’ll want to ensure that your team is delivering at volume while maintaining quality.
Activity – This dimension is most reminiscent of older measures of productivity as it refers to developer outputs like on-call participation, pull requests opened, volume of code reviewed, or documents written. Still, the framework reminds leaders that activity should not be viewed in isolation, and it should always be placed in context with qualitative information and other metrics.
Useful Activity metrics to look at include coding metrics, such as Commits Per Day, the average number of times Active Contributors commit code per coding day, and Pushes Per Day, the average number of times Active Contributors are pushing per day.
These metrics offer an overview of developer activity so you can gauge whether or not work is balanced, if workload matches expectations, and whether delivery capacity is in line with strategic goals.
It can also be helpful to look at Deployment Frequency, which measures how often teams deliver new features or bug fixes to production.
Communication and Collaboration – The most effective teams have a high degree of transparency and communication. This helps ensure developers are aligned on priorities, understand how their work fits into broader initiatives, and can learn from each other. Proxies for measuring communication and collaboration might include review coverage or documentation quality.
Code Climate supports Pair Programming, which encourages collaboration. Credit can be attributed to two developers who write code in a pairing session.
Metrics like Review Speed, Time to first Review, and Review Coverage, can help you assess the health of your collaborative code review process. These metrics can help identify whether your team is keeping collaboration top of mind, has enough time to review PRs, and is giving thoughtful feedback in comments.
Efficiency and Flow – In the SPACE framework, flow refers to a state of individual efficiency where work can be completed quickly, with limited interruption. Efficiency is similar, but it occurs at the team level. Both are important for minimizing developer frustration. (Though it’s worth noting that when an organization has too much efficiency and flow, it’s not always a good thing, as it may be at the expense of collaboration or review.) Perceived efficiency and flow can be important information gathered via survey, while speed metrics can capture a more objective measurement.
In Code Climate's SEI platform, Cycle Time is an important metric to view within the context of efficiency and flow, as well as Mean Lead Time for Changes. Cycle Time, aka your speedometer, is representative of your team’s time to market. A low Cycle Time often means a higher output of new features and bug fixes being delivered to your customers. Cycle Time is an objective way to evaluate how process changes are affecting your team’s output. Often, a high output with quality code can speak to a team’s stability.
Mean Lead Time for Changes, which refers to DevOps speed, measures how quickly a change in code makes it through to production successfully. This can be correlated to team health and ability to react quickly. Like Cycle Time, it can indicate whether your team’s culture and processes are effective in handling a large volume of requests.
How can you implement the SPACE Framework?
The framework’s authors caution that looking at all five dimensions at once is likely to be counterproductive. They recommend choosing three areas that align with team priorities and company goals. What a team chooses to measure will send a strong signal about what the team values, and it’s important to be deliberate about that decision. They also remind leaders to be mindful of invisible work and to check for biases in their evaluations.
At Code Climate, we’ve spent years helping software engineering leaders leverage engineering data to boost their teams’ productivity, efficiency, and alignment. With that experience in mind, we have a few additional recommendations:
- Be transparent. When introducing data in your organization or using data in a new way, it’s important to be open. Make sure your team members know what data you’re looking at, how you plan to use it, and what value you hope to gain from it.
- Place all metrics in context. Quantitative data can only tell you so much. It’s critical to supplement metrics with qualitative information, or you’ll miss key insights. For example, if you’re measuring activity metrics and see a decrease in pull requests opened, it’s important to talk to your team members about why that’s happening. You may find out that they’ve been spending more time in meetings, so they can’t find time to code. Or you may learn that they’re coding less because they’re working to make sense of the technical direction. Both these situations may impact activity, but will need to be addressed in very different ways.
- Work data into your existing processes. The most effective way to build a new habit is to layer it onto an existing one. If you’re already holding regular 1:1s, standups, and retros, you can use them as an opportunity to present data to your team, assess progress toward goals, and discuss opportunities for improvement. By bringing data to your meetings, you can help keep conversations on track and grounded in facts.
Why does the SPACE Framework matter?
The SPACE Framework helps engineering leaders think holistically about developer productivity. The five dimensions serve as critical reminders that developer productivity is about more than the work of one individual, but about the way a team comes together to achieve a goal. And perhaps somewhat counterintuitively, understanding productivity is about more than simply measuring outputs. In looking at multiple dimensions, teams can gain a fuller understanding of the factors influencing their productivity, and set themselves up for sustainable, long-term success.
Learn how you can use data to enhance engineering performance and software delivery by requesting a consultation.

Recent headlines might lead one to conclude that it’s more difficult than ever to build a high-performing team. Hiring is increasingly competitive, salaries are on the rise, and a growing number of people are choosing to switch jobs or exit the workforce entirely. But building a stellar team is about more than just recruiting great talent — it’s about investing in the talent you have. And that’s not investment in the financial sense (though salaries and benefits are important!), it’s a commitment to coaching and upskilling your existing team.
Focusing on professional development is a win-win. Helping developers excel will boost team performance. Ensuring that developers feel both challenged and supported will increase their job satisfaction and make them more likely to stick around.
How Can You Help Developers Upskill?
Of course, helping engineers level up their skills is a multi-layered process. Time and money set aside for learning is important, but it’s not enough. As a leader, there are things you can do to create a culture where positive feedback is welcomed, missteps are seen as learning opportunities, and developers feel comfortable openly discussing their professional goals. Once the cultural foundation is set, you can make adjustments to incorporate coaching into your team’s processes and help ensure that it remains a priority.
Culture Is Key to Leveling Up
Psychological safety is a prerequisite to the success of any coaching or professional development initiatives. In order for developers to have honest conversations about their career goals, or to be comfortable receiving feedback, they must trust that they will not be penalized for aspirations that are out of alignment with current responsibilities.
Though psychological safety is essential, it is just a baseline. An organization looking to prioritize professional development may also benefit from adopting elements of Continuous Improvement. In Continuous Improvement, every member of a team is on the lookout for opportunities to make incremental improvements. The underlying belief is that even small changes to processes, products, and more can have a big impact.
At the individual level, it would be detrimental to engage every team member in a conversation about one engineer’s professional development. The critical takeaway from Continuous Improvement is that improving should not be a top-down process. When it comes to coaching, it’s important to empower individuals with an active role in their professional development. They can actively contribute by identifying areas of incremental improvement, making plans for their own development, and setting and tracking progress toward goals. When they are involved in making plans, they’ll be more likely to see them through. As they realize the value of making small, positive changes, they’ll be motivated to keep learning.
Create Regular Touchpoints
At the process level, effective upskilling requires consistent check-ins and conversations. Regular 1:1s are a great opportunity to surface opportunities for upskilling, and to evaluate progress toward goals. Come prepared with observations and discussion points, and encourage your team members to do the same. Give them the chance to raise their questions and concerns first, so you can get a more complete understanding of what blockers are impacting them the most, and what skills they’d most like to improve. Make their goals a priority whenever possible, and seek out opportunities to challenge team members to envision how their goals align with business priorities.
These touchpoints will be most effective when a baseline of safety has already been established, though it’s still important to be proactive about reinforcing trust during 1:1s. Practicing vulnerability can help establish the right tone. You may also want to remind team members that 1:1s are not meant for work-related status updates, but for bigger picture conversations about their role, skills, and aspirations.
Leverage Data To Coach More Effectively
Leaders can supplement qualitative conversations with Engineering Intelligence data from a platform like Code Climate. With the help of objective data, it’s possible to cut through biases, check assumptions, and more accurately assess how a particular developer is working.
For example, you may observe that a particular team member rarely contributes in meetings, and only speaks when spoken to. You may conclude that this team member is not engaged or invested in their work, or that they don’t value collaboration. Engineering data can help you test that hypothesis. You might find that this same team member is an active participant in Code Reviews, frequently leaving thorough, impactful feedback for their peers. Where you once might have encouraged this team member to be more collaborative, you can now offer more specific feedback around participating in meetings. Alternatively, you may decide to accept their participation in reviews as evidence of their commitment to teamwork, and instead, work with them on another area of growth.
You can also use engineering data to identify specific units of work that may present learning opportunities. For example, if you notice that a developer has an abnormally large or long-running PR, you can have a conversation about the circumstances that are drawing things out. This allows you to surface potential anti-patterns or areas of weakness that may benefit from coaching. You may learn that the developer is having an issue with that particular area of the codebase, or you may find that they would benefit from coaching around coding hygiene.
It’s important to remember that metrics are not diagnostic, and quantitative data must always be placed in context. Different projects will naturally progress at different speeds, and non-code-related factors can impact the data. One engineer may appear to be struggling when in reality, they’re simply working through a tricky problem. Another engineer may be adding value through glue work that isn’t as recognizable as shipped code. If you’re gathering relevant context and having open, honest conversations with your team, you’ll be able to determine whether a concerning data point has a reasonable explanation, is an anomaly, or indicates something that needs to be addressed.
Data can do more than help you surface potential areas for improvement. It can help you make those improvements a reality. Goals are more effective when paired with objective data. Metrics make it possible to set and track progress towards specific, actionable targets, which will set your team members up for success. You and your team members will be able to align on exactly what they’re working toward and see how effectively they’re getting there. If progress seems to stall, you can check-in and re-evaluate your tactics — or the goal itself.
Upskilling Is Key to Building a High-Performance Team
Coaching and professional development take time, but they’re critical to driving success and retaining your top performers. It’s not enough to simply hire talented people, as even the most skilled developers will be looking for opportunities to keep growing. With a mixture of cultural and process-level adjustments, you can help create an environment that encourages development while still advancing business priorities.
To find out how to leverage data from a Software Engineering Intelligence (SEI) platform to upskill team members and boost retention, request a consultation.

Knowledge silos are more than just a frustration or an inconvenience — they’re a serious threat to productivity. Yet with a few tweaks to team processes, and a commitment to intentional communication, engineering leaders can break down existing knowledge silos, and make it less likely that new ones will form.
What are Knowledge Silos?
Knowledge silos are individuals or groups in possession of information that is not readily accessible to the rest of an organization. Sometimes knowledge silos are formed by the intentional withholding of information — an individual or team wants to be the go-to source for answers on a certain topic — but often they’re the result of workflows that fail to encourage collaboration and knowledge sharing. Generally, “knowledge silo” is not used to describe situations where the information in question is privileged or confidential, but rather, situations where sharing information would enable team members to work more efficiently or effectively.
What Do you Stand to Gain from Knowledge Sharing?
When engineers lack access to key information, they might end up spending time devising a new solution to a problem that has already been solved elsewhere in the codebase. Or, they may be forced to make assumptions, some of which will be incorrect, about how their work fits into the broader context of a feature or roadmap. When your team is solving the same problems over and over, or acting on incorrect assumptions, they’ll be less efficient, more frustrated, and more likely to perform unnecessary rework. In the more extreme cases, when knowledge only resides with one person on a team, that person’s absence can bring work to a standstill.
At Code Climate, an initiative to promote intentional knowledge sharing, including logging key decisions and documenting new tracks of work, helped boost throughput almost 70%. A broader study, GitHub’s 2021 State of the Octoverse, found that specific knowledge-sharing practices like creating and maintaining up-to-date, quality documentation, can increase developer productivity by 50%.
How Can you Break Down Knowledge Silos on Your Engineering Team?
Knowledge silos are a natural and expected part of any evolving organization, particularly as it scales, but there are process-level measures leaders can take to actively encourage knowledge sharing.
- Documentation – Though writing code may get all the glory, writing documentation is critical to the success of engineering projects. Documentation allows teams to share context and to align on everything from best practices to project specifications. When documentation isn’t written or maintained, information is harder to access. Engineers not only need to know who to ask about a particular feature or project, they also have to feel comfortable reaching out with their question.
- Pair Programming – Knowledge exchange is one of the most well-known benefits of pair programming. When two developers are working on the same piece of code, they’ll exchange context and perspectives to arrive at a shared solution. With pair programming, more junior team members will have the opportunity to ask questions; more senior team members can share wisdom culled from their own experiences; and team members with different specialties and skill sets can learn from each other.
- Code Review – While different organizations employ different best practices for Code Review, it is a fundamental opportunity for engineers to share knowledge and offer feedback to help improve each other’s work. If you’re using a Software Engineering Intelligence (SEI) solution like Code Climate, metrics like Review Speed and Review Influence can help provide a sense of whether engineers are prioritizing Code Reviews, whether reviewers are leaving impactful feedback or rubber-stamping code, and if PRs are evenly distributed among reviewers. If one reviewer is disproportionately commenting on certain kinds of PRs, or PRs associated with a particular area of the codebase, that could indicate a potential knowledge silo.
- Draft PRs – Designed to encourage collaboration, Draft PRs enable developers to signal to potential reviewers that code is a work in progress while still opening the door for feedback. This allows developers to gain perspective from teammates at the earliest stages while ensuring that work in progress code does not get merged or prematurely factor into any review metrics being tracked in an SEI platform.
By implementing processes that require communication and collaboration, teams can actively encourage information sharing, rather than leaving it up to chance. With more information exchanged, existing knowledge silos will break down, fewer new ones will form, and overall team productivity will get a boost.
To learn more about using an SEI platform to spot blockers like knowledge silos and improve engineering processes, request a consultation.

It’s no secret that performance reviews are flawed. Not only is occasional feedback unlikely to affect meaningful growth, but the feedback itself can also be suspect — studies indicate that numerical ratings reveal more about the rater than the person being reviewed, while open-ended evaluations are subject to a host of performance review biases.
Despite this research, most companies still rely on some form of performance review. They’re not ready to pivot from the idea of using reviews to promote professional development, and many employees aren’t either. As an engineering leader, you may not be able to overhaul your company’s review process, but you can still take steps to minimize some of its flaws. Engineering data found in your VCS and project management tools can help by acting as a check against anecdotal evidence and gut feel, helping you combat some common performance review biases.
Common Performance Review Biases
Biases may be evident in nearly every aspect of your day-to-day, but the open-ended format of most performance review frameworks is particularly vulnerable to some common biases. If you’re aware of their existence, you can take steps to counteract them.
Recency Bias
When reviews happen infrequently, the period of time right around review season is freshest in the reviewer’s mind and tends to be given the most weight.
What you can do: A skim of the Issues a developer worked on over the past year can be an important reminder of all they contributed, and a great way to refresh your memory. In addition, a deep dive into specific engineering metrics can help you distinguish longstanding patterns from recent anomalies. For example, you may have noticed that a developer is prioritizing their own work and putting off reviewing teammates’ Pull Requests. By looking at trends in a metric like Review Speed, you can determine whether or not that’s a new development, so you can calibrate your conversation accordingly.
Halo/Horns Effect
The Halo/Horns Effect occurs when a manager lets one trait — good or bad — skew their entire impression of an individual.
What you can do: There may be an engineer on your team who rarely speaks during meetings, and only participates when directly spoken to. You could take that as evidence that they’re generally disengaged at work, but data might reveal otherwise. If that same engineer has a consistently high PR Throughput and frequently participates in Code Review, it’s more likely that they just don’t like speaking up in group settings. With this information, you can offer specific feedback about their participation in meetings, rather than general (and inaccurate) feedback about their overall level of engagement, or you can adapt your expectations to match their work style.
Gender Bias
Studies show that reviewers tend to focus more on the personality traits of women and female-presenting individuals than on their skills or accomplishments.
What you can do: Make a conscious effort to focus on an individual’s work, and be sure to check any of your assumptions against objective data. For example, you can look at a developer’s history of commits, pushes, and review activity to confirm whether their work is in line with your expectations for a developer in their role. You might expect a more senior developer to spend less time committing new code and more time giving feedback to their teammates, but your expectations may be the opposite for a more junior team member.
Similarity Bias
This is the tendency of a manager to look more favorably on team members who remind them of themselves, perhaps due to a particular personality trait, a shared work style, or an aspect of their training or background.
What you can do: You may feel a particular kinship with a developer and assume that they’re achieving at the level you would in their role, but a look at the data — whether it’s their PR Throughput or a review of their contributions to Code Reviews — can help you regain perspective and ground your assessment in the reality of their work.
Using Data to Check Your Performance Review Biases
Data is not only a valuable tool for dismantling performance review biases, it can help you deliver specific, actionable feedback and collaborate with developers to set clear goals for the future. As with any tool, however, it must be used carefully.
Quantitative data should always be contextualized with qualitative data, and it’s important to resist the urge to compare or rank the members of your team. Developers coding new features will naturally work at a different pace than those working through technical debt, and team leads will likely be focused more on coaching or project management than committing code. You’ll need to pair data with an understanding of the circumstances surrounding each team member’s work in order to have a complete picture of their overall performance.
If you’re interested in learning more about incorporating data into your performance reviews, request a consultation.

As you think about driving high performance on your team, it’s easy to focus on certain tangible improvements like optimizing processes, upskilling team members, and hiring new talent. But your team will only go so far if you neglect to cultivate a key aspect of team culture — psychological safety. Psychological safety, most commonly defined as the knowledge that you won’t be punished for making a mistake, is critical to the success of the highest performing organizations; it allows teams and individuals to have confidence in taking risks of all kinds, from the most basic risk of opening a Pull Request for feedback, to the larger leaps necessary to drive true innovation and stay ahead of the competition.
With the right data and a clear strategy for analysis, you’ll be able circumvent some common biases and assumptions, while fostering the psychological safety necessary to keep improving as a team.
Software Engineers Need Safety to Deploy
Safety is a prerequisite of speed; developers who aren’t confident in their code might become a bottleneck if they’re hesitant to open a PR and receive feedback. When your team has a culture of safety, that developer can feel more secure subjecting their work to the review process. They know they’ll have the opportunity to work through their mistakes, rather than being penalized for them.
Psychological safety is also critical at the other end of your software development pipeline. Developers need to feel secure enough to deploy code, and that security can be found on two levels: the confidence that their deployment won’t break things, and the trust that they won’t be punished if it does.
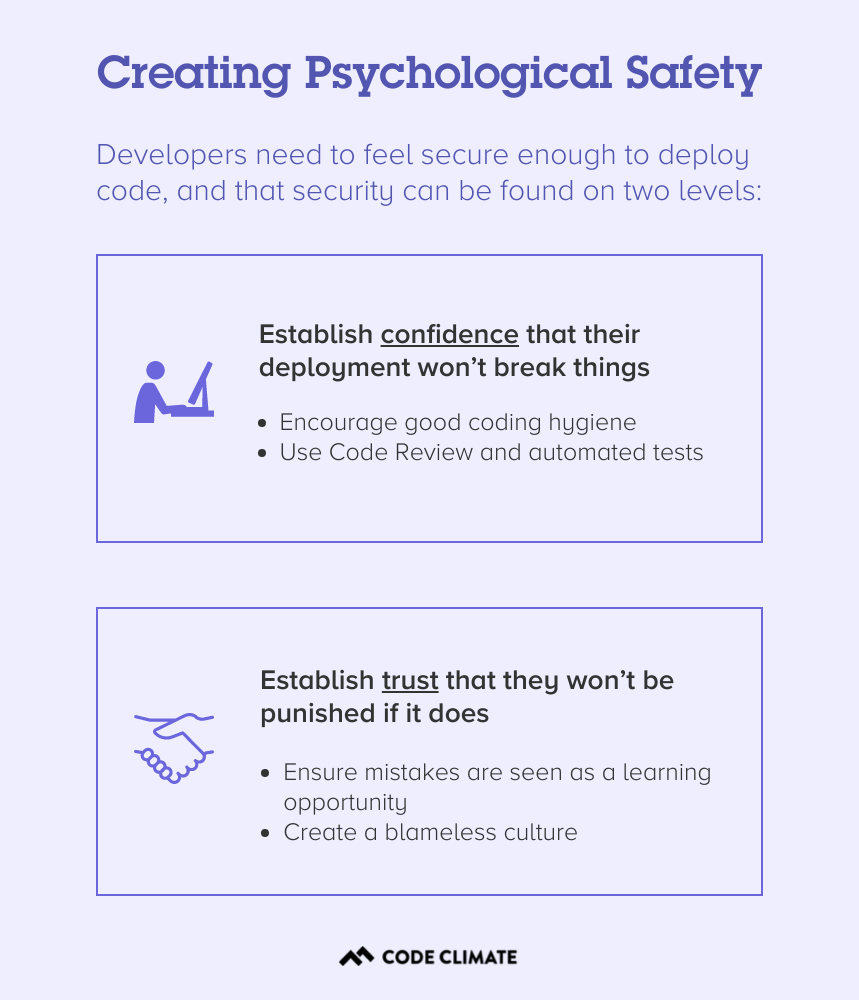
The first is mainly a factor of process and tooling. Code Review and automated tests can offer some degree of confidence that buggy code won’t be deployed, while good coding hygiene, specifically the practice of keeping Pull Requests as small as possible, will mean that any damaging changes are easier to identify and reverse.
The second level, the trust that a developer won’t be punished if their code introduces a bug or causes an incident, is a matter of culture. It’s an engineering leader’s responsibility to create a culture of psychological safety on their team, and to ensure that mistakes are seen as a learning opportunity, rather than an occasion for punishment. In a blameless culture, the work is evaluated and discussed independently of the person who completed it, and every member of a team stands to benefit from the learning experience.
Without this foundation of trust, your team will be hard-pressed to deploy quickly and consistently, let alone take the larger risks necessary to pursue big ideas, innovate, and stay ahead of your competition.
Using Data to Create Psychological Safety
Data can play a key role in your efforts to cultivate a culture of psychological safety. Whenever you introduce data in your organization, it’s important to do so responsibly — be transparent, put all data in context, and avoid using it to penalize members of your team. But used properly, clear, objective metrics can help you combat intrinsic biases and check your assumptions, while keeping conversations grounded in fact. This makes it easier to keep conversations focused on the work, rather than the person behind that work.
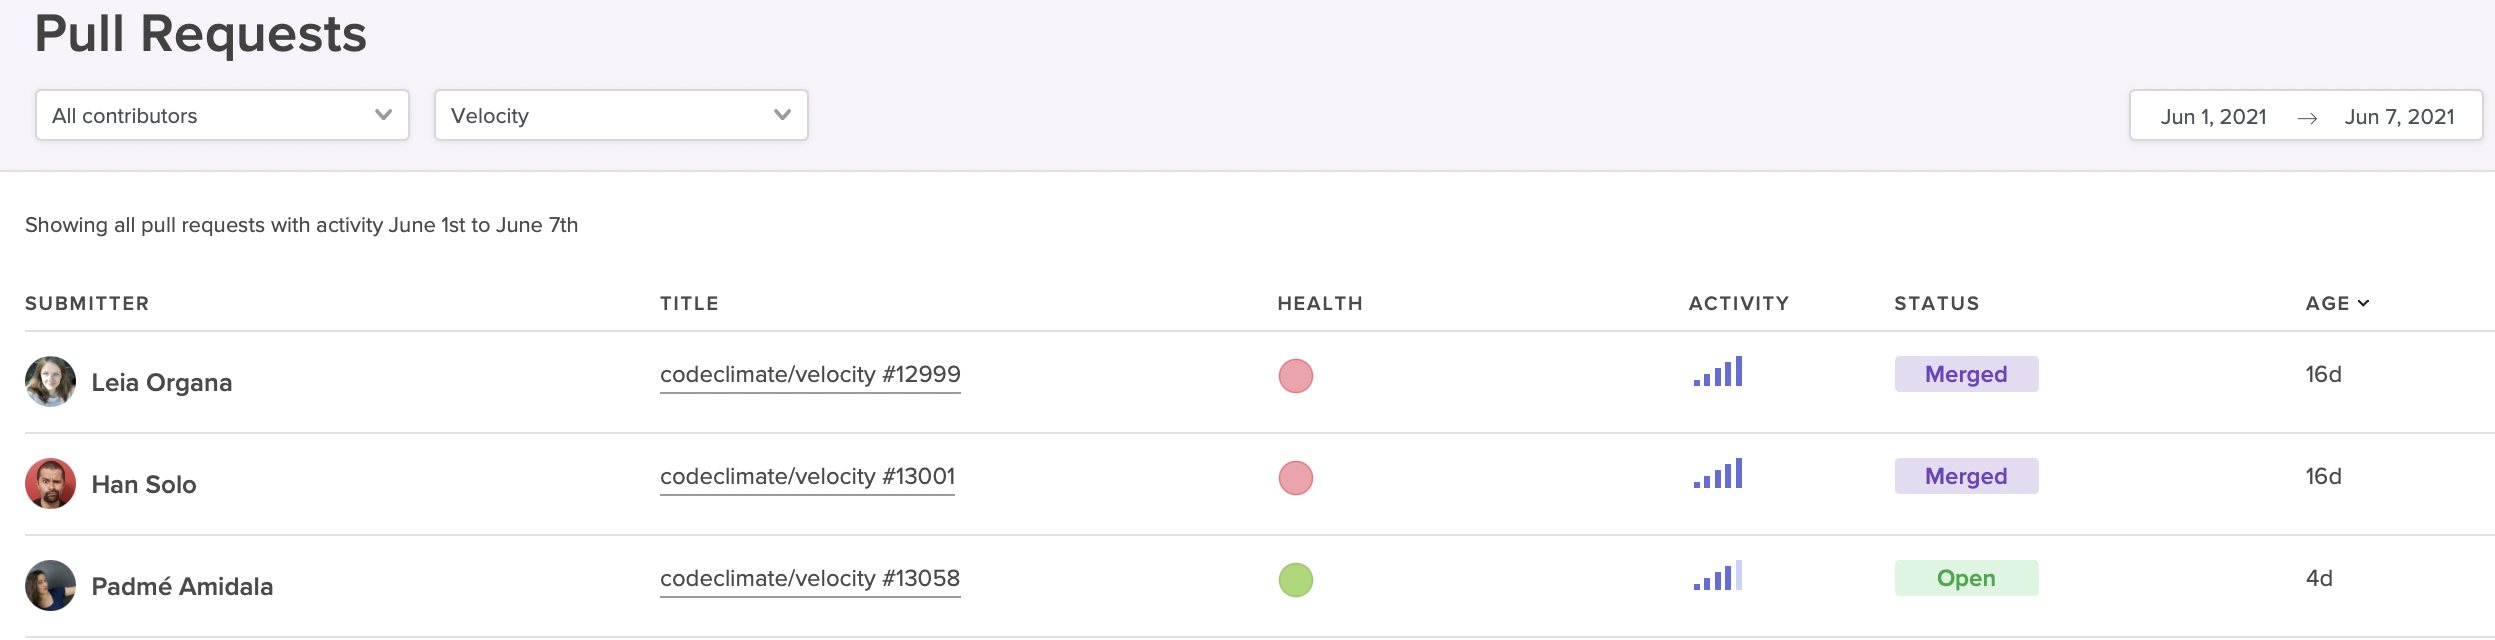
Surface high-activity Pull Requests that could be at risk of derailing your sprint.
For example, if a particular sprint is falling behind, you could frame the conversation in a general sense, asking the team why they’re moving slowly. But this framing risks putting your team members on the defensive — it could be construed as finding fault in your developers, and places blame on them for the slowdown.
With data from a Software Engineering Intelligence platform like Code Climate, it’s easier to ensure that discussions remain focused on the work itself. For instance, it’s possible to identify at-risk work before it derails your sprint. You can pull up a report that highlights long-running, high-activity Pull Requests, then dig into those PRs with your team. If you keep the conversation focused on those specific units of work, you’ll be better able to surface the particular challenges that are slowing things down and work through them together.
To find out how data can help you create psychological safety and drive performance in your organization, request a consultation.

Developers who are struggling to keep up, as well as those developers who are excelling but no longer growing, are likely to be unsatisfied in their current roles. But engineering leaders, especially managers of managers or those who are not involved in the day-to-day writing of code, may not have insight into who is in need of support and who is craving their next challenge.
With the right combination of quantitative and qualitative data, you’ll be able to spot opportunities to coach developers of all levels. You’ll also have an easier time setting and tracking progress towards concrete targets, which will empower your team members to reach their goals.
Start by Gathering Qualitative Engineering Data
Use your 1 on 1 time to initiate conversations with each of your team members about where they think their strengths and weaknesses lie, and what they’d like to improve. You may want to give your team members some time to prepare for these conversations, as it can be hard to make this sort of assessment on the spot.
Pay extra attention in standups and retros, keeping an eye out for any patterns that might be relevant, like a developer who frequently gets stuck on the same kind of problem or tends to surface similar issues — these could represent valuable coaching opportunities. It can also be helpful to look for alignment between individual goals and team objectives, as this will make it easier to narrow your focus and help drive progress on multiple levels.
Dig Into Quantitative Engineering Data
Next, you’ll want to take a closer look at quantitative data. A Software Engineering Intelligence platform like Code Climate can pull information from your existing engineering tools and turn them into actionable reports and visualizations, giving you greater insight into where your developers are excelling, and where they might be struggling. Use this information to confirm your team member’s assessment of their strengths and weaknesses, as well as your own observations.
You may find that an engineer who feels like they’re a a slow coder isn’t actually struggling to keep up with their workload because of their skill level, but because they’ve been pulled into too many meetings and aren’t getting as much coding time as other team members. In other cases, the quantitative data will surface new issues or confirm what you and your team member already know, underscoring the need to focus on a particular area for improvement.
A Code Climate customer and CTO finds this kind of quantitative data particularly helpful for ensuring new hires are onboarding effectively — and for spotting high-performers early on. As a new member of the team, a developer may not have an accurate idea of how well they’re getting up to speed, but data can provide an objective assessment of how quickly they’re progressing. James finds it helpful to compare the same metrics across new developers and seasoned team members, to find out where recent hires could use a bit of additional support. This type of comparison also makes it easier to spot new engineers who are progressing faster than expected, so that team leaders can make sure to offer them more challenging work and keep them engaged. Of course, as is true with all data, James cautions that these kinds of metrics-based comparisons must always be viewed in context — engineers working on different types of projects and in different parts of the codebase will naturally perform differently on certain metrics.
Set Concrete Engineering Goals
Once you’ve identified areas for improvement, you’ll want to set specific, achievable goals. Quantitative data is critical to setting those goals, as it provides the concrete measurements necessary to drive improvement. Work with each team member to evaluate the particular challenges they’re facing and come up with a plan of action for addressing them. Then, set realistic, yet ambitious goals that are tied to specific objective measurements.
This won’t always be easy — if a developer is struggling with confidence in their coding ability, for example, you won’t be able to apply a confidence metric, but you can find something else useful to measure. Try setting targets for PR Size or Time to Open, which will encourage that developer to open smaller Pull Requests more frequently, opening their work up to constructive feedback from the rest of the team. Ideally, they’ll be met with positive reinforcement and a confidence boost as their work moves through the development pipeline, but even if it does turn out their code isn’t up to par, smaller Pull Requests will result in smaller changes, and hopefully alleviate the overwhelming feeling that can come when a large Pull Request is met with multiple comments and edits in the review process.
Targets like these can be an important way to help developers reach their individual goals, but you can also use them to set team- or organization-wide goals and encourage progress on multiple fronts. Roger Deetz, VP of Engineering at Springbuk, used Code Climate to identify best practices and help coach developers across the organization to adopt them. With specific goals and concrete targets, the team was able to decrease their Cycle Time by 48% and boost Pull Request Throughput by 64%.
Though it’s certainly possible to coach developers and drive progress without objective data, it’s much harder. If you’re looking to promote high-performance on your team, look to incorporate data into your approach. You’ll be able to identify specific coaching opportunities, set concrete goals, and help every member of your team excel.

It’s important for a manager to know what their team members are working on, and to understand how that work is going. Still, how you get that information matters. Turning every standup into a status update or constantly checking in with engineers can be disruptive to developers’ flow, and can make your team members feel like you’re micromanaging their every move.
Status updates of this kind are also not productive for an individual contributor — you may need visibility into your team’s workflow, but looping you in isn’t providing value to your engineers. When your team stops what they’re doing to give you basic information, they’re not getting much out of the exchange.
If you get the visibility you need from data that already exists in your engineering workflow, you can dedicate your 1 on 1s, standups, and check-ins to higher-value interactions, whether that’s team-building, problem-solving, innovation, or professional development. Your team will be happier and more productive, and you’ll be able to use your meetings and conversations to make a bigger impact on your organization — and to empower your developers to do the same.
Get Visibility With Data, Not Check-Ins
Of course, you still need a sense of what everyone’s working on and how it’s going. Get that basic information from a Software Engineering Intelligence (SEI) solution like Code Climate, which gathers key information from your existing engineering workflow. You’ll be able to quickly get a sense of what each developer is working on and check that against your expectations of your team’s priorities and workload.
With that information, you can determine the best course of action for supporting your team.
When things are running smoothly, it’s likely best to take a step back and let your developers manage their own work. There may be opportunity for improvement — there always is — but that’s what retros are for. If you’re running effective retrospectives after each project or sprint, your team will still find opportunities to keep doing better.
Look For: A low PR Cycle Time, which indicates that Pull Requests are moving through your software development pipeline quickly and efficiently.
In the middle of a sprint, however, you’ll want to focus on work that isn’t going as planned, rather than work that meets your expectations. With Code Climate, for example, you can easily surface at-risk Pull Requests — PRs that are exceedingly large, have been open for long periods of time, or are taking up the attention of multiple members of your team. Some PRs are naturally larger and more complex, and that’s ok. But in some cases, these characteristics are red flags, signs that your team members could use your support. If you follow up on at-risk units of work, you’re likely to find opportunities to help your team members resolve bottlenecks or tackle challenges. You’ll enter meetings already informed, and you’ll be able to keep conversations focused and productive.
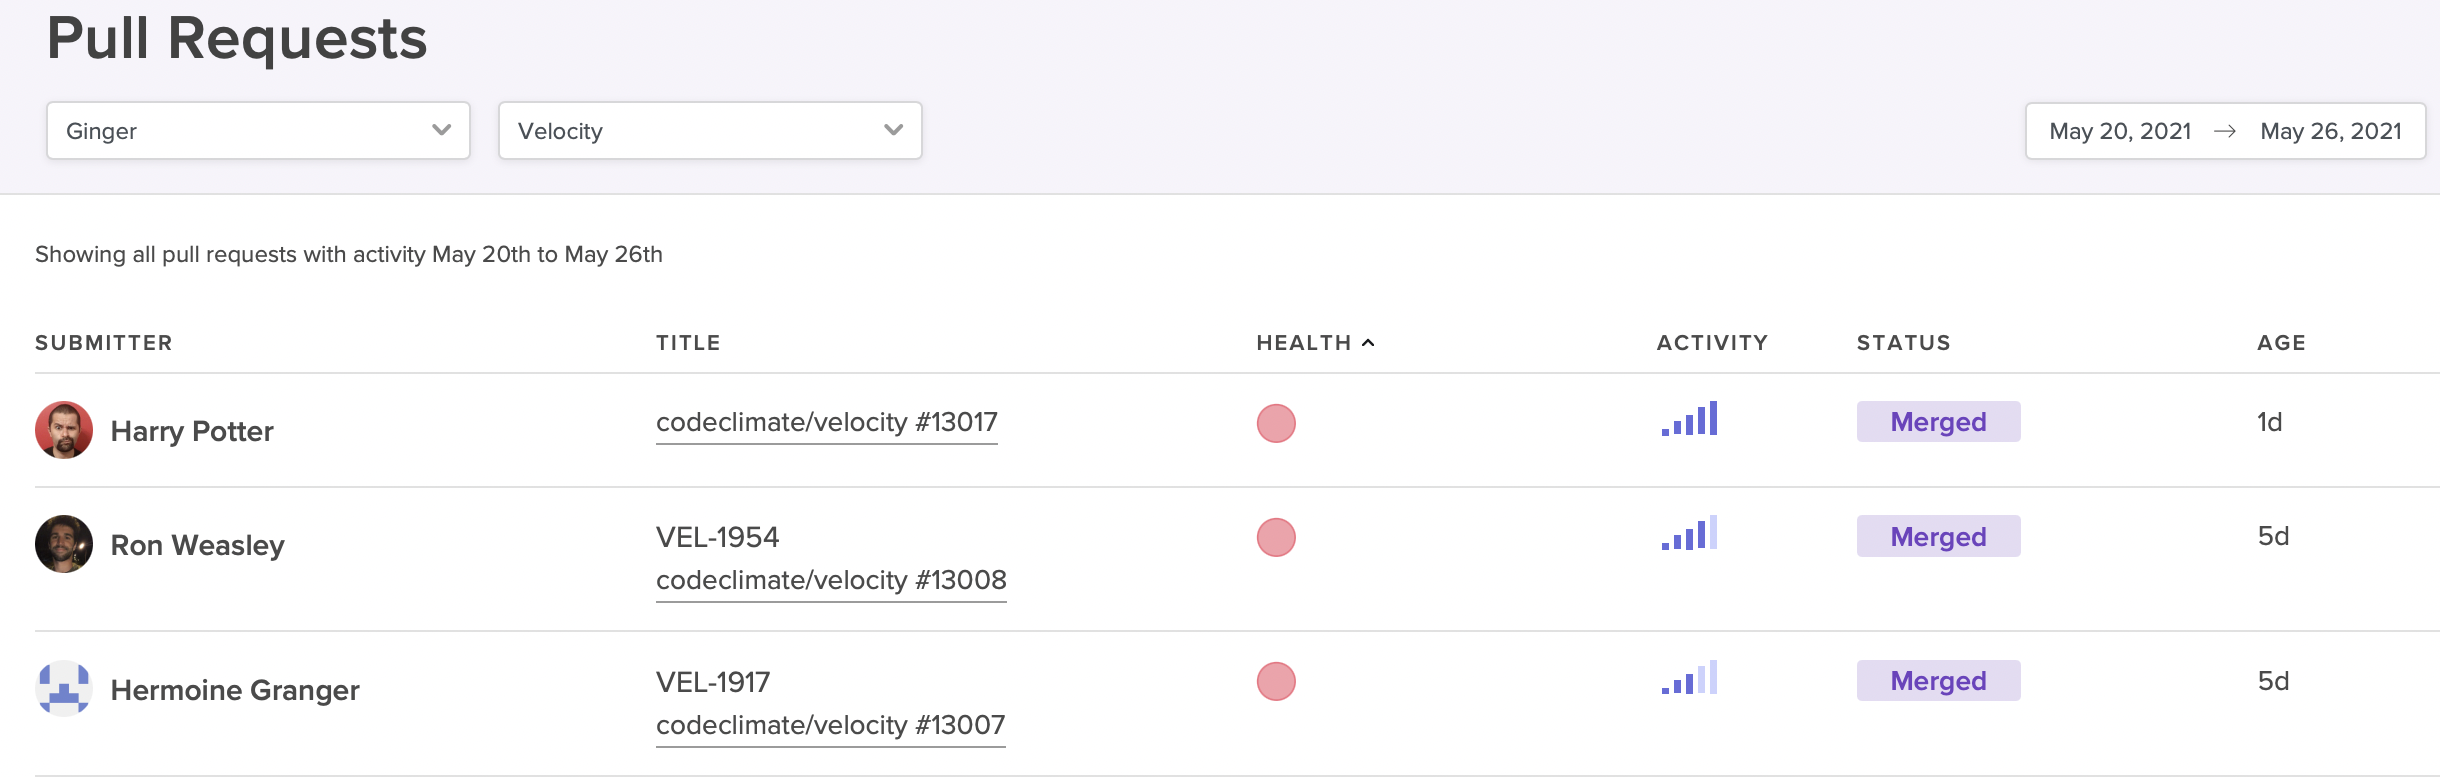
The Pull Requests report can help you easily surface at-risk PRs.
Look For: PRs that are exceedingly large, have been open for long periods of time, or are taking up the attention of multiple members of your team. (A Software Engineering Intelligence platform can help you easily surface at-risk PRs like these, based on information that already exists in your VCS or other engineering tools.) Some PRs are naturally larger and more complex, and that’s ok. In some cases, these characteristics are red flags. Talk to your team about any concerning PRs to determine whether your developers could use your support.
Use Data Responsibly to Avoid Becoming Big Brother
Even managers who barely think twice about interrupting an engineer’s workday to ask for an update worry that digging into data from their engineering workflow may feel invasive. The key to maintaining your team’s trust and fostering a greater sense of autonomy lies not in whether you have access to data, but how you use it. As a leader, it’s your responsibility to cultivate a culture of transparency and safety where metrics are used responsibly and constructively.
When Code Climate customer introduced engineering metrics at their organization, the CTO was careful to put them in perspective: “I spoke about Coe Climate and Cycle Time — how you measure a process, not people. And how you improve a process. I said to the team, ‘I’m going to start measuring the team just to measure the process and improve it. I’m not measuring individuals.’” With this groundwork, the team could surface key information about its workflow without constant check-ins and shoulder taps. As a result, they refined their processes and doubled their productivity, slashing their Cycle Time from 72 hours to 30 hours.
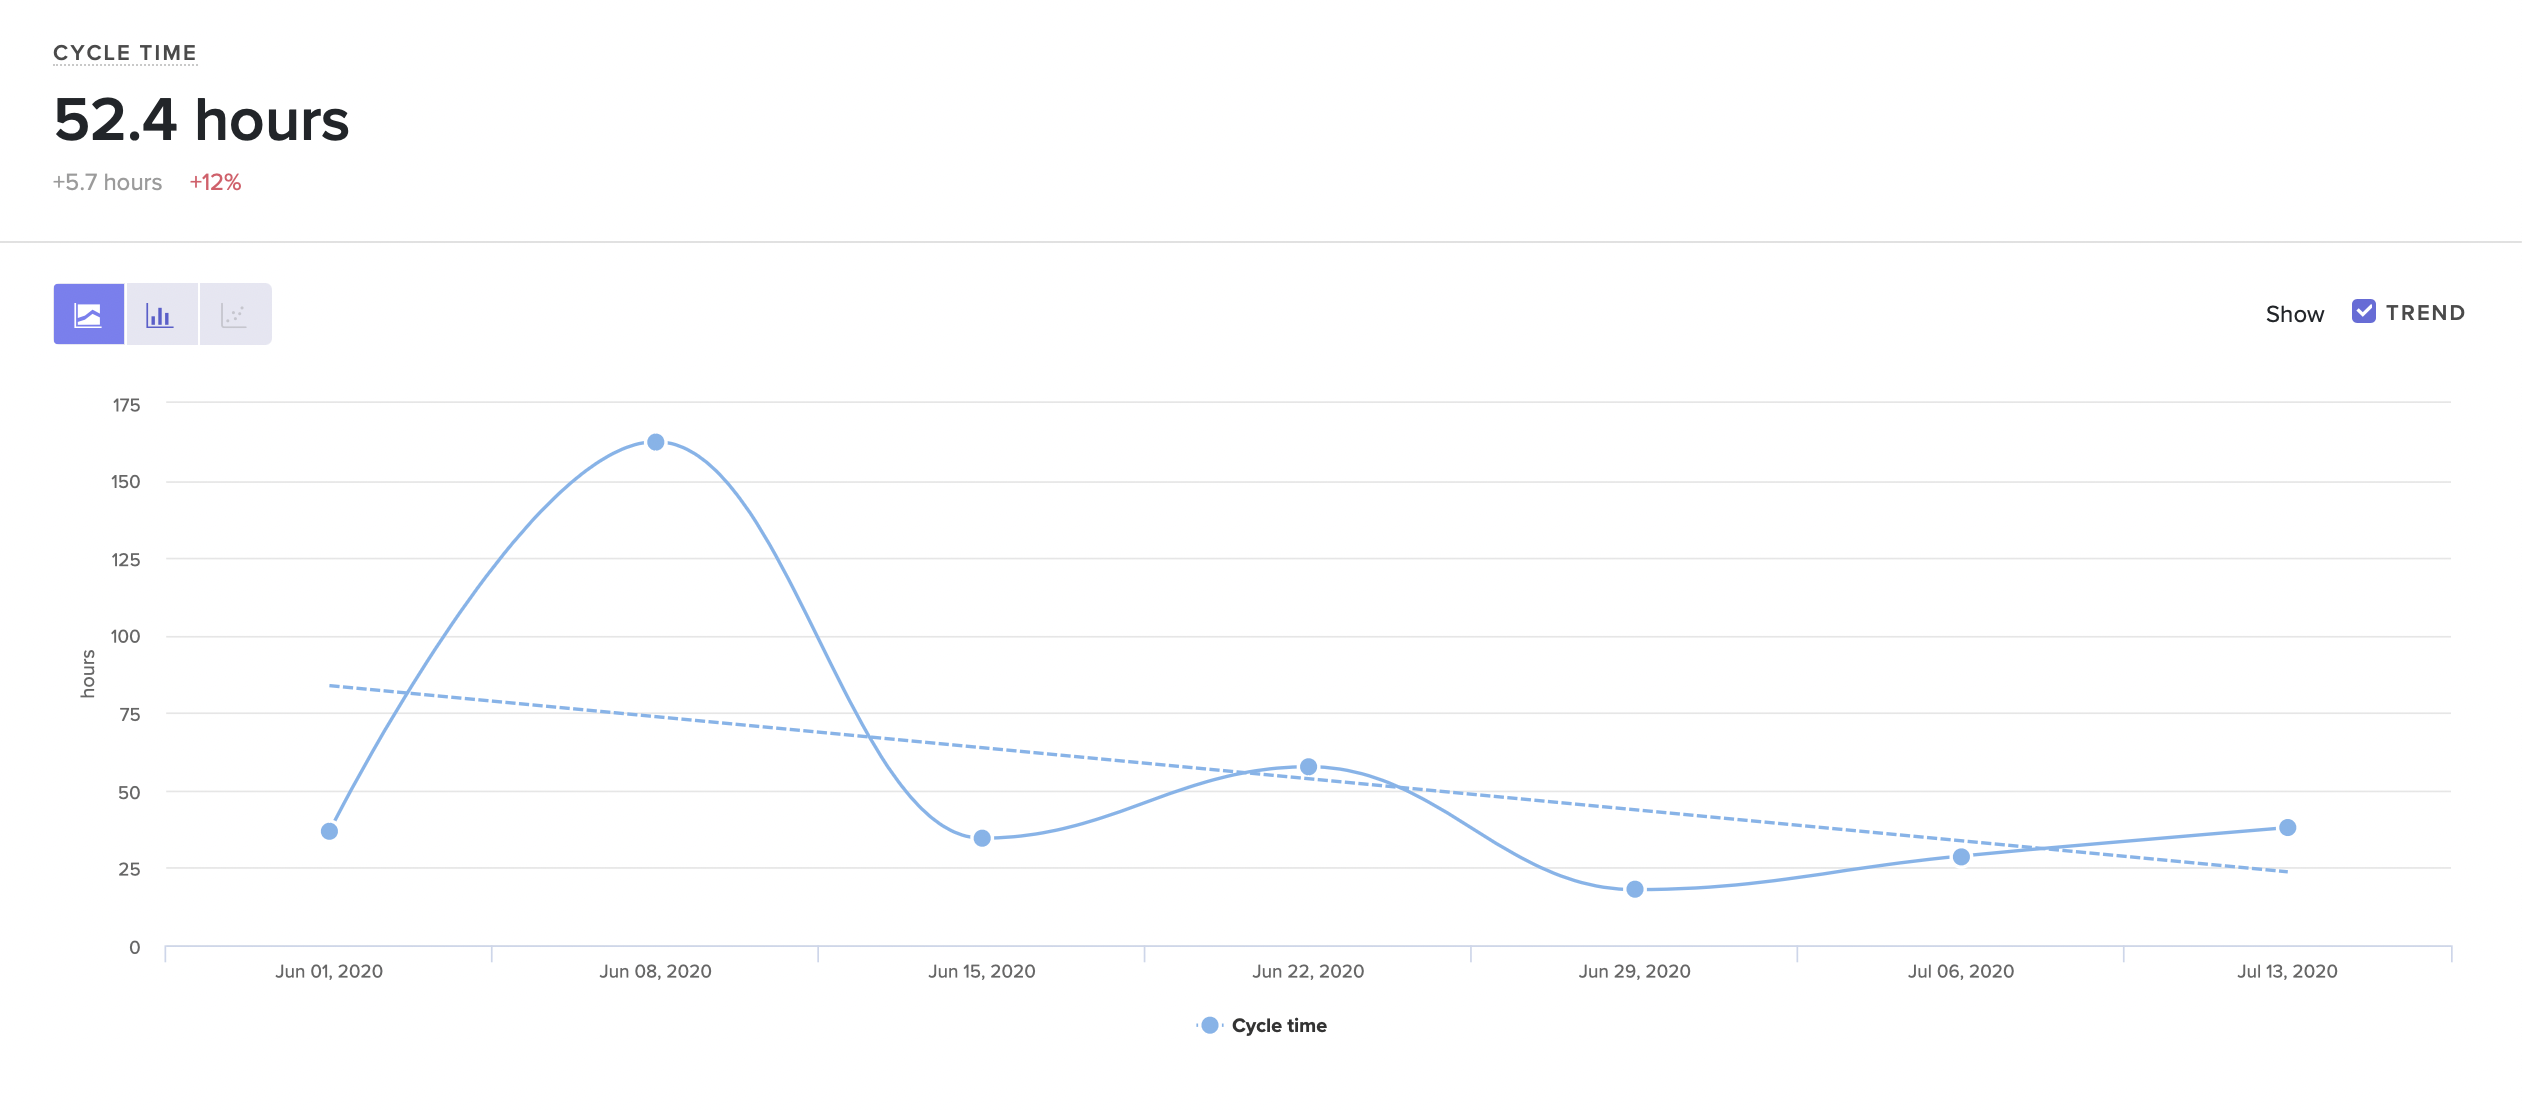
Visualize trends in the way your team is working.
When bringing data into your organization, it’s important to remember that:
- Data must be used with transparency. Your team members should know what information you’re looking at, who else has access to it, and how you plan to use it. Make sure you communicate openly and honestly about any plans you have to introduce data, and your goals for bringing data into your organization.
- Data should enhance, not replace conversations. Data doesn’t tell the whole story, and should always be viewed in context. Use it as a starting point for conversations, rather than using it as the basis for decisions.
- Data provides insights about the work, not the person. Engineering is collaborative, and it’s up to you to ensure no one feels personally responsible for issues or negative trends. Keep the focus on the work so your whole team can get behind improvement.
- Data should be used constructively, not punitively. Mistakes and shortfalls should be viewed as coaching opportunities, rather than occasions to take punitive action.
If you keep these principles in mind, you’ll be able to use data in a way that benefits you as a leader, as well as your team members as managers and ICs. Free of unnecessary check-ins and status updates, your team members will enjoy more autonomy and have more time to focus on their work. Together, you’ll be able to tackle larger challenges and make an even bigger impact on your organization.
Request a consultation to learn more.

(Updated: February 20, 2024)
When building a high-performance engineering organization, it’s not enough to hire top talent — leaders must also keep developer experience in mind and create an environment that’s conducive to productivity. Even the most skilled developers will be hamstrung by ineffective processes and other bottlenecks that stand in the way of deploying code.
That doesn’t mean it’s easy to identify the blockers that are slowing down your team. When code is making it through to production, it’s easy to assume that your processes are functioning. Leaders often lack the visibility to pinpoint bottlenecks, and developers may be reluctant to raise their hands and voice concerns, particularly if their concerns are based on gut feel.
To effectively remove blockers and boost engineering productivity, you need data. With the right information, you’ll be able to enhance visibility and supplement gut feel, making it possible to quickly spot bottlenecks in your software development pipeline and empower developers to collaborate on effective solutions.
How to Use Data to Identify Bottlenecks in Your Processes
Used thoughtfully, data is a critical tool for identifying and refining broken processes, as well as optimizing processes that are functional, but could be even more efficient.
With the right data, you can:
- Check your assumptions. Data can provide the objective evidence necessary to challenge your assumptions about what should be working. When confronted with concrete numbers, you may find that certain ‘best practices’ are not practical for your team, or processes that seem logical on paper may not hold up in practice. For example, though Code Review can be a critical way to vet code and share knowledge across your team, there’s no one-size-fits all solution for keeping code moving quickly through the review process. With an objective look at the way PRs move through review, you’ll be able to refine your process and find the one that works best for your team.
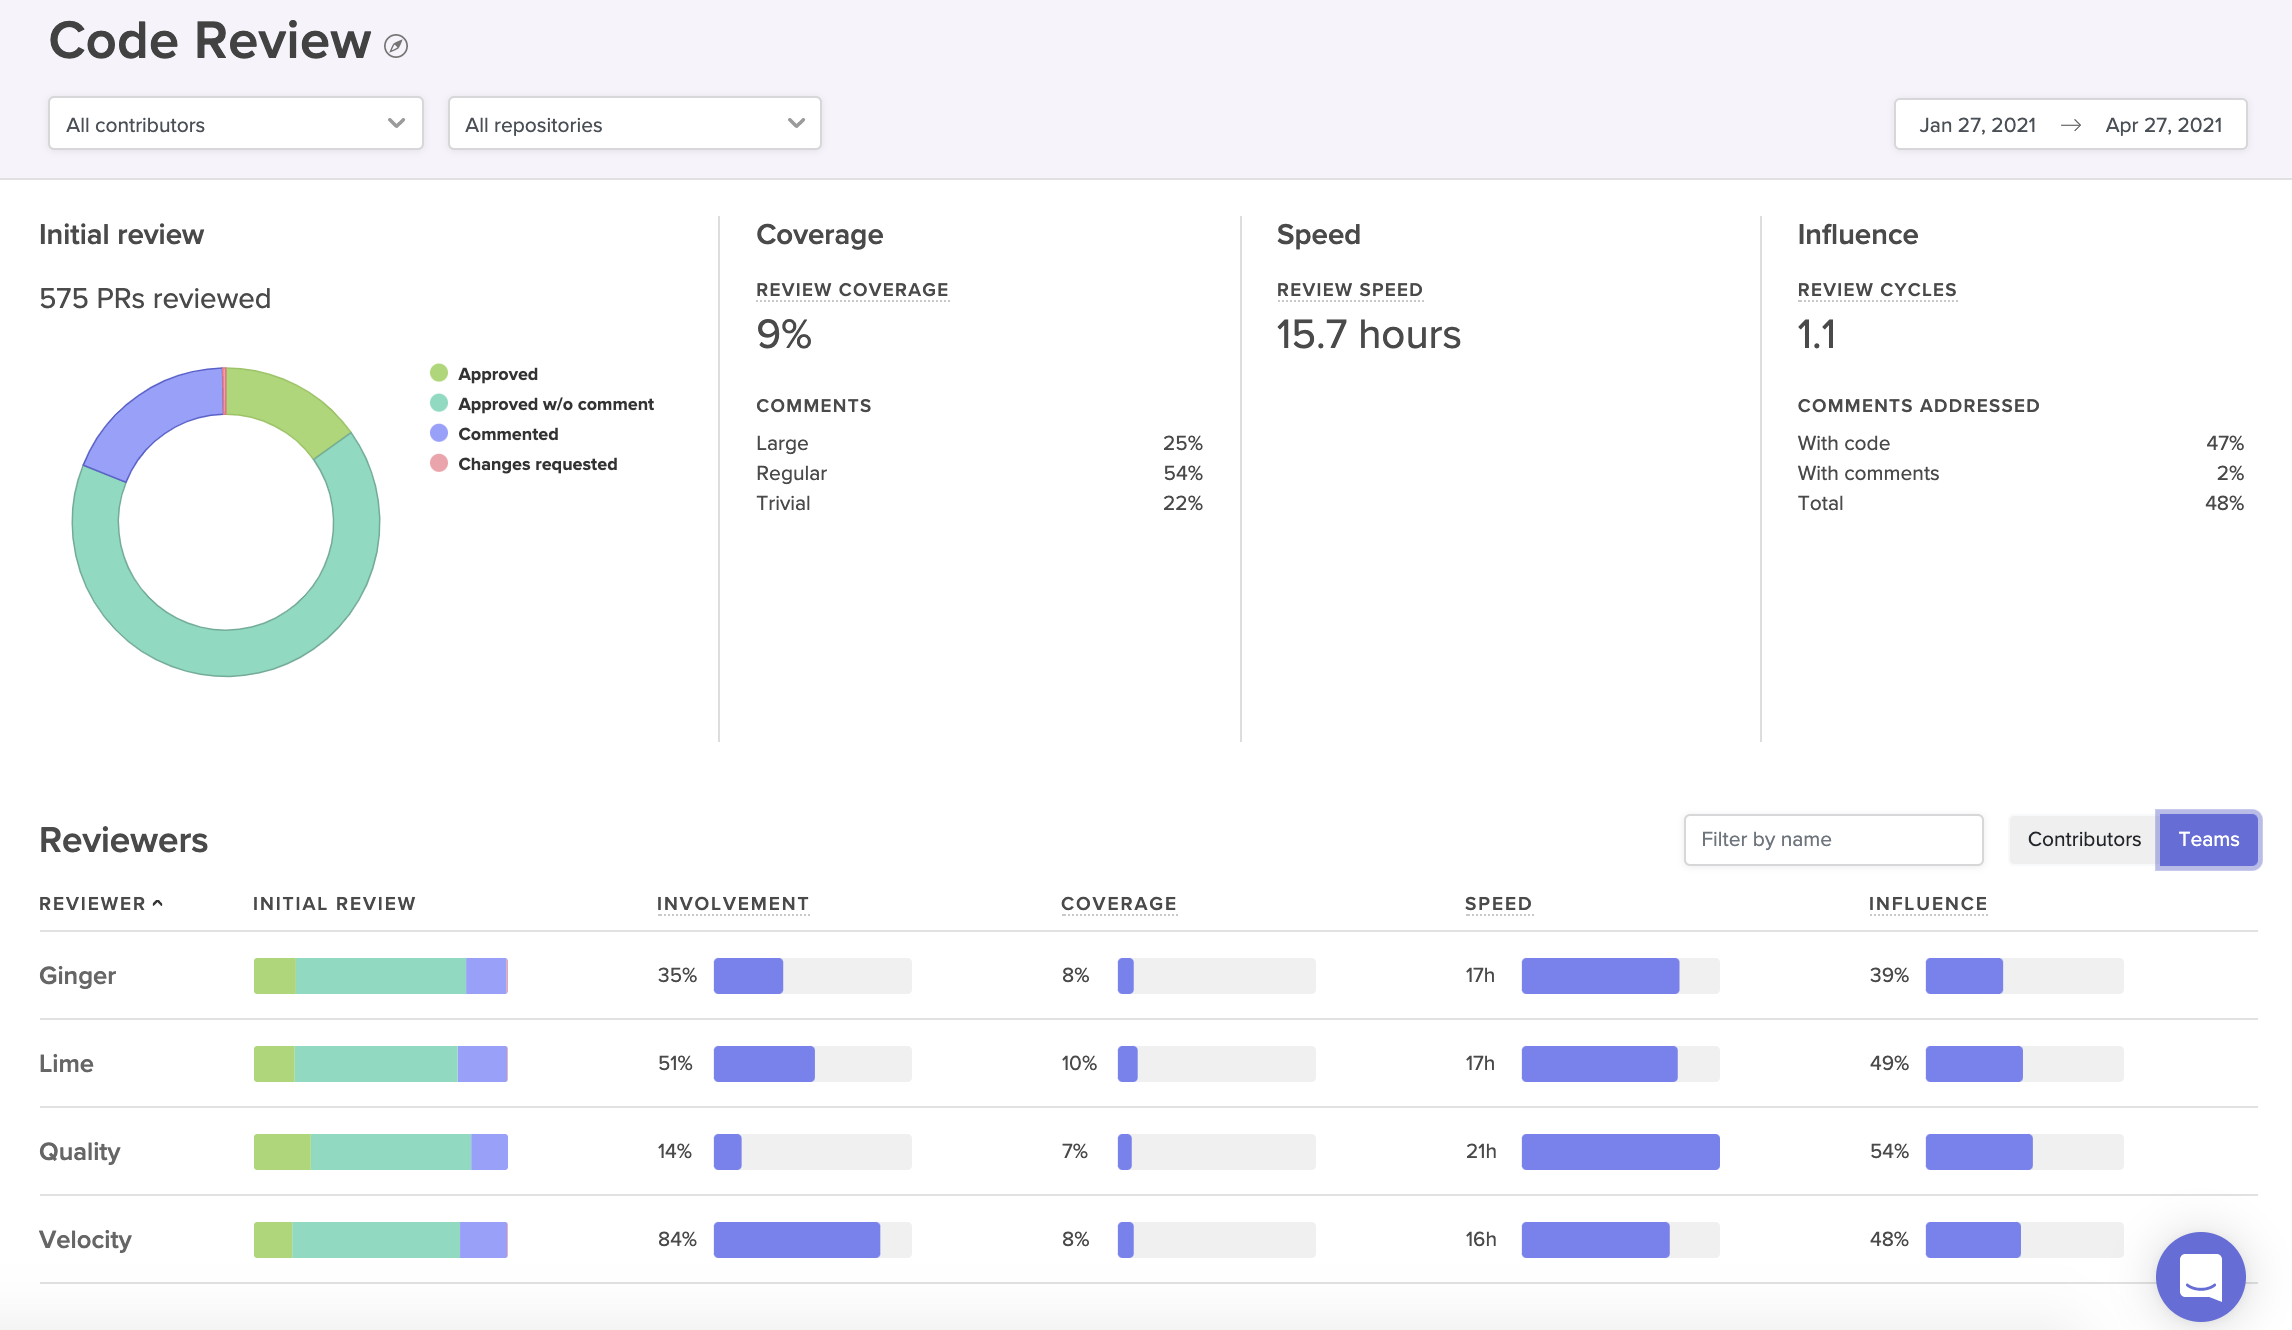
A Code Review Report provides a visual summary of the way PRs move through your review process.
For example, some globally distributed teams prefer to allow low-impact changes to bypass the review process entirely, rather than waiting around to be approved by teammates in different timezones. One Code Climate customer dealt with a Code Review bottleneck by letting pair-programmed PRs skip review — these PRs are already well-vetted, because they’ve been worked over by two developers. This change, among others, helped the customer decrease their Cycle Time by 35% within 10 months of implementing Code Climate's Software Engineering Intelligence (SEI) solution and becoming a data-driven engineering organization.
- Look at change over time. Data makes it possible to compare your current progress to past trends. Not only will you be able to tell if your team is, in fact, moving more slowly, you’ll have the information you need to investigate each phase of development and identify the source of the slowdown. A team in the midst of a transition, like a hiring push or a switch to remote work, might find this kind of comparison to be particularly useful. Looking at key metrics before and after a big change can make it easier to identify which parts of the process are most impacted by the change and therefore most in need of attention.
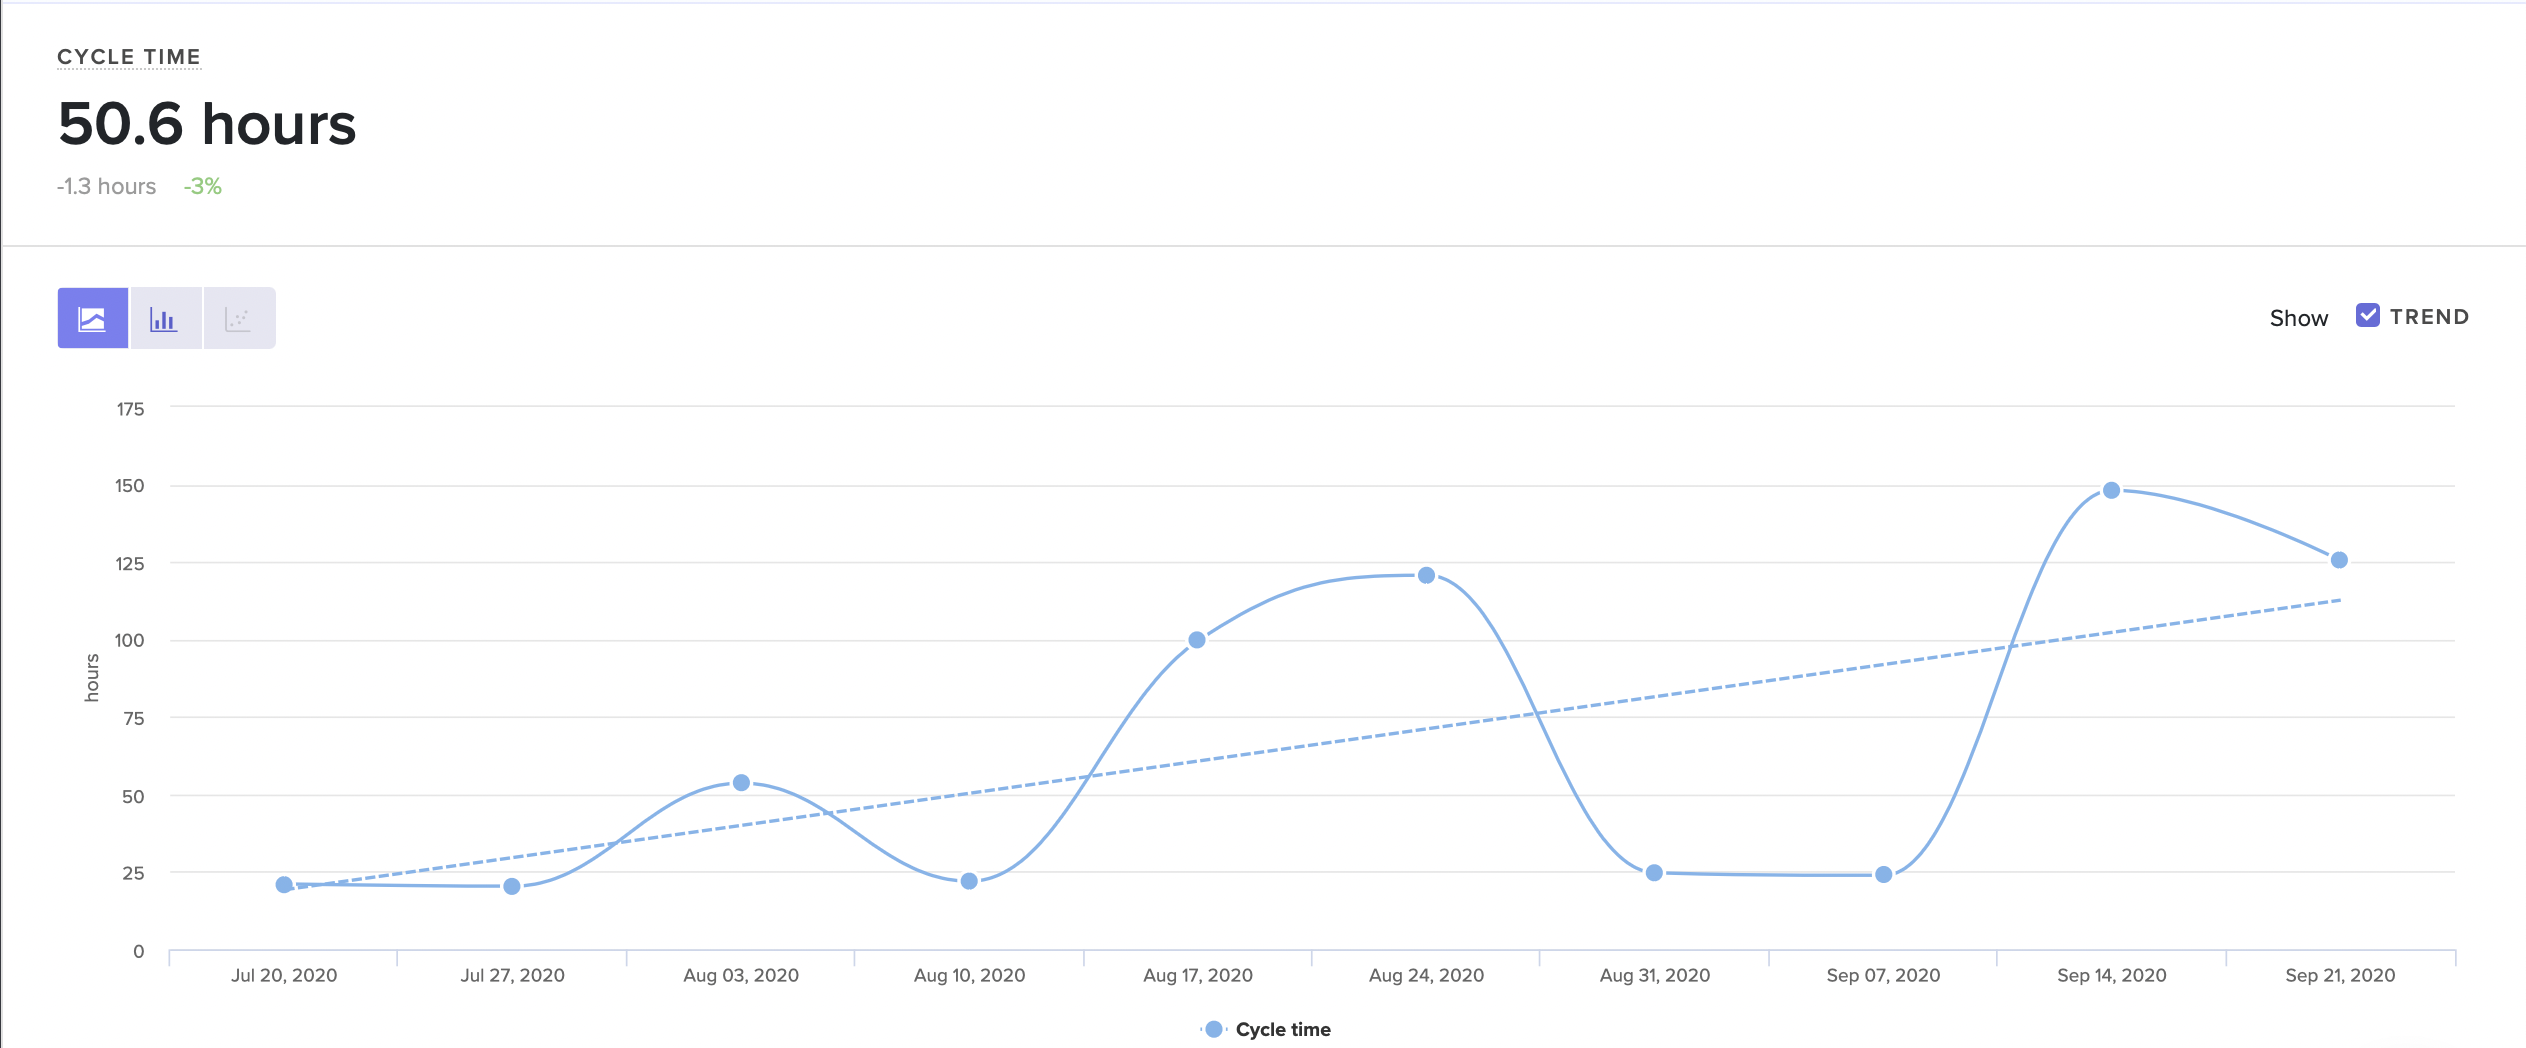
Visualize trends in the way your team is working.
La Haus started using Code Climate's solution to investigate a general feeling that their newly-remote engineering team was moving slowly. As Co-Founder and CTO Santiago García explains, “you can’t make decisions with a feeling.” You can, however, guide decisions with concrete data. García was able to leverage Code Climate to identify exactly which metrics were trending in the wrong direction, design improved processes to address those concerns, and then measure their success. Improving inefficient processes more than doubled the team’s engineering speed, and La Haus’s engineers were able to cut their Cycle Time from 72 to 30 hours.
- Find opportunities for improvement upstream. Data allows you to measure and track the impact of small adjustments, some of which may have a big impact on overall productivity and efficiency. A team that’s struggling to keep code moving through Code Review could focus on refining their review process, but should first take a look at some key metrics earlier on in their pipeline. The true source of the bottleneck might not be the review process at all, but something else entirely.
Identify these impactful, early-process issues by looking at metrics like Time to Open and PR Size. Time to Open can help you spot developers who are taking a long time to open a PR, which could be a sign of anything from unclear technical direction, to a lack of time to work in the codebase. A large PR Size may signal a tendency to open large Pull Requests, which can get stuck in even the most efficient development workflow.
- Identify and scale effective processes. Data can make it easier to spot high-performing teams in your organization and determine the reasons for their success. If you look at key metrics for specific parts of the development pipeline, you’ll be able to see where your best teams are at their strongest. From there, you can borrow their most effective practices and adapt them for other engineering teams, making it possible for your teams to learn from each other and contribute to the success of the entire department.
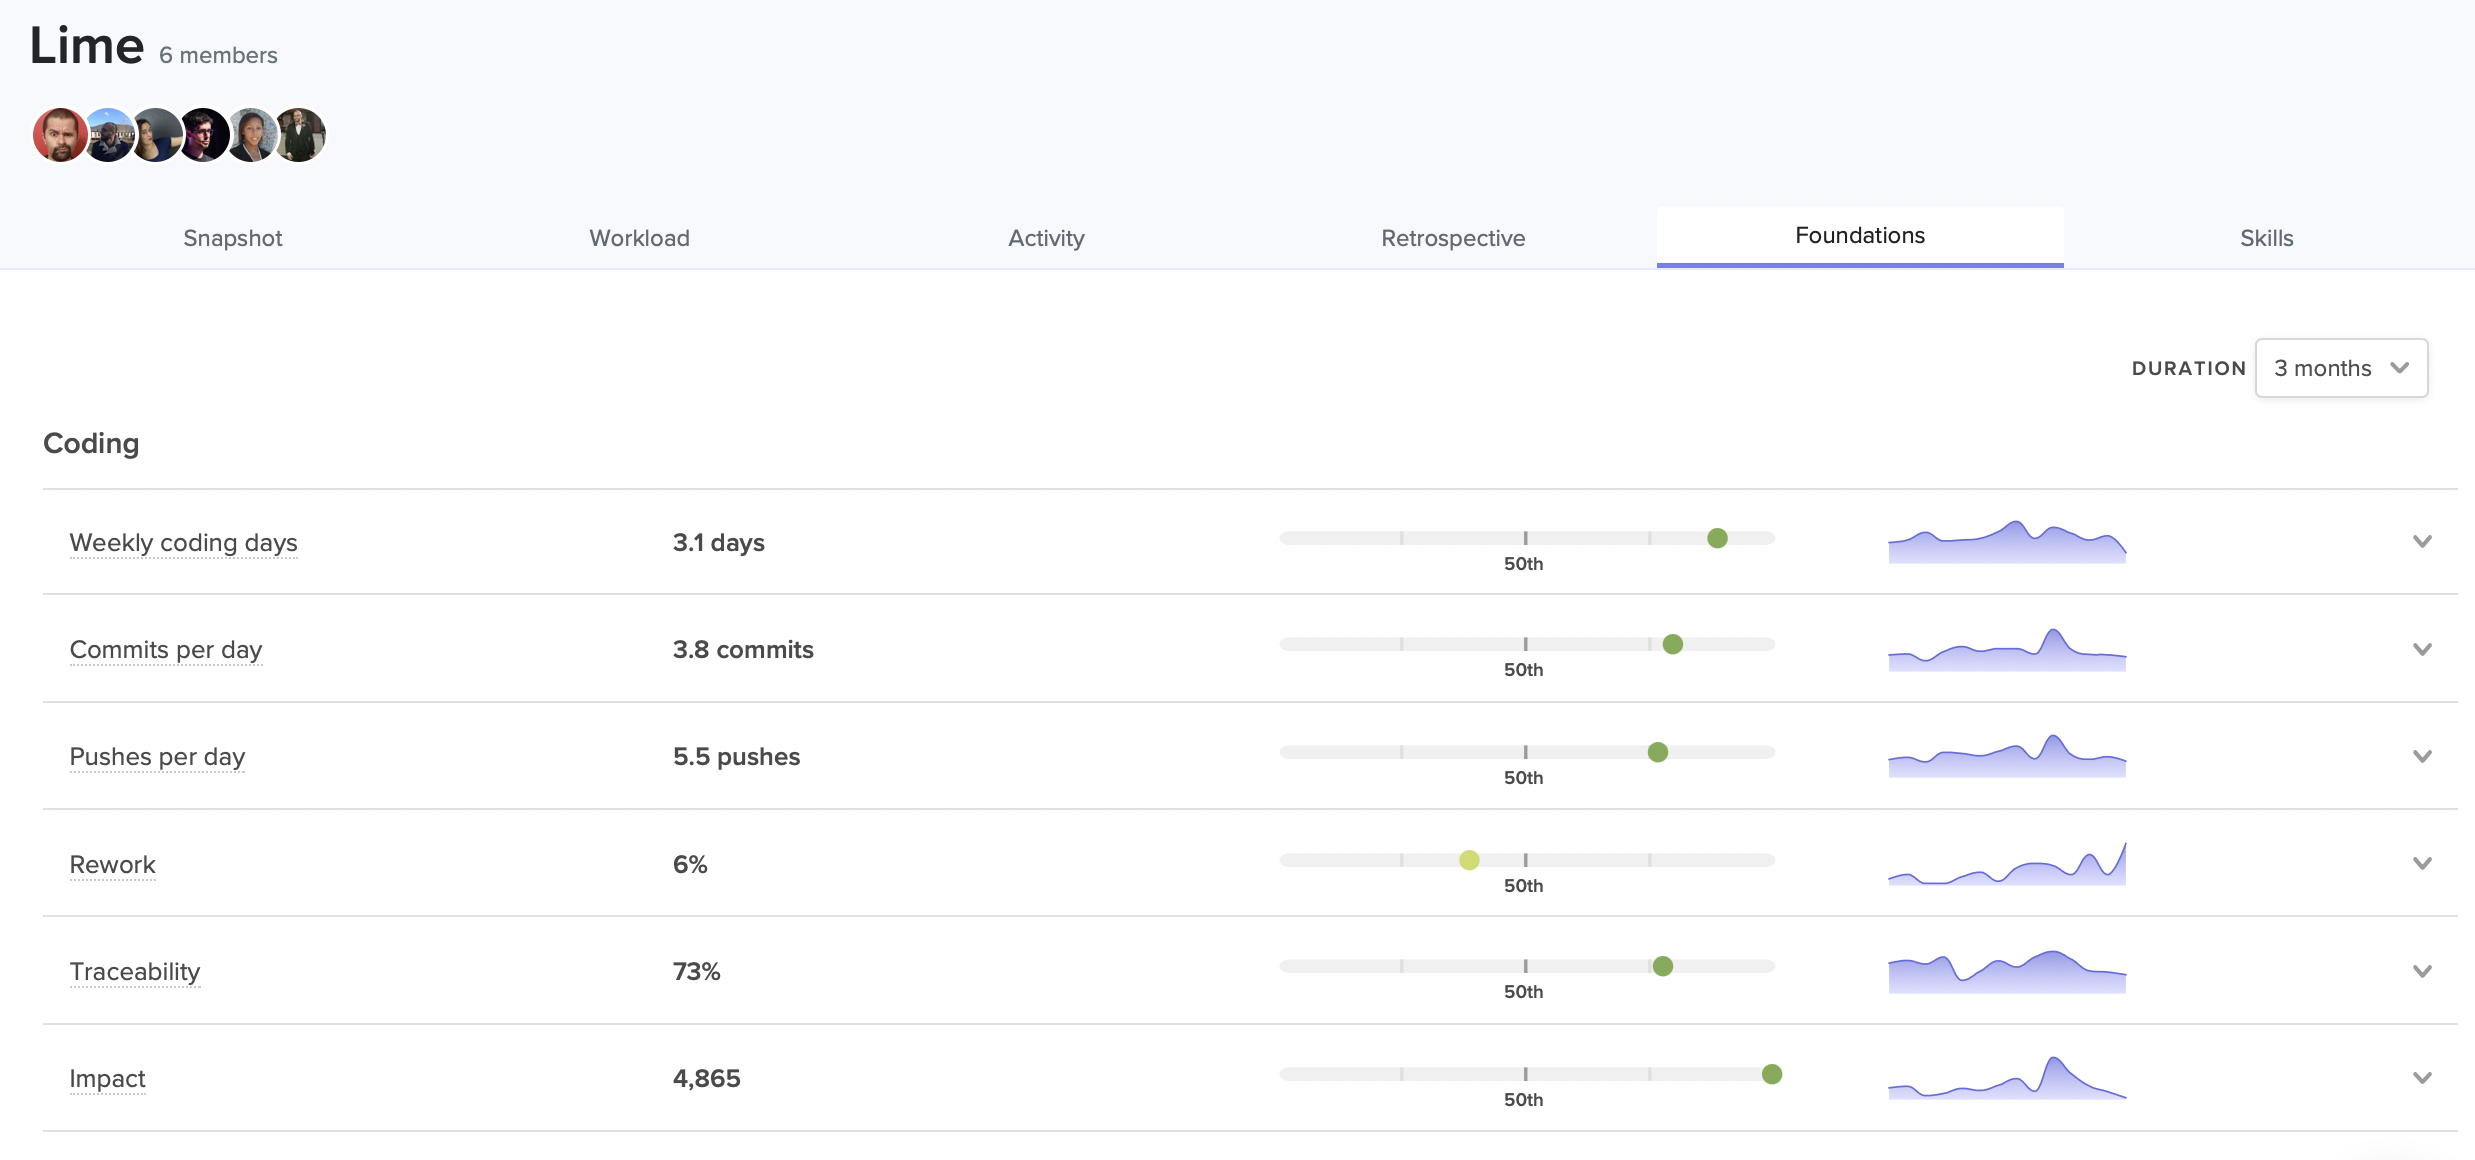
See where each team excels in relation to the rest of your organization.
Roger Deetz used this strategy successfully at Springbuk. When he joined the company as VP of Engineering, he used Code Climate's solution to identify and replicate the practices of the most effective teams, ultimately boosting PR throughput by 64%. “Measurement helped us find focus. We saw what agile practices were working and shared them across teams.”
- Help individual engineers get unstuck. Data enables a granularity and immediacy that isn’t possible through stand ups and sporadic check-ins. With the proper tools, you can quickly surface at-risk work and step in with the appropriate support before it becomes a true bottleneck. For example, with Code Climate's solution you can spot a developer who is churning, or one with a long-running PR, and help them get moving again, perhaps by clearing up a confusion with the codebase, or removing a roadblock caused by a third party.
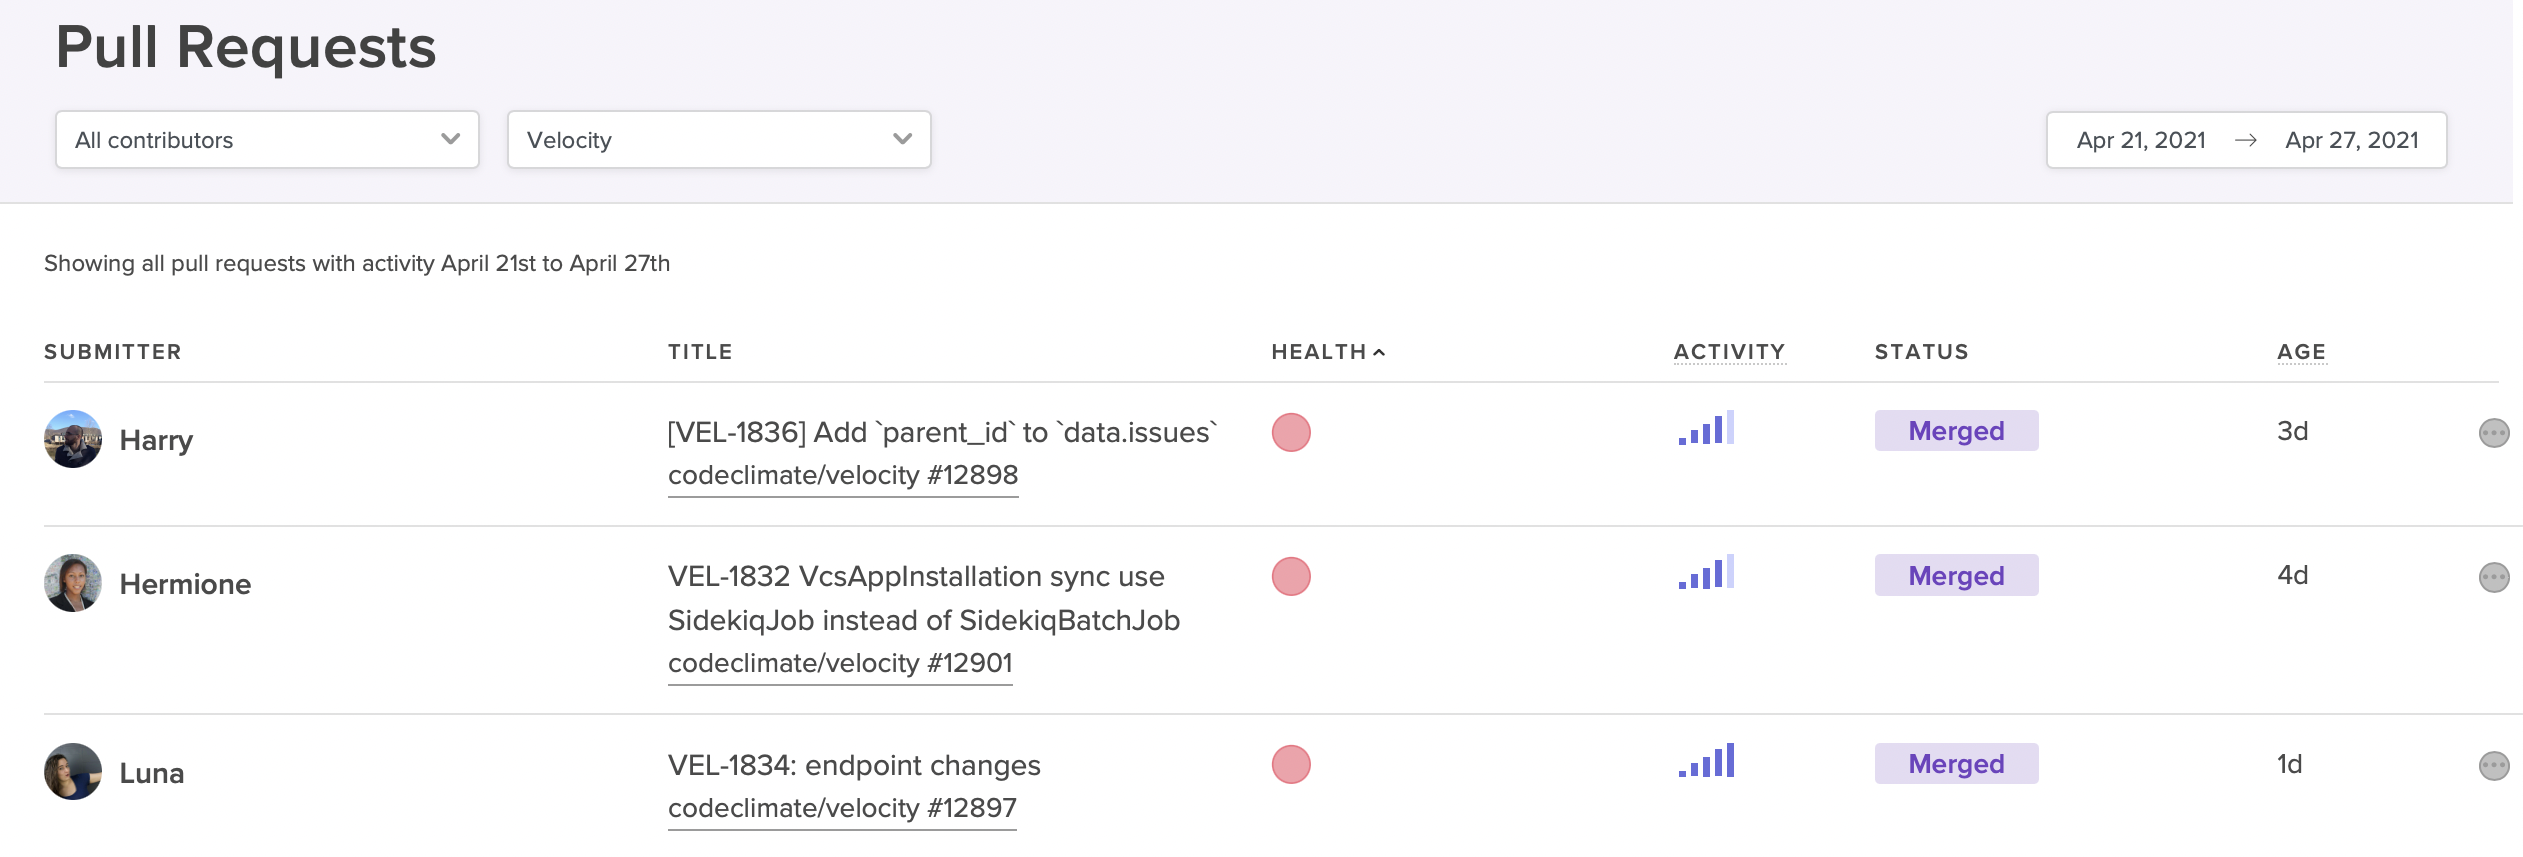
View at-risk PRs that might derail your sprint.
Prioritize Unblocking Engineers With A Dedicated Team
Product features and fixes tend to get prioritized over the critical work of improving developer productivity and experience. In order to ensure that a department is making the necessary investment in removing bottlenecks and improving overall efficiency, many leaders, especially those in large organizations, will give the responsibility to a designated team or individual. The exact title or team name may vary — “developer experience team” is common — but the mandate is usually to help improve developer experience (and, as a result, improve developer productivity) by solving problems that frustrate developers and slow down development. This can be anything from standardizing tooling to implementing code review best practices to improving new developer onboarding, and it includes the very important work of helping teams identify and dismantle common bottlenecks.
Remove Blockers By Empowering Developers
Whether or not they have a team or individual responsible for developer experience, the most successful engineering leaders will still ensure that all team members have some involvement in the process of spotting and removing bottlenecks. At the most basic level, you’ll need to involve your team members to contextualize quantitative information. Data is not diagnostic, and though it can point you in the right direction, it’s impossible to know exactly what is happening without talking to your team members.
Your team members will be even more invested if given the opportunity to propose process improvements and take some ownership of their implementation. This collaborative approach ensures that developers understand why certain changes are being made, that they’re on board with new processes from the start, and that they have a vested interest in sticking with them.
As teams work together to remove blockers and optimize processes, each improvement will motivate further improvements. You’ll set a critical engineering flywheel in motion, setting off the Virtuous Circle of Software Delivery, in which developers reap the benefits of improved processes and are motivated to keep seeking opportunities for continued growth and success.
With fewer blockers standing in their way, developers will be happier, more productive, and more likely to excel — and you’ll be one step closer to building a high-performance team.
To find out how Code Climate can provide the data you need to remove bottlenecks from your engineering pipeline, request a consultation.