Company Updates

Today we’re proud to announce that we’re bringing Code Climate Quality more in line with how many of you work — you can now see how each change affects the quality and security of your code before it’s merged into main. You no longer have to wait until a security vulnerability is in main before eradicating it from your code base. If you use feature branches, you can ensure the quality is up to your team’s standards before merging. When reviewing a refactoring, you can easily visualize the impact to the codebase on a single page.
In short, you can merge with confidence. Create a Code Climate account start getting analysis of your Pull Requests right now.
There are three new, key features that work together to make this possible:
- GitHub Pull Request integration
- Compare view
- Branch analysis
Let’s look at each of them.
GitHub Pull Request integration
We’re happy to announce that Code Climate will automatically analyze your GitHub Pull Requests. Simply open a Pull Request and Code Climate will inform GitHub when our analysis is ready for you (if you’ve used or seen Travis CI’s build status on GitHub, we use the same exact mechanism):
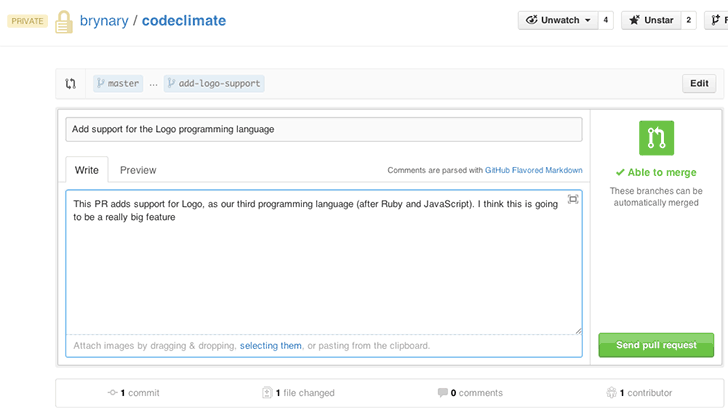
Branch testing and Pull Request support is included in all our currently offered plans at the Team level and above. We’ll be rolling this feature out incrementally over the next few days, and we will let you know when it’s activated for your account.
Note: Due to some technical considerations around analyzing cross-repo PRs, supporting Pull Requests for our free-for-OSS repos will take some extra time but is high on our list.
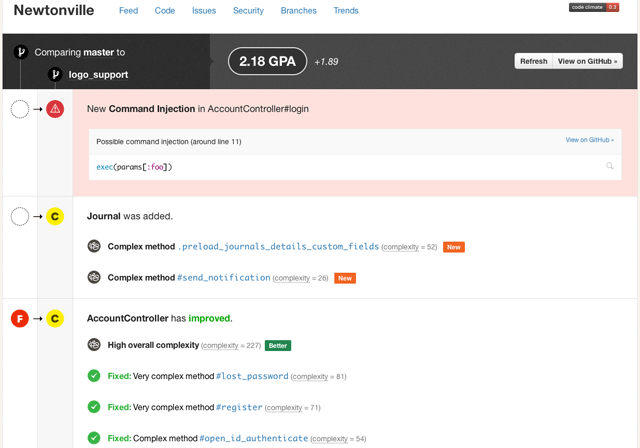
Compare view
Once we’ve finished analyzing your pull request/branch, you’ll be able to see the results in our new Compare view. It’s a focused representation of the important changes in your branch. You’ll see the overall change to your repo’s GPA, how your classes or files grades have changed and where code smells have been fixed, introduced or gotten worse:
Branch analysis
Even if you don’t use GitHub Pull Requests, you can start getting feedback on your branches immediately. Start by clicking on the new “Branches” tab for each of your repositories:
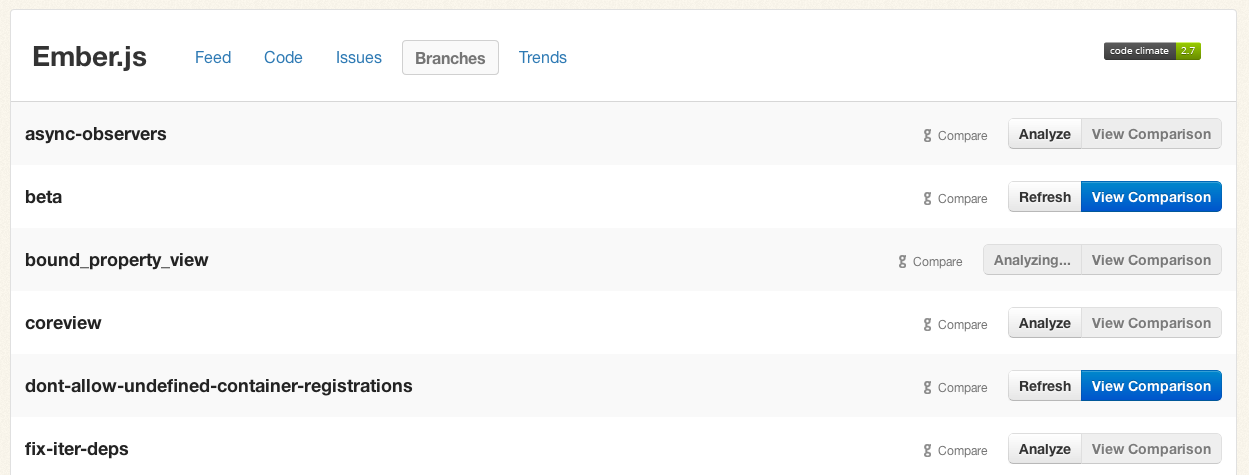
Push the “Analyze” button for any branches you care about, briefly sit tight, and within a few minutes the “View Comparison” button will be available to send you to a Compare view.
First-class Pull Request support has been our most requested feature over the last year, and we’re thrilled to be delivering it to you. We’ve been using these new features while we’ve been building them (I know, very meta) and we’re really enjoying the quicker feedback loop.
We hope you enjoy it as much as we have. We’d love to hear what you think!

Today we’re thrilled to announce that Code Climate is taking a giant step forward and launching support for JavaScript. Writing maintainable, bug-free JavaScript presents all of the challenges (and then some) of writing high quality Ruby, and now you can take advantage of Code Climate’s automated code reviews for your client-side JS and Node.js projects.
Code Climate launched out of the Ruby community, with the goal of helping developers ship quality code faster, regardless of the language they are using. With advances to client-side programming (Ember.js, Backbone, etc.) and the fast growth of Node.js on the server-side, now more than ever JavaScript is used to express critical business logic. That code needs to be free from defects, and it needs to be maintainable over the long term. As a first class language in a developer’s modern toolkit, JavaScript should have the tooling to match.
Create a Code Climate account and add your first JavaScript project today.
What does it do?
JavaScript projects on Code Climate benefit from the extensive work we’ve done over the past few years to make a tool that provides the most actionable, timely feedback on code changes including:
- Simple A-F letter ratings for every JavaScript file
- An overall project GPA to track code improvements over time
- Email, chat integration and activity feeds for timely notifications
- Integration with issue trackers like GitHub Issues and Pivotal Tracker
In addition, because code linting is often important to ensure consistent, predictable execution of JavaScript across browsers, we’ve built in configurable JSHint checks. Here’s an example from Node.js:
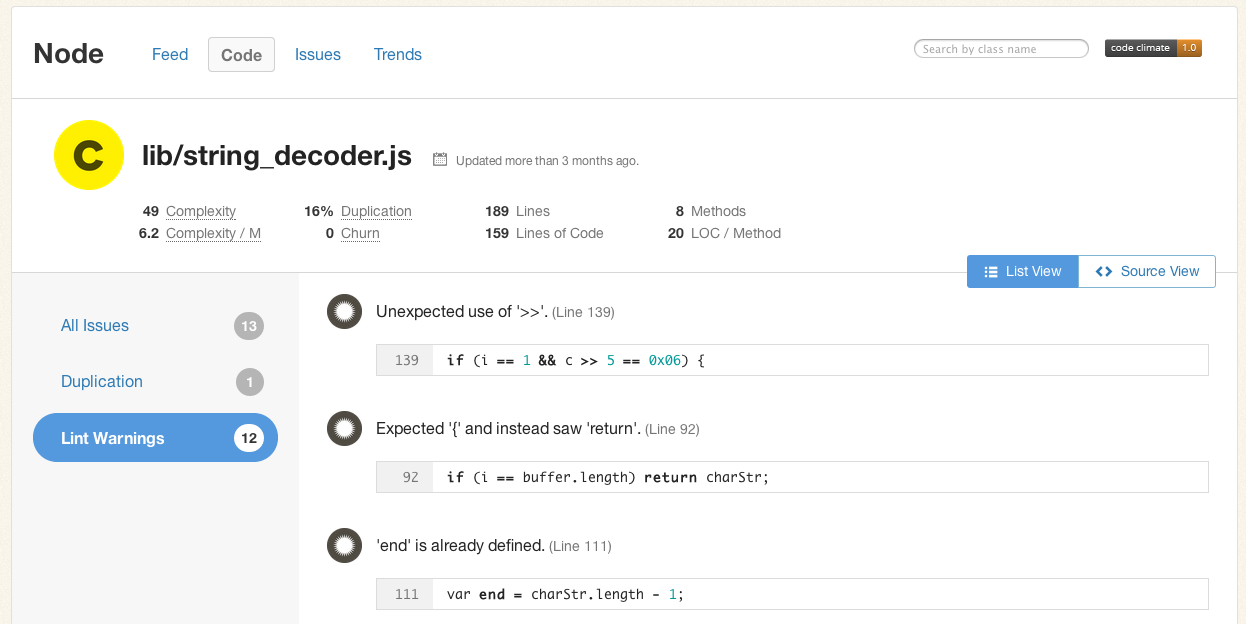
(JSHint is configured by checking in a .jshintrc file into your repository. If you already have one, we’ll use it automatically.)
How do I use it?
To add private projects to Code Climate, you’ll first need to create an account. As of today, new repositories added to your Code Climate dashboard will have a dropdown menu to choose which language you would like us to analyze:
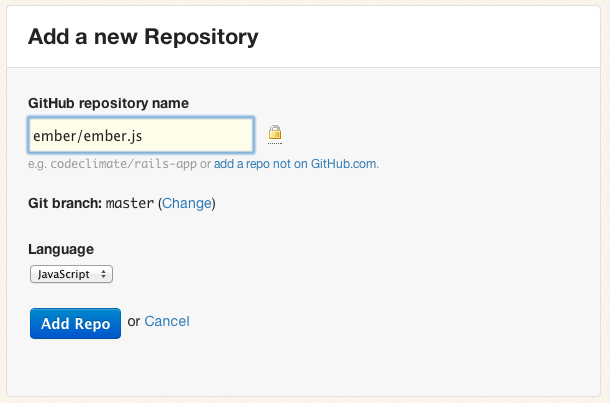
Note: Right now we are able to support one language per repository, but this is something that we will be improving in the future. As many Rails projects leverage JavaScript extensively, we want you to be able to see the effects of all of the changes to your codebase on each commit, and we are working to make that easier.
As always, Code Climate is free for open-source projects on GitHub. Add your OSS JavaScript projects today.

Ruby has a rich ecosystem of code metrics tools, readily available and easy to run on your codebase. Though generating the metrics is simple, interpreting them is complex. This article looks at some Ruby metrics, how they are calculated, what they mean and (most importantly) what to do about them, if anything.
Code metrics fall into two tags: static analysis and dynamic analysis. Static analysis is performed without executing the code (or tests). Dynamic analysis, on the other hand, requires executing the code being measured. Test coverage is a form of dynamic analysis because it requires running the test suite. We’ll look at both types of metrics.
By the way, if you’d rather not worry about the nitty-gritty details of the individual code metrics below, give Code Climate a try. We’ve selected the most important metrics to care about and did all the hard work to get you actionable data about your project within minutes.
Lines of Code
One of the oldest and most rudimentary forms of static analysis is lines of code (LOC). This is most commonly defined as the count of non-blank, non-comment lines of source code. LOC can be looked at on a file-by-file basis or aggregated by module, architecture layer (e.g. the models in an MVC app) or by production code vs. test code.
Rails provides LOC metrics broken down my MVC layer and production code vs. tests via the rake stats command. The output looks something like this:

Lines of code alone can’t tell you much, but it’s usually considered in two ways: overall codebase size and test-to-code ratio. Large, monolithic apps will naturally have higher LOC. Test-to-code ratio can give a programmer a crude sense of the testing practices that have been applied.
Because they are so high level and abstract, don’t work on “addressing” LOC-based metrics directly. Instead, just focus on improvements to maintainability (e.g. decomposing an app into services when appropriate, applying TDD) and it will eventually show up in the metrics.
Complexity
Broadly defined, “complexity” metrics take many forms:
- Cyclomatic complexity — Also known as McCabe’s complexity, after its inventor Thomas McCabe, cyclomatic complexity is a count of the linearly independent paths through source code. While his original paper contains a lot of graph-theory analysis, McCabe noted that cyclomatic complexity “is designed to conform to our intuitive notion of complexity”.
- The ABC metric — Aggregates the number of assignments, branches and conditionals in a unit of code. The branches portion of an ABC score is very similar to cyclomatic complexity. The metric was designed to be language and style agnostic, which means you could theoretically compare the ABC scores of very different codebases (one in Java and one in Ruby for example).
- Ruby’s Flog scores — Perhaps the most popular way to describe the complexity of Ruby code. While Flog incorporates ABC analysis, it is, unlike the ABC metric, opinionated and language-specific. For example, Flog penalizes hard-to-understand Ruby constructs like meta-programming.
For my money, Flog scores seem to do the best job of being a proxy for how easy or difficult a block of Ruby code is to understand. Let’s take a look at how it’s computed for a simple method, based on an example from the Flog website:
def blah         # 11.2 total =
  a = eval "1+1" # 1.2 (a=) + 6.0 (eval) +

  if a == 2      # 1.2 (if) + 1.2 (==) + 0.4 (fixnum) +
    puts "yay"   # 1.2 (puts)
  end
end
To use Flog on your own code, first install it:
$ gem install flog
Then you can Flog individual files or whole directories. By default, Flog scores are broken out by method, but you can get per-class total by running it with the -goption (group by class):
$ flog app/models/user.rb
$ flog -g app/controllers
All of this raises a question: What’s a good Flog score? It’s subjective, of course, but Jake Scruggs, one of the original authors of Metric-Fu, suggested that scores above 20 indicate the method may need refactoring, and above 60 is dangerous. Similarly, Code Climate will flag methods with scores above 25, and considers anything above 60 “very complex”. Fun fact: The highest Flog score ever seen on Code Climate for a single method is 11,354.
If you’d like to get a better sense for Flog scores, take a look at complex classes in some open source projects on Code Climate. Below, for example, is a pretty complex method inside an open source project:
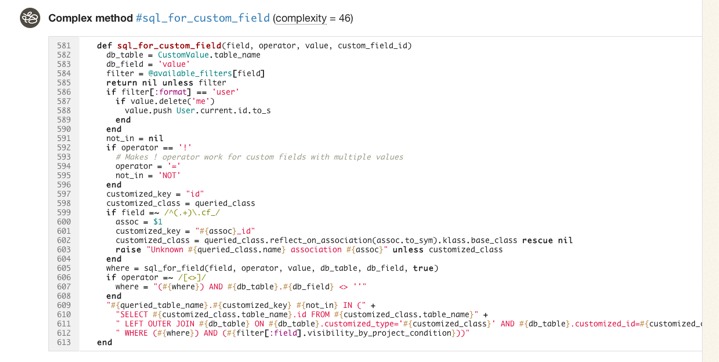
Like most code smells, high complexity is a pointer to a deeper problem rather than a problem in-and-of itself. Tread carefully in your refactorings. Often the simplest solutions (e.g. applying Extract Method) are not the best and rethinking your domain model is required, and sometimes may actually make things worse.
Duplication
Static analysis can also identify identical and similar code, which usually results from copying and pasting. In Ruby, Flay is the most popular tool for duplication detection. It hunts for large, identical syntax trees and also uses fuzzy matching to detect code which differs only by the specific identifiers and constants used.
Let’s take a look at an example of two similar, but not-quite-identical Ruby snippets:
###### From app/models/tickets/lighthouse.rb:
def build_request(path, body)
  Post.new(path).tap do |req|
    req["X-LighthouseToken"] = @token
    req.body = body
  end
end

####### From app/models/tickets/pivotal_tracker.rb:
def build_request(path, body)
  Post.new(path).tap do |req|
    req["X-TrackerToken"] = @token
    req.body = body
  end
end
The s-expressions produced by RubyParser for these methods are nearly identical, sans the string literal for the token header name, so Flay reports these as:
1) Similar code found in :defn (mass = 78)
  ./app/models/tickets/lighthouse.rb:25
  ./app/models/tickets/pivotal_tracker.rb:25
Running Flay against your project is simple:
$ gem install flay
$ flay path/to/rails_app
Some duplications reported by Flay should not be addressed. Identical code is generally worse than similar code, of course, but you also have to consider the context. Remember, the real definition of the Don’t Repeat Yourself (DRY) principle is:
Every piece of knowledge must have a single, unambiguous, authoritative representation within a system.
And not:
Don’t type the same characters into the keyboard multiple times.
Simple Rails controllers that follow the REST convention will be similar and show up in Flay reports, but they’re better left damp than introducing a harder-to-understand meta-programmed base class to remove duplication. Remember, code that is too DRY can become chafe, and that’s uncomfortable for everyone.
Test Coverage
One of the most popular code metrics is test coverage. Because it requires running the test suite, it’s actually dynamic analysis rather than static analysis. Coverage is often expressed as a percentage, as in: “The test coverage for our Rails app is 83%.”
Test coverage metrics come in three flavors:
- C0 coverage — The percentage of lines of code that have been executed.
- C1 coverage — The percentage of branches that have been followed at least once.
- C2 coverage — The percentage of unique paths through the source code that have been followed.
C0 coverage is by far the most commonly used metric in Ruby. Low test coverage can tell you that your code in untested, but a high test coverage metric doesn’t guarantee that your tests are thorough. For example, you could theoretically achieve 100% C0 coverage with a single test with no assertions.
To calculate the test coverage for your Ruby 1.9 app, use SimpleCov. It takes a couple steps to setup, but they have solid documentation so I won’t repeat them here.
So what’s a good test coverage percentage? It’s been hotly debated. Some, like Robert Martin, argue that 100% test coverage is a natural side effect of proper development practices, and therefore a bare minimum indicator of quality. DHH put forth an opposing view likening code coverage to security theater and expressly discouraged aiming for 100% code coverage.
Ultimately you need to use your judgement to make a decision that’s right for your team. Different projects with different developers might have different optimal test coverage levels throughout their evolution (even if they are not looking at the metric at all). Tune your sensors to detect pain from under-testing or over-testing and adjust your practices based on pain you’re experiencing.
Suppose that you find yourself with low coverage and are feeling pain as a result. Maybe deploys are breaking the production website every so often. What should you do then? Whole books have been written on this subject, but there are a few tips I’d suggest as a starting point:
- Test drive new code.
- Don’t backfill unit tests onto non-TDD’ed code. You lose out on the primary benefits of TDD: design assistance. Worse, you can easily end up cementing a poor object design in place.
- Start with high level tests (e.g. acceptance tests) to provide confidence the system as a whole doesn’t break as you refactor its guts.
- Write failing tests for bugs before fixing them to protect agains regressions. Never fix the same bug twice.
Churn
Churn looks at your source code from a different dimension: the change of your source files over time. I like to express it as a count of the number of times a class has been modified in your version control history. For example: “The User class has a churn of 173.”
By itself, Churn can’t tell you much, but it’s powerful if you mix it with another metric like complexity. Turbulence is a Gem that does just that for Ruby projects. It’s quite easy to use:
$ gem install turbulence
$ cd path/to/rails_app && bule
This will spit out a nice report in turbulence/turbulence.html. Here’s an example:
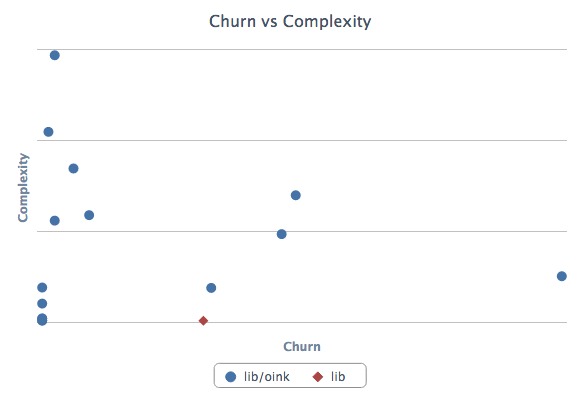
Depending on its complexity and churn, classes fall into one of four quadrants:
- Upper-right — Classes with high complexity and high churn. These are good top priorities for refactoring because their maintainability issues are impacting the developers on a regular basis.
- Upper-left — Classes with high complexity and low churn. An adapter to hook into a complex third-party system may end up here. It’s complicated, but if no one has to work on (or debug) that code, it’s probably worth leaving as-is for now.
- Lower-left — Classes with low churn and low complexity. The best type of classes to have. Most of your code should be in this quadrant.
- Lower-right — Classes with low complexity and high churn. Configuration definitions are a prototypical example. Done right, there’s not much to refactor here at all.
Wrapping Up
Ruby is blessed with a rich ecosystem of code metrics tools, and the gems we looked at today just scratch the surface. Generally, the tools are easy to get started with, so it’s worth trying them out and getting a feel for how they match up (or don’t) with your sense of code quality. Use the metrics that prove meaningful to you.
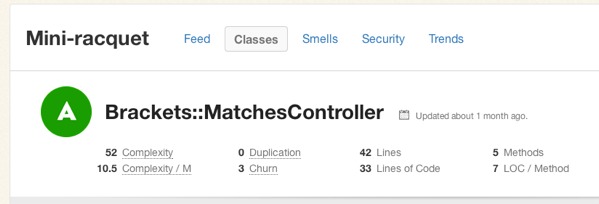
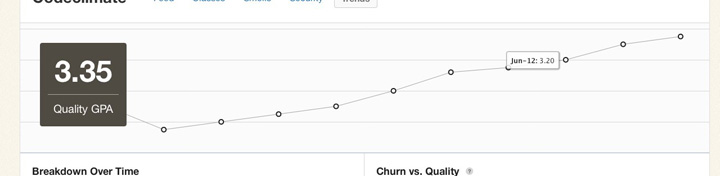
Keep in mind that while these metrics contains a treasure trove of information, they represent only a moment in time. They can tell you where you stand, but less about how you got there and where you’re going. Part of the reason why I built Code Climate is to address this shortcoming. Code Climate allows you to track progress in a meaningful way, raising visibility within your team:
If you’d like to try out code quality metrics on your project quickly and easily, give Code Climate a try. There’s a free two week trial, and I’d love to hear your feedback on how it affects your development process.
There’s a lot our code can tell us about the software development work we are doing. There will always be the need for our own judgement as to how our systems should be constructed, and where risky areas reside, but I hope I’ve shown you how metrics can be a great start to the conversation.

Today we’re very excited to publicly launch our new Security Monitor feature! It’s our next step in bringing you clear, timely and actionable information from your codebase.
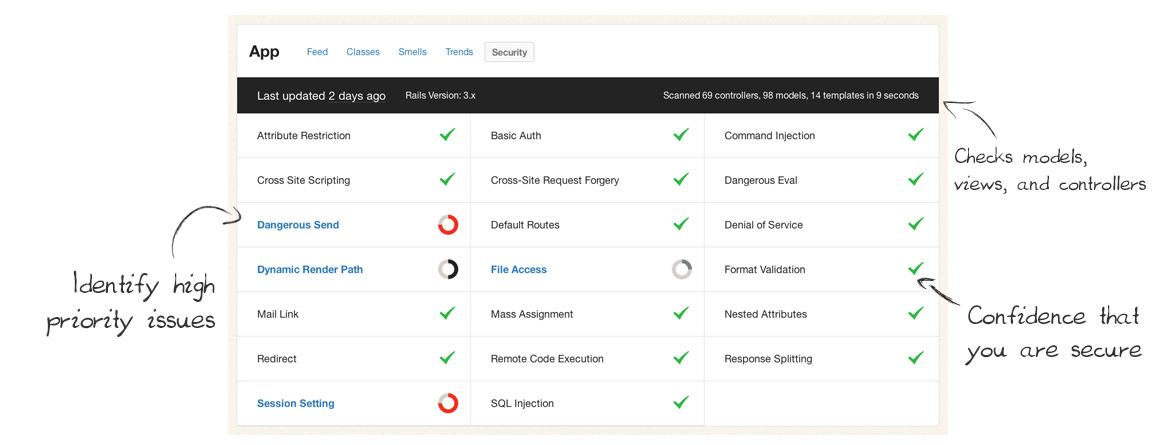
Security Monitor regularly scans your Rails apps and lets your team know as soon as new potential vulnerabilities are found. It keeps your app and data safe by catching common security issues code before they reach production.
Some large organizations employ security specialists to review every commit before they go live, but many teams can’t afford that cost and the slowdown on their release cycles. Security Monitor gives you a second set of eyes on every commit – eyes that are well trained to spot common Rails security issues – but much faster and at a fraction of the cost.
(We love security experts, we just think their time is better spent on the hard security problems rather than common, easily detectible issues.)
Code Climate keeps getting better
We’ve been astonished and humbled by the growth of Code Climate over the past year. What began as a simple project to make static analysis easy for Ruby projects has grown into much more than that. The praise has been overwhelming:
“I’ve only been using Code Climate for about 10 minutes and it’s already become one of the most useful tools we have access to.” —Ryan Kee
Every day we work to make the product even better for our customers. Since we’ve launched, we’ve added things like:
- Easy-to-understand A-F ratings for each class and Quality GPAs
- Class Compare view for identifying exactly what changed
- Quality alerts and totally new weekly summary emails
- Trends charts and churn metrics
- GitHub, Pivotal Tracker, and Lighthouse integration
Now that Security Monitor is out the door, the next big feature we are working on is Branch Testing. Soon, you’ll be able to easily see the quality changes and new security risks of every feature branch and pull request before they get merged into master.
Changes to our pricing
Our current plans have been in place for over a year, and the product has changed tremendously in that time. We believe (and we’ve been told many times) that Code Climate is much more valuable today than it was when started.
Additionally, Security Monitor has proven to be incredibly valuable to teams looking for help trying to catch risky code before it makes its way into production. We wouldn’t be able to offer it on all plans, so we’re making some changes.
Today we’re rolling out new plans for private accounts:

I’d like to address some common questions…
I’m a current customer. How does this affect me?
We love you. Your support was key to getting Code Climate to this point. The plan you’re currently on isn’t changing at all, and won’t for at least two years.
Also, we think if you’re running Rails in a commercial capacity you’d strongly benefit from upgrading to our Team plan, which has the Security Monitor feature we talked about above.
To make that a no-brainer decision for you, we’ll comp you $25 a month for the next two years if you upgrade to a Team, Company or Enterprise plan before April 2nd. Look for an email with a link to upgrade arriving today (Tuesday, March 19th).
Also, big new features like Branch/Pull Request Testing will only be available on the new plans, upgrade now to avoid missing out on this big, one-time discount.
I’m on the fence about Code Climate. What should I do?
To make it easy for you to get off the fence, we’re extending a discount of $25/month for the next two years ($600 value) if you start a free trial before April 2nd. Now is the best time to start a free trial and lock in that discount.
Why charge per user?
Ultimately, it is best for you guys, our customers, if our pricing creates a vibrant, sustainable company that can be here for the long haul and improving Code Climate so that it continues to create massive value for your businesses.
Within that overarching goal, we’d like our pricing to scale with customer success: we’d like entry-level users to be able to get started without sacrificing too much ramen and for extraordinarily successful software companies to pay appropriately given the value Code Climate creates for them.
It turns out that per-repository pricing doesn’t necessarily proxy customer success all that well: Google, for example, is rumored to have a grand total of one Perforce repository. Many smaller teams (like the good folks at Travis CI) have dozens, given that Git encourages a one-repo-per-project workflow. To more appropriately balance prices between small teams and the Google’s of the world (not technically a customer yet but hey, Larry, call me), we’re adding a per-user component to pricing.
This largely affects larger commercial enterprises which are used to per-seat licensing, have defined budgets for per-employee expenses (like healthcare, training, and equipment, next to which Code Climate is very reasonably priced), and can easily see the substantial business value created by lowering software maintenance costs, keeping projects on track, and reducing security risk.
It also lets us invest substantially in development operations to support new features like Security Monitor which are most critically needed by larger teams, while keeping the basic Code Climate offering available and reasonably priced for all teams and 100% free for open source projects.
I’m a student or non-profit. Can you help?
Yes. We now offer educational and non-profit discounts to qualifying people and organizations. We’re interested in supporting you.

Code Climate hit an exciting milestone last week: in the seven months since we launched our free OSS service we’ve added 5,000 Ruby projects. Code Climate is built on open source software, so we’re especially thrilled for the service to be adopted by the community.
We’re also incredibly grateful to our hosting partners Blue Box whose support makes it possible to provide this service free for OSS! Blue Box has provided us great uptime, dependable monitoring and support, and help planning for our continued growth. I definitely encourage everyone to check them out. Thanks guys!
Code quality can be especially important for OSS because there are many contributors involved. We try to make it easy to monitor overall quality by providing projects with a “Quality GPA” calculated by aggregating the ratings for each class, weighted by lines of code, into an average from 0 to 4.0.
Fun fact: The average open source project on Code Climate has a GPA of 3.6 – which we thinks speaks volumes about the culture of quality in the Ruby open source community. Andy Lindeman, project lead for rspec-rails, explained:
Code Climate helps keep both the core team and contributors accountable since we display the GPA badge at the top of the READMEs. The GPA is useful in finding pieces of code that would benefit from a refactor or redesign, and the feed of changes (especially when things “have gotten worse”) is useful to nip small problems before they become big problems.
Erik Michaels-Ober also uses Code Climate for his many RubyGems and noted, “I spent one day refactoring the Twitter gem with Code Climate and it dramatically reduced the complexity and duplication in the codebase. If you maintain an open source project, there’s no excuse not to use it.”
Curious about your project’s GPA? Just provide the name of the repo on the Add GitHub Repository page. Code Climate will clone the project, analyze it, and shoot you an email when the metrics are ready – all in a couple of minutes. Once you’ve added your project, you can show off your code’s GPA by adding a dynamic badge (designed by Oliver Lacan and part of his open source shields project) to your project’s README or site.
Here’s to the next 5,000 projects!

Today I’m excited to announce that Code Climate is free for open source projects. Many open source projects were added during the closed beta, and you can see them all on the new Explore page. (To learn more about what Code Climate provides and how it works, check out the homepage.)
This has been in the plans since the beginning and was one of the common requests since the launch for private accounts. It feels great to finally have it out the door. My hope is that Code Climate becomes as valuable a tool to Ruby open source development as Travis CI.
Code quality is especially important for OSS because of the large number of contributors they attract. Now quality metrics can complement a suite of automated tests to help ensure you’re shipping rock solid releases. Look out for more features around this coming soon.
Popular projects on Code Climate
You might be interested in taking a look at:
How to add repositories
To add any Ruby app or library that is hosted in a public GitHub repository, visit the Add GitHub Repository page. Just provide the name of the repo (e.g. thoughtbot/paperclip) and your email address. Code Climate will clone the project, analyze it, and shoot you an email when the metrics are ready. This only takes a few minutes.

GORUCO 2012, NYC’s premier Ruby conference, is around the corner and it’s going to be great. (I may be biased, as I help organize the conference, but it’s still true!) We have some fantastic speakers this year, and I’m especially looking forward to three talks that focus on different aspects of code quality:
- “Maintaining Balance while Reducing Duplication – Part 2” by David Chelimsky. This is a follow up to David’s excellent talk from RubyConf 2010 that explored the DRY Principle (Don’t Repeat Yourself) in depth and illustrated how it can be misapplied. The inherent tensions between different OO design principles is particularly interesting to me.
- “Sensible Testing” by Justin Leitgeb. Justin really impressed me with his lightning talk at a recent NYC.rb about Ruby mixins and their problems. With this talk, I think he’ll do a great job exploring testing strategies for Rails apps in a practical, nuanced way. I wouldn’t be surprised if the Testing Pyramid comes up, which more developers should take to heart. TATFT is great mnemonic, but applying it well over a large codebase and a long period of time requires a great deal of consideration.
- “Hexagonal Rails” by Matt Wynne. Alistair Cockburn has been talking about Hexagonal Architecture (which he now calls “Ports and Adapters”) for years as a way to structure applications for better maintainability. It’s always been enticing to me, but it’s never been clear how to apply it to a Rails application. Matt has started exploring just that on his blog and I’m thrilled he’ll be giving a full-length talk on it at GORUCO. Personally, I hope he covers the implications on the model layer at least as much as controllers/views, and perhaps how this architecture might relate to the Anemic Domain Model antipattern described by Martin Fowler. (If not, I’ll ask him during Q&A. Hah.)
And before you ask, yes, the good folks at Confreaks will be recording the talks and we hope to have them posted within a few weeks of the conference (if not sooner).
If you’re attending GORUCO this year, definitely stop me and say “Hello!” (Either during the day, or aboard the ::ahem:: yacht during the evening.)
Full disclosure: I had the honor of being a member of the GORUCO Program Committee this year that selected the speakers, so it may not be a complete coincidence that my interests are well represented. 🙂