Productivity

It’s a new year and that makes it a great time to tackle some high value development chores that get your team started on the right foot. Each of the 10 quick development tasks below can all be done in a few hours at most, and will immediately start paying dividends on your teams productivity.
1. Delete inactive branches and Pull Requests
We’ll start with an easy one. If your team is anything like ours, it creates branches and pull requests on a regular basis. The problem comes when they get abandoned or merged (perhaps via a rebase) and the branch and/or pull request gets left behind for all eternity. Code Climate Quality only has three people working on it, but we have over 100 branches and a dozen open PRs across our three main repositories – almost none of those need to be looked at ever again.
Get all the developers in a room and go through Git branches and open pull requests in alphabetical order. Give anyone a chance to claim any branch they want around, but terminate any unclaimed branches with extreme prejudice. You’ll be left with a lot less clutter in your repos and GitHub views.
Time required: 15 minutes as a team. If you hold a daily stand-up, do it immediately following.
2. Optimize your deploys
Deploys are like a mutex in your development pipeline and it pays to keep them as fast as possible. There’s no excuse for a deploy that takes longer than 30 seconds, and in many cases you can optimize them to be significantly faster than that without too much effort. The main Code Climate Rails app can usually be deployed in less than 5 seconds.
Often the culprit is simply doing a lot of unnecessary work (updating dependencies with NPM or Bundler, copying large directories, or precompiling assets) on every deploy. Making better use of Git (and its ability to know exactly what is changing on each deploy) can eliminate these extra steps except when they are needed yielding big performance wins.
in October we described the upgrades we made to our Capistrano-based deployment process. Give that post a read and apply the techniques to your own project. Everyone on your team will be happier – well, except for the fact that you’ll take away one of their legitimate excuses for slacking off.
Time required: Three hours.
3. Ratify a coding style guide
Your code has a style whether you define it or not, and chances are if you have more than one programmer on your team that your natural styles will differ in at least a few ways. Ideally, you wouldn’t be able to tell the difference (at least stylistically) between code written by any of your team members.
Rather than waging coding style war in diffs and GitHub comments, take some time as a development team to ratify a style guide for your organization. It doesn’t really matter what rules you choose, just that you all agree to follow them. The most important principle is:
Proposed changes to the team’s style guides will be litigated out-of-band.
This helps avoid the problem of developers wasting time reformatting code every time they start working in a new file or code reviews that devolve into style nit picking sessions. After you ratify your style guide, pick a date about a month in the future to review it as a team and discuss potential changes. You could even create a GitHub repository to store it, and discuss change proposals in pull requests.
There’s no need to start from scratch. Feel free to crib from other widely available style guides — for example, Airbnb’s JavaScript style guide might be a good starting point for you. GitHub itself also publishes their style guide, which has sections on Ruby, JavaScript and even the voice and tone to use on the site.
Time required: One hour as a team.
4. Curate a core test suite
Quick: How long do you have to wait for tests to run in order to give you 95% confidence that your latest code change is safe to ship to production? If it’s any longer than a few minutes, your team is paying a hefty tax each and every time they sit down at a keyboard.
Rigorously applying the principles of the testing pyramid will yield a fast test suite that still gives strong confidence the application is functioning as desired. What if your main test suite is already too slow? You’ve got a few options:
- Delete slow tests that aren’t pulling their weight. Remember, if a test’s value drops below the investment it takes to keep around and run, it has got to go.
- Segregate slow running tests into a separate suite. The goal is to reach 95% confidence within a few minutes of tests running. Often times teams end up with a bunch of slower tests they feel are important to get to 99% confidence, but a much smaller set of tests that cover core user flows can do a great job on their own. Running all tests every time is subject to diminishing returns.
- Replace high level tests with lower level tests. This is an ongoing approach to improve the situation over time, and can’t usually be done in one sitting. Still, if your suite is too slow continually keep an eye out for where a lower level (e.g. unit) test may be a better fit than an acceptance test.
Remember that even a few seconds shaved off your build will save you several developer-hours over the course of the year.
Time required: Up to four hours upfront.
5. Audit your app for vulnerabilities
It seemed like 2013 was a particularly rough year for security on the Web, with a string of high profile breaches as startups and established companies alike. Now is a great time to take a step back and look at your code and operations to ensure you’re taking the appropriate precautions to avoid become a victim.
Although common Web application security risks transcend development tools, the detection of vulnerabilities and appropriate remedies tends to be a framework and language specific. For Rails apps, we recommend running Brakeman, an open source vulnerability detection scanner based on static analysis, and bundler-audit. If you’ve never run tools like this against your code base, it’s very likely they’ll uncover at least one issue worth addressing, making it time well spent.
If you add your Rails repo to Code Climate Quality, Code Climate’s Security Monitor feature will notify your team when new security vulnerabilities are introduced.
If you know of tools for other programming languages that are helpful, please share them in the comments.
Time required: 15 minutes to run a scan.
6. Extract an open source project
Lots of us have a TODO on our list to extract some useful component of one of our applications and release it as an open source project. The turn of the calendar is a great time to take that opportunity.
Why open source code? There are lots of reasons. First, the act of extracting the code often tends to lead to cleanup and better definition of the boundaries, making the component more maintainable. Then, once the code is published, you may very well get contributions. For example, the short time since we released our codeclimate-test-reporter gem, we’ve already received a few valuable contributions in the form of pull requests. Those were features we had on our list, and we saved time because other generous individuals spent their time improving our code! Finally, open source is a great way to get your organization’s name out into the community, which certainly doesn’t hurt when it comes time to grow your team with hiring.
Often developers get hung up on the need for code being exemplary before they share it. While it’s understandable that no one wants to be represented by messy code, remember that the sooner you flip the OSS bit the sooner other people can start benefiting from your work and making contributions. Plenty of the important OSS projects you use every day are messy codebases, but I bet your are happier that they are available as-is.
In short, obey the squirrel!
Time required: Up to four hours.
7. Ditch your CI server
Developers in 2014 benefit from access to a wide range of services that strive to solve a variety of pain points that we used to have to roll up our sleeves and tackle on our own. Continuous integration (CI) is one of those pains, and it can be a big one.
Rather than operating your own CI server (like Jenkins), consider trying out a hosted alternative. They’ve advanced significantly over the past couple years and usually the time spent to make the switch is quickly paid back by not having to perform maintenance tasks like software updates and adding capacity on your own. Further, most of these tools have whole teams working every day to improve the continuous integration tooling. That’s just not something most dev shops can afford to do – at least until you’re Facebook-sized.
There are a lot of vendors competing in the CI space these days, but to give you some starting points, Code Climate has partnerships with Semaphore, Solano Labs (now part of GE Digital) and Travis CI.
Once you’re up and running, as a final step be sure to test intentionally breaking the build to ensure you are properly notified.
Time required: Two hours.
8. Clean up your READMEs
Good READMEs lay a foundation for getting developers up and running with a codebase. However, unless they are actively maintained, they start to drift away from the reality of the underlying project.
We like to begin our READMEs with a one sentence summary of the role of the codebase. Beyond that, we may include some additional context about how the code fits into the overall architecture, but we try to keep this brief. The meat of the README is comprised of install steps and any instructions necessary to execute the code. (Hopefully the install steps are few, as we try to automate as much as possible.)
Take a few minutes to glance at the READMEs of your most important codebases (or write them if they don’t exist or are empty). Most importantly, remove outdated information that could send your future teammates on a wild goose chase. No documentation is better than wrong documentation. But if you have the time while you’re in there, sync up the content of the README with the context in your head.
Protip: Whenever a new developer joins your team, have them follow the README instructions to get set up. Hopefully it should go smoothly, but should they run into any missing our outdated documentation, have them commit README updates before they move on.
Time required: 30 minutes.
9. Aggregate and index your logs
Here’s one that I’ve gone an embarrassingly long time in my development career without addressing. Searching through log files sucks. Searching through log files across three applications and eight servers leveraging all of the power of Terminal.app’s tabs functionality sucks even more. There’s no reason for this.
Today it’s simple to get up and running with log aggregation tools, either hosted (like Papertail or Loggly) or on-premise (with Logstash and Kibana. Both systems can be setup to accept log messages already flowing through rsyslog or, with a bit more configuration, being written to log files on disk.
Either way, once you’re done, you’ll have a single place for your developers and operations people to go to search logs for valuable clues when diagnosing issues. This is a lifesaver in emergencies. Once you’ve got a handle on the basics, you can play around with fancier techniques like using values emitted in log files to push data into a time series database like Librato Metrics and archiving old logs to S3 (because storage is cheap and who knows if you’ll need them).
Time required: Two hours.
10. Track the quality of your team’s code as you commit
Every day we see experienced, well meaning teams struggling to achieve their code maintainability goals. A big part of the problem is that you can’t tell whether your code is getting better or worse simply by pulling up your project in GitHub.
Developers these days leverage increasing visibility to tackle all sorts of thorny problems from failing tests to slow databases. Code Climate Quality lets you see how your code is changing from day-to-day in a way that’s clear, timely and actionable. Derek Hopper, from Ideal Project Group, writes about the impact Code Climate has had for them:
We’ve eliminated numerous code smells. We’ve properly extracted business logic which transformed F classes into A classes. We have better test coverage for the important pieces of our application. The application is more stable overall.
If you haven’t tried it yet, we offer a 14-day free trial and we’d be happy to talk with you about how you can get off on the right foot with Code Climate in 2014.
Time required: Less than 15 minutes to get the results.

David Byrne, in the seminal Talking Heads song “Once in a Lifetime,” sings, “How did I get here?” The meaning of those lyrics have been fodder for some great discussion, but I think there’s one interpretation which has been sorely missing from that discourse — that the narrator is a software developer. The software developer, reflecting back on his work, is wondering how he accumulated so much technical debt.
“Letting the days go by, let the water hold me down.”
The water which holds him down is an obvious reference to what can happen to a software developer over time, caught under the weight of their own codebase. But what Byrne is singing about here isn’t strictly technical debt. Technical debt is the outcome. He’s singing about something else, about “letting the days go by,” about letting your codebase slip away from you.
Byrne, although he did not know it at the time (after all, even the phrase technical debt hadn’t been invented yet) was singing about “technical drift”. Technical drift is a phenomenon that impacts a lot of well-meaning software development teams. It’s a phenomenon that occurs when a development team continuously fails to recognize and adapt to change, causing the concepts in the software’s domain and the concepts in code to start to slowly “drift” apart from one another, creating dissonance which ultimately leads to technical debt.
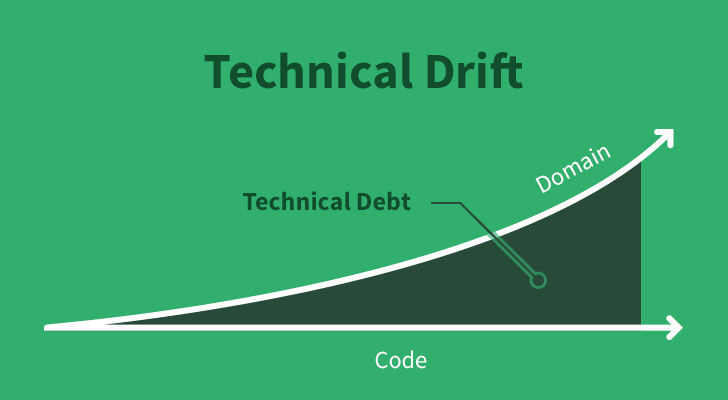
One of the goals of software development is to write software that most closely reflects the the domain in which we’re working. This creates more understandable code that is easy reason and discuss, both within the tech team and with the rest of the organization. But it’s important to remember that the domain is continually shifting. We’re receiving new requirements based on new information.
If we don’t adapt to these changes, a gap will appear between our domain and software, and the gap becomes our friend, technical debt.
While the signs of technical drift may be hard to spot, technical debt, the result, starts to become readily apparent.
In some cases, a software development team, or a team leader, recognizing that the gap has become too large, comes together and decides “enough is enough”. What is needed is Design —Big Design. The team stops feature development, buckles down, and refactors their code and architecture to more cleanly map to their domain.
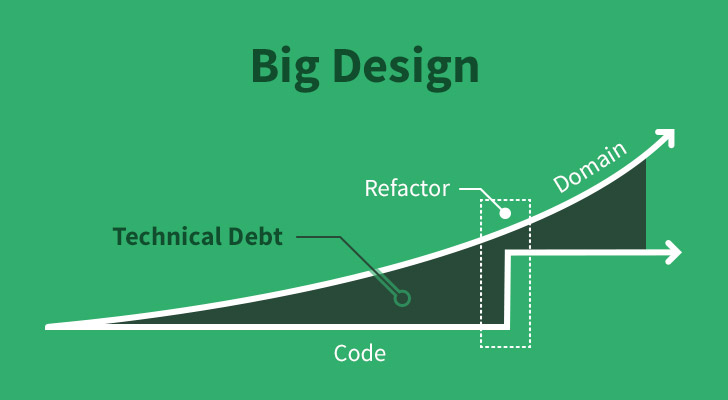
The problem with Big Design is that it’s a “stop the world” operation. Feature development stops, and an anxious queue begins to build up waiting for the development team to free up. Furthermore, it grants false hope that such a thing might not be necessary again, but if the pattern continues, it often becomes inevitable.
How do we prevent technical drift?
If you’re not taking an active role in refactoring your application every week chances are you’re experiencing “technical drift”. Having a problem space that is continually changing necessitates continuous reworking of how your application is designed — what Agile practitioners call “iterative design”. When you’re able to do this effectively, you can round off the peaks and avoid some of the pitfalls of Big Design.
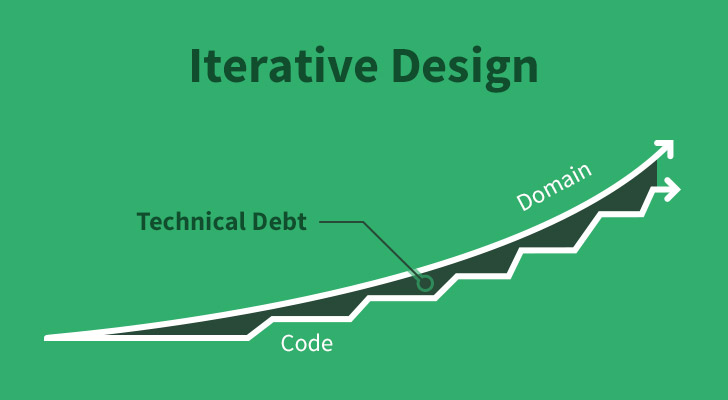
Note that the “Code” and “Domain” lines never intersect. We must accept that we do not yet have enough information to make some kinds of design decisions. But we can get close.
Understanding technical drift is more of a mindset than a particular practice, but it can help put into context why it’s important to remain vigilant, to call attention to code and domain mismatches, and to advocate for accurate and precise names wherever possible. Gaps which you’re creating may be well understood today, but as your team changes, and time progresses, that understandability suffers. Make the investment now, double down and pay attention.
Years later, you don’t want to look back in horror on your code and say to yourself “my god, what have I done?"

The Code Climate team relies on many Open Source tools to help our application give the best feedback to our customers. These tools often depend on ideas with fascinating histories, and investigating these histories can teach us how to use these tools properly. In this post we’d like to focus on the origins of one of the main features of Code Climate Quality – measuring code complexity. We’ll look at the original paper that introduced the idea, and discuss how we discovered that understanding the role of intuition in quantifying code complexity is crucial to correctly interpreting complexity measurements.
While Code Climate Quality doesn’t use this exact measurement, the history of quantifying the complexity of a computer program can be traced to an algorithm known as “cyclomatic complexity.” This concept was introduced in “A Complexity Measure,” a 1976 paper by Thomas J. McCabe, a United States Department of Defense employee who was involved in many large scale programming and programming management efforts during his career. As is the case with most enduring concepts in computer science and software engineering, the problems that motivated McCabe’s original work are still relevant today. The text of the paper begins:
“There is a critical question facing software engineering today: How to modularize a software system so the resulting modules are both testable and maintainable?”
While we have more ideas about modularity, testability, and maintainability than we did in 1976, this is still at the heart of what makes programming complex and challenging for modern programmers, product managers, stakeholders, and more. In order to answer this critical question, McCable makes the claim that:
“What is needed is a mathematical technique that will provide a quantitative basis for modularization and allow us to identify software modules that will be difficult to test or maintain.”
Charged with the task of how to identify complex programs in order to reduce testing time and maintenance costs, McCabe takes a page from his experience with graph theory and provides a framework for determining the complexity of a computer program based on the idea of graph theoretic complexity.
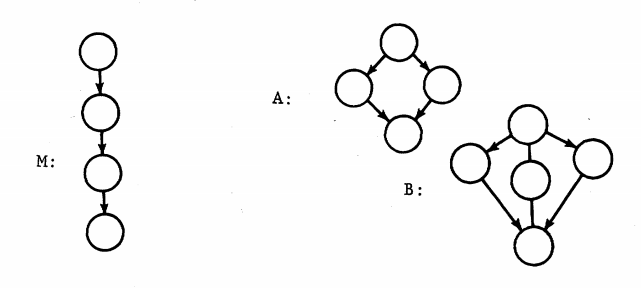
The details of the algorithm aren’t terribly important, but the basic idea is that the connectedness of a graph relates to its complexity, and that the notion of complexity is independent of size. Here’s the author’s description of the strategy:
“The overall strategy will be to measure the complexity of a program by computing the number of linearly independent paths, control the “size” of programs by setting an upper limit to these paths (instead of using just physical size), and use the cyclomatic complexity as the basis for a testing methodology.”
When McCabe speaks of “linearly independent paths,” he is essentially referring to possible paths of execution that running a given piece of code can generate. In modern terms, this means that conditional statements and assignments will lead to higher cyclomatic complexity scores, and that limiting possible paths within methods will leader to lower scores. Let’s take a look at some JavaScript code that will illustrate this principle:
// Example 1 function myFunction(param){ var flags = []; if(param == 0){ flags.push(0); } if(param > 0){ flags.push(param); } return flags; } // Example 2 - simplified function myFunction(param){ return [param]; }
In the first function we can see that there are unnecessary conditional statements that cloud the intent of the (admittedly trivial) function. By removing these if statements and compacting the function to its essentials, we intuitively have a less complex function. By that token, the cyclomatic complexity score would be lower.
While the concept of applying graph theory to the structure of computer programs is novel and would have alone made this paper a landmark, the true measure of its genius lies in the desire of the author to “illustrate the correlation between intuitive complexity and graph-theoretic complexity.” In other words, the author was aware that the intuition of a programmer with respect to their notion of complexity is a powerful one that is worth preserving, and instead of seeking an algorithm that programmers could lean on, he sought one that would confirm what they already believed.
Modern static analysis tools deal with a larger volume of code than McCabe probably ever imagined possible, and so their goals have to be somewhat aligned with modern practice. Tools like Code Climate Quality that analyze entire code bases are going to be more powerful in the historical view than in the moment – there is simply too much information to consume to be able to review a quality report every time new code is pushed to a repository. Instead, the onus is on modern tools to provide a glimpse into how things are changing.Essentially, for a tool to be applicable, it must be trustworthy, and to be trustworthy, it must conform to the underlying assumptions that engineers have about the material that they work with: code.
For Code Climate Quality and other code quality tools to measure their success, they should look to see if they are, for the most part, conforming to the intuition of developers. Where they’re not doing so, they should be opening interesting conversations that help programmers get to the heart of the designs they are implementing. Can you think of examples when static analysis has confirmed or contradicted your intuition? Leave us some examples in the comments below and we’ll share them.
Stay tuned for the next post in which we’ll explore some of the visualizations McCabe used to express code complexity, and look at some real world code examples to see how lowering cyclomatic complexity can make code intuitively less complex.
Works Cited McCabe, T.J. A Complexity Measure IEEE Transactions on Software Engineering, Vol. SE-2 No.4, December 1976. Department of Defense, National Security Agency.

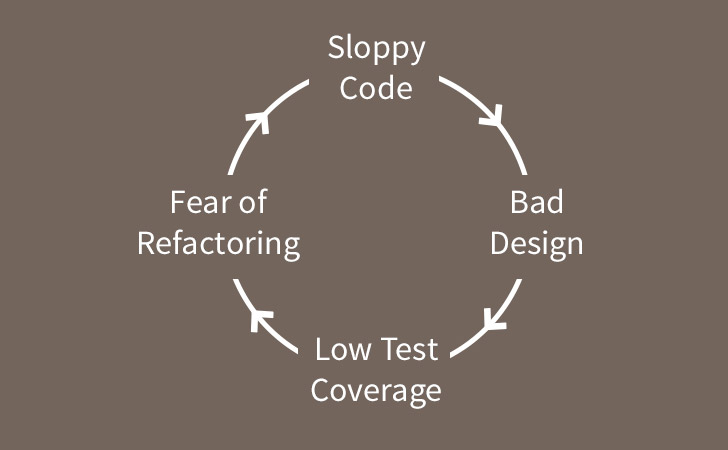
We often have to work on code that doesn’t have good test coverage. This creates a number of problems. The first problem is that if you don’t have good test coverage, it’s hard to know whether your code changes will break other parts of the application, so you need to have a strategy for handling regressions.
The second problem is even more troublesome. Generally, code that doesn’t have good test coverage is also badly designed. One of the big benefits of test driving your code is that it moves you towards a range of good practices. Most of the time, when you test drive code you’ll write your code “outside in” – focusing on the interface that the test needs to validate before thinking about the implementation you’ll need to deliver. It also makes it more likely that you’ll create classes with a narrow responsibilities that are loosely coupled, as the excessive setup required for testing tightly coupled code will quickly move you towards reducing your coupling. So if you’re working with code that doesn’t have good test coverage, most of the time it will be harder to write tests for and more tightly coupled than test driven code.
Finally, because of the the first two issues, the chances are that when changes have been made to the project in the past, developers will have made the smallest possible changes consistent with getting their new feature working rather than refactoring and cleaning up the code every time they touched it. Because of this it’s likely to have a high degree of technical debt, making it even harder to work with.
Moving forward step-by-step
When confronted with code that doesn’t have good test coverage, it’s important not to try to “boil the ocean” with unit tests. It never makes sense to take a couple of weeks (or months) to try to get the code coverage up across the entire app. So, what is the answer? When you need to work with a big ball of mud, where should you start?
A good starting point is to take some time with the product owner/business analyst/business stakeholder to really clarify the key user journeys. Ask, “what are the most important things that your key audiences need to be able to do through the app?” Then create a handful of concrete scenarios for each user journey and write automated acceptance tests for them. For a web app you’d probably use a tool like Cucumber, RSpec and Capybara or Selenium to create these “smoke tests”. They don’t guarantee that your app is working correctly, but they should catch most of the large, systematic problems.
Next, test drive all of new code. That way you have confidence in the new functionality that you are adding to the system. If necessary, you might need to write a thin anti-corruption layer to provide a clean interface to code against for integration level testing.
Finally, whenever you find a bug, start by writing a failing test at an appropriate level (ideally a unit test). Then confirm that once the bug is fixed, the test passes.
If you’re working with a team that is not used to test driving code, take the time to make sure that they’re able to run the test suite locally and pair with them to get them used to test driving new functionality. Also make sure to set up continuous integration to your version control system so you’ll quickly get notified if any of the tests break.
Working with legacy code with limited test coverage is hard, but by following the ideas above it should be easier to get to grips with the code base. And over time, you’ll notice that the test coverage in the areas you care about – where you make most of your changes – will start to become reasonable. Usually within 6-12 months you end up with pretty good coverage in the parts of the app that really matter.
Peter Bell is Founder and CTO of Speak Geek, a contract member of the GitHub training team, and trains and consults regularly on everything from JavaScript and Ruby development to devOps and NoSQL data stores.

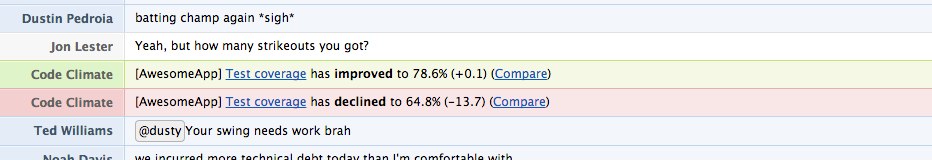
Today we’re proud to announce that we’re bringing Code Climate Quality more in line with how many of you work — you can now see how each change affects the quality and security of your code before it’s merged into main. You no longer have to wait until a security vulnerability is in main before eradicating it from your code base. If you use feature branches, you can ensure the quality is up to your team’s standards before merging. When reviewing a refactoring, you can easily visualize the impact to the codebase on a single page.
In short, you can merge with confidence. Create a Code Climate account start getting analysis of your Pull Requests right now.
There are three new, key features that work together to make this possible:
- GitHub Pull Request integration
- Compare view
- Branch analysis
Let’s look at each of them.
GitHub Pull Request integration
We’re happy to announce that Code Climate will automatically analyze your GitHub Pull Requests. Simply open a Pull Request and Code Climate will inform GitHub when our analysis is ready for you (if you’ve used or seen Travis CI’s build status on GitHub, we use the same exact mechanism):
Branch testing and Pull Request support is included in all our currently offered plans at the Team level and above. We’ll be rolling this feature out incrementally over the next few days, and we will let you know when it’s activated for your account.
Note: Due to some technical considerations around analyzing cross-repo PRs, supporting Pull Requests for our free-for-OSS repos will take some extra time but is high on our list.
Compare view
Once we’ve finished analyzing your pull request/branch, you’ll be able to see the results in our new Compare view. It’s a focused representation of the important changes in your branch. You’ll see the overall change to your repo’s GPA, how your classes or files grades have changed and where code smells have been fixed, introduced or gotten worse:
Branch analysis
Even if you don’t use GitHub Pull Requests, you can start getting feedback on your branches immediately. Start by clicking on the new “Branches” tab for each of your repositories:
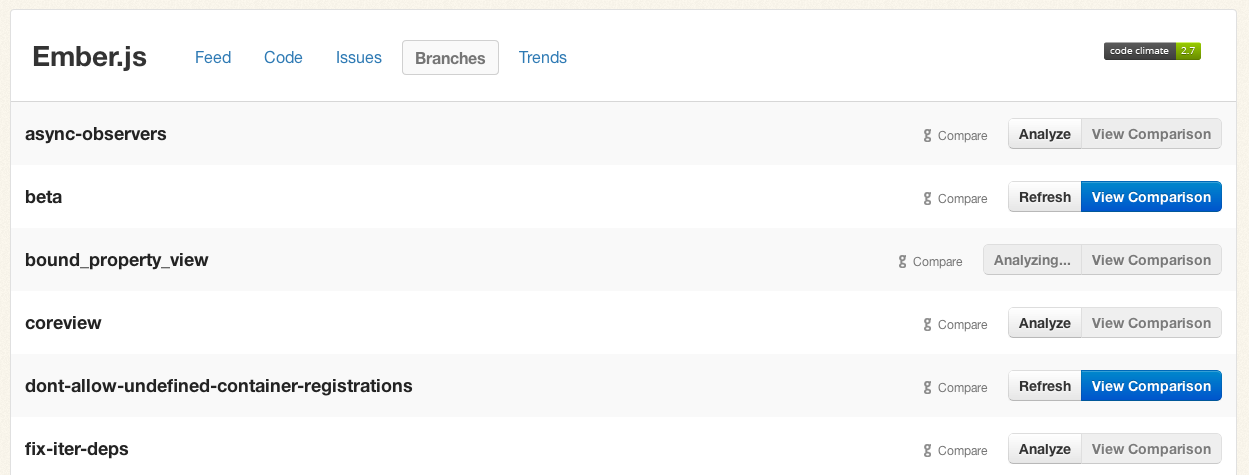
Push the “Analyze” button for any branches you care about, briefly sit tight, and within a few minutes the “View Comparison” button will be available to send you to a Compare view.
First-class Pull Request support has been our most requested feature over the last year, and we’re thrilled to be delivering it to you. We’ve been using these new features while we’ve been building them (I know, very meta) and we’re really enjoying the quicker feedback loop.
We hope you enjoy it as much as we have. We’d love to hear what you think!

As modern software developers we have many tools at our disposal to help us feel confident that the code we produce is high-quality and defect free. Among the most valuable of these are tools that aid in inspecting source code written by another developer, or what we commonly call code review.
Often developers think the main reason for code review is to find bugs, but a 2013 study produced by by Alberto Bacchelli and Christian Bird of Microsoft Research concluded that other outcomes are more prevalent – and possibly more valuable!
Bacchelli and Bird surveyed 165 managers and 873 programmers at Microsoft, interviewed 17 developers with various degrees of experience and seniority across 16 separate product teams, and manually reviewed the content of 570 comments from Microsoft CodeFlow, an internal interactive tool that creates a central location where the discussion of code and the subsequent fixes can be discussed either in real-time or asynchronously.
What they found was that while the top motivation of developers, managers, and testers in performing code review is to find bugs, the outcome of most reviews is quite different.
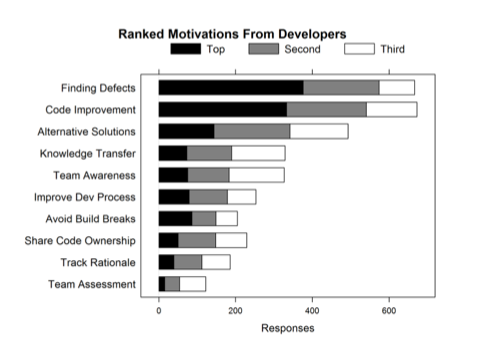
The ‘Motivations’ chart: the ranked motivation categories from the developer segment of the interviews.
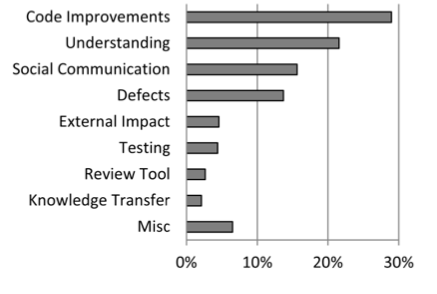
The ‘Outcomes’: Ranked categories extracted from a sampling of code review data.
As can be seen from these charts of Motivations and Outcomes, the top motivation for the largest number of developers was “Finding defects,” yet the topic most commonly discussed in code reviews ostensibly pertains to “code improvements:” comments or changes about code in terms of readability, commenting, consistency, dead code removal, etc.
So if code review isn’t giving us what we want, why do we keep doing it? The response of one senior developer in the study sums it up well:
“[code review] also has several beneficial influences: (1) makes people less protective about their code, (2) gives another person insight into the code, so there is (3) better sharing of information across the team, (4) helps support coding conventions on the team, and…(5) helps improve the overall process and quality of code.”
Bacchelli and Bird conclude that, while there’s a significant difference between the expectations and outcomes of code review, this isn’t a bad thing. While we don’t always get the exact value from code reviews that we expected, we often end up getting quite a bit more.
Turns out the Stones were right: You can’t always get what you want, but you just might find you get what you need.
In addition to a modicum of somewhat superficial bug fixes, teams get benefits such as “knowledge transfer, increased team awareness, and improved solutions to problems” from participating in modern code reviews. Additionally, the idea that code review is good at “educating new developers about code writing” is a compelling point.
Bacchelli and Bird recommend embracing these unexpected outcomes, rather than trying to re-focus code reviews on finding bugs, and let code review policies be guided with the explicit intent to improve code style, find alternative solutions, increase learning, and share ownership.
They also recommend automating enforcement of team style and code conventions to free reviewers to look for deeper more subtle defects – something we agree with wholeheartedly!
All quotes and figures are from Alberto Bacchelli and Christian Bird, “Expectations, Outcomes, and Challenges of Modern Code Review”, May 2013, Proceedings of the International Conference on Software Engineering.

Balanced test suites for long-term maintainability
Are your tests running slower than you’d like? Or perhaps your tests are brittle, making it harder to refactor and make substantial changes to your application functionality? Both are common complaints for large Rails apps that have been around for years, but good testing practices shouldn’t create these problems over the long term.
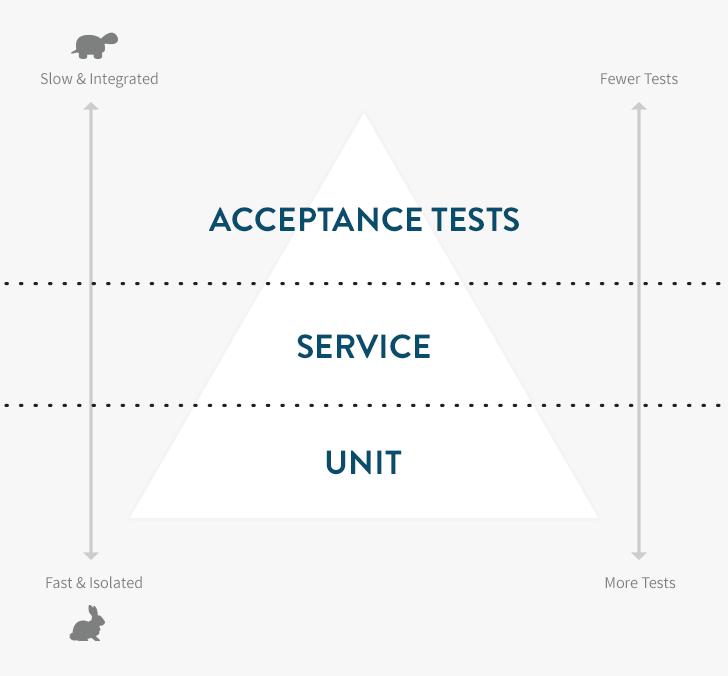
The testing pyramid is a concept that can help you better balance your tests, speeding up your test suite and reducing the cost of changing the functionality of your applications. It centers on the composition of different types of tests in your suite.
You’re probably already familiar with the two most common types of Rails tests in the wild:
- ** Unit tests** — The lowest and most important level. Unit tests use tools like RSpec, MiniTest or Jasmine that confirm the correct behavior of isolated units of functionality (typically classes, methods or functions), and run extremely fast (milliseconds).
- Acceptance tests — The high level (typically user-level) tests using tools like RSpec and Capybara, Cucumber or Selenium. Since they run a lot more code than unit tests and often depend on external services they are much slower (seconds or minutes).
A properly tested application feature requires both unit tests and acceptance tests. Start by making sure you have good unit test coverage. This is a natural by-product of a test-driven development (TDD) workflow. Your unit tests should catch edge cases and confirm correct object behavior.
Carefully supplement your unit tests with acceptance tests that exercise the application like an end-user. These will give you confidence that all of the objects are playing nicely together. Teams often end up with way too many of these tests, slowing development cycles to a crawl. If you have 20 Capybara-based tests for user registration to confirm that all validation errors are handled correctly, you’re testing at the wrong level. This is known as the Inverted Testing Pyramid anti-pattern.
The Throwaway Test
It’s important to realize that — just like scaffolding — a test can be useful without being permanent. Imagine that you’re going to spend two weeks building a complex registration system, but you’re slicing it into half day stories each of which has a couple of Cucumber tests to verify behavior. This can be a good way to develop, as you’ve got a large number of thinly-sliced stories and are ensuring that you have clear “confirmation” that each story is complete in the form of passing acceptance tests. Just don’t forget the final step: When you’re done, pare your test suite down to the minimum set of tests to provide the confidence you need (which may vary depending on the feature).
Once you’re done with such a minimum marketable feature, instead of just shipping with the 40-50 acceptance tests you used while building out the stories, you should replace those with maybe 3-5 user journeys covering the major flows through the registration system. It’s OK to throw away the other tests, but make sure that you’re still ensuring correctness of the key behaviors — often by adding more unit tests. If you don’t do this, you’ll quickly end up with a test suite that requires substantial parallelization just to run in 5-8 minutes and that is brittle with small UI changes breaking large numbers of tests.
Service-Level Testing
Eventually, you’ll notice that there is sometimes functionality that you can’t confidently test at a unit level but that shouldn’t really be tested via the UI. In his 2009 book, “Succeeding with Agile”, Mike Cohn (who came up with the concept of “the testing pyramid” which was later popularized by Martin Fowler) used the phrase “service-level testing” to describe these tests. Various communities also use terms like functional or integration tests which also describe tests between unit and end-to-end acceptance tests.
The trick with service level testing is to expose an API for your application or subsystem so that you can test the API independently of the UI that will exercise it. This ties in nicely with trends in web application development where many teams are now trending towards building a single RESTful JSON API on the server side to service both web and native mobile clients.
Putting It All together
Most applications only have a small number of critical user paths. For an eCommerce application, they might be:
- Browsing the product catalog
- Buying a product
- Creating an account
- Logging in (including password reset)
- Checking order history
As long as those five things are working, the developers don’t need to be woken up in the middle of the night to fix the application code. (Ops is another story.) Those functions can likely be covered with five coarse-grained, Capybara tests that run in under two minutes total.
Blending unit tests, service-level tests and acceptance tests yields faster test suites that still provide confidence the application is working, and are resistant to incidental breakage. As you develop, take care to prune tests that are not pulling their weight. When you fix a bug, implement your regression test at the lowest possible level. Over time, keep an eye on the ratio between the counts of each type of test, as well as the time of your acceptance test suite.
Using these techniques, you can achieve testing nirvana: A suite that provides you confidence the application works, gives you freedom to change the application without brittle, UI-related test failures, and runs in a few minutes without any parallelization.
Peter Bell is Founder and CTO of Speak Geek, a contract member of the GitHub training team, and trains and consults regularly on everything from JavaScript and Ruby development to devOps and NoSQL data stores.

Deploying in 5 seconds with simpler, faster Capistrano tasks
TL;DR — We reduced deploy times from ten minutes to less than five seconds by replacing the standard Capistrano deploy tasks with a simpler, Git-based workflow and avoiding slow, unnecessary work.
At Code Climate, we try to minimize the time between when code is written and when it is live in production. When deploys slowed until they left enough time to make a pot of coffee, we invested in speeding them up.
What’s in a deploy?
At its core, deploying a modern Rails application consists of a few simple steps:
- Update the application code
- Run
bundle install(if the Gemfile was updated) - Precompile assets (if assets were updated)
- Restart the application processes (e.g. Unicorn)
If the deploy fails, the developer needs to be alerted immediately. If application processes fail to rollover to the latest code, we need to detect that.
For kicks, I wrote a Bash script to perform those steps, to determine our theoretical lowest deploy time (just the time for SSH and running the minimum, required commands). It took about three seconds when there were no Gemfile or asset changes. So I set out to reduce our ten minute deploys to as close to that number as possible.
Enter Capistrano
If you take anything away from this article, make it this: Capistrano is really two tools in one. It provides both:
- A runtime allowing you to run arbitrary commands against sets of remote servers via SSH
- A set of default tasks for deploying Rails applications
The runtime is incredibly useful. The default tasks, which originated back in 2005, come from a pre-Git era and are unnecessarily slow and complex for most Rails applications today.
By default, Capistrano creates a releases directory to store each deployed version of the code, and implicitly serve as a deployment history for rollback. The current symlink points to the active version of the code. For files that need to be shared across deployments (e.g. logs and PID files), Capistrano creates symlinks into the shared directory.
Git for faster, simpler deploys
We avoid the complexity of the releases, current and shared directories, and the slowness of copying our application code on every deploy by using Git. To begin, we clone our Git repo into what will become our deploy_to directory (in Capistrano speak):
git clone ssh://github.com/codeclimate/codeclimate.git /data/codeclimate/app
To update the code, a simple git fetch followed by git reset —hard will suffice. Local Git tags (on the app servers) work beautifully for tracking the deployment history that the releases directory did. Because the same checkout is used across deployments, there’s no need for shared symlinks. As a bonus, we use Git history to detect whether post-update work like bundling Gems needs to be done (more on that later).
The Results
Our new deploy process is heavily inspired by (read: stolen from) Recap, a fantastic set of modern Capistrano tasks intended to replace the defaults. We would have used Recap directly, but it only works on Ubuntu right now.
In the end we extracted a small set of Capistrano tasks that work together to give us the simple, extremely fast deploys:
deploy:update_code— Resets the Git working directory to the latest code we want to deploy.bundle:install:if_changed— Checks if either theGemfileorGemfile.lockwere changed, and if so invokes thebundle:installtask. Most deploys don’t includeGemfilechanges so this saves some time.assets:precompile:if_changed— Similar to the above, this invokes theassets:precompiletask if and only if there were changes that may necessitate asset updates. We look for changes to three paths:app/assets,Gemfile.lock, andconfig. Asset pre-compilation is notoriously slow, and this saves us a lot of time when pushing out changes that only touch Ruby code or configuration.deploy:tag— Creates a Git tag on the app server for the release. We never push these tags upstream to GitHub.deploy:restart— This part varies depending on your application server of choice. For us, we use God to send aUSR2signal to our Unicorn master process.deploy:verify— This is the most complex part. The simplest approach would have Capistrano wait until the Unicorn processes reboot (with a timeout). However, since Unicorn reboots take 30 seconds, I didn’t want to wait all that extra time just to confirm something that works 99% of the time. Using every ounce of Unix-fu I could muster, I cobbled together a solution using theatutility:
echo 'curl -sS http://127.0.0.1:3000/system/revision | grep "c7fe01a813" > /dev/null || echo "Expected SHA: c7fe01a813" | mail -s "Unicorn restart failed" ops@example.com' | at now + 2 minutes
Here’s where we ended up: (Note: I edited the output a bit for clarity.)
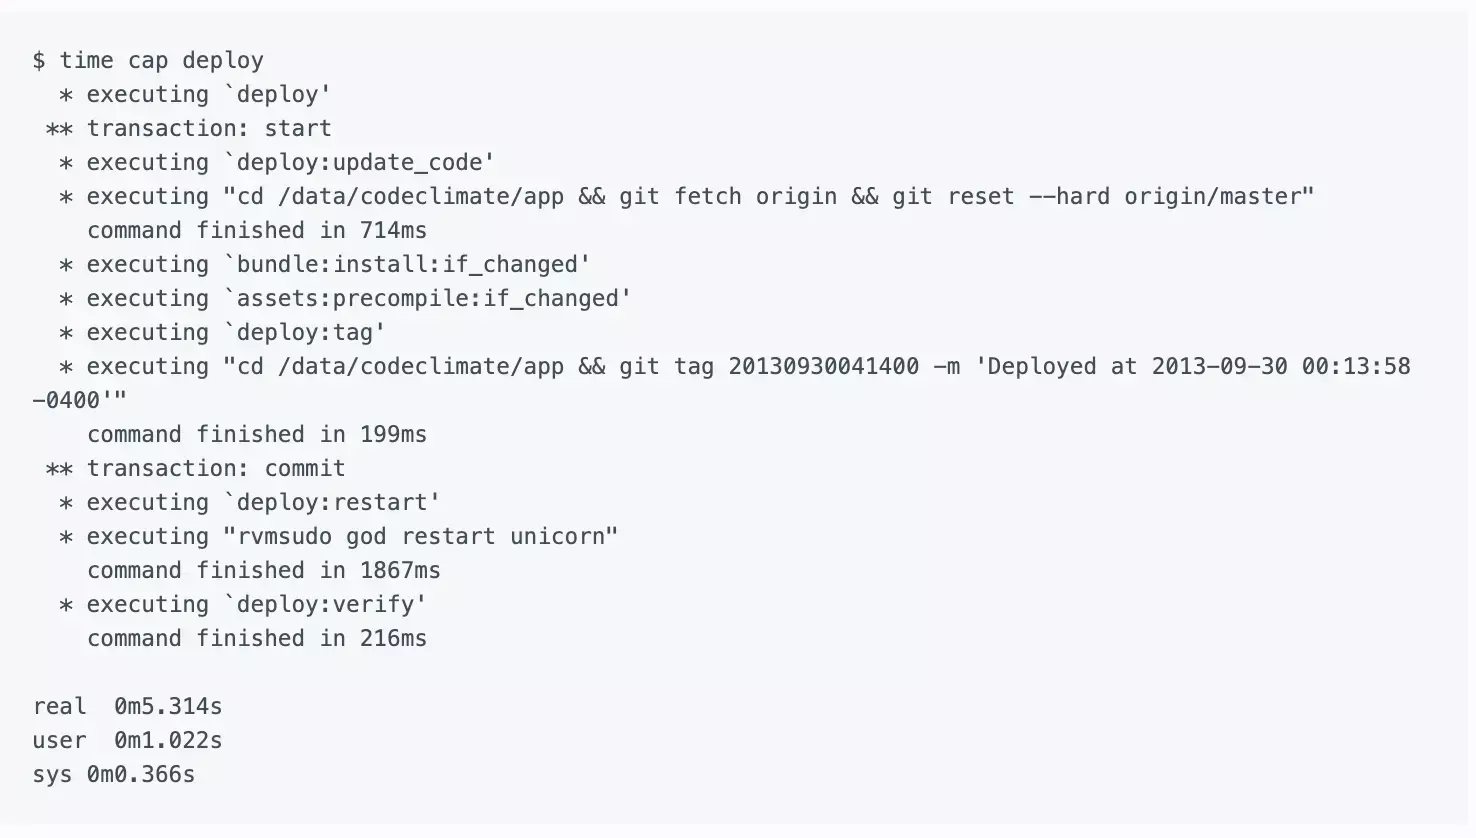
If your deploys are not as zippy as you’d like, consider if a similar approach would work for you. The entire project took me about a day of upfront work, but it pays dividends each and every time we deploy.
Further Reading
- Recap — Discussed above. Highly recommend taking a look at the source, even if you don’t use it.
- Deployment Script Spring Cleaning from the GitHub blog — The first time I encountered the idea of deploying directly from a single Git working copy. I thought it was crazy at the time but have come around.

Code quality and test coverage information often live in separate silos. Code Climate has always been able to help you understand the complexity of your code, but to look at your test coverage required a different set of tools (like SimpleCov). This made it harder than necessary to answer key questions like:
- “Which areas of my app are both low quality and untested?”
- “How well covered is this method I’m about to refactor?”
- “Should I beef up integration testing coverage before this large-scale change?”
Today, we’re proud to announce the full integration of test coverage metrics into Code Climate. To make it dead simple to get started, we’re also partnering with three awesome companies that are experts at running your tests – Semaphore, Solano Labs, and Travis CI. (More on this below.)
Having test coverage side-by-side with code quality enables your team to make better decisions earlier in your development process, leading to more maintainable code that is easier to work in. Here’s a quick look:
Just like with code quality, we surface test coverage information at the repository, class, and source listing level (down to an individual line of code) and provide feedback as metrics change over time in the form of email alerts, activity feeds, chat notifications and RSS.
With just a few minutes of setup you can:
- View test coverage reports for each class alongside other metrics like complexity, duplication, and churn.
- Toggle between viewing code smells and test coverage line-by-line on the same source listings (see above).
- Track your team’s test coverage in your weekly summary emails and Code Climate feed.
Here’s a couple examples of Code Climate’s test coverage integration …
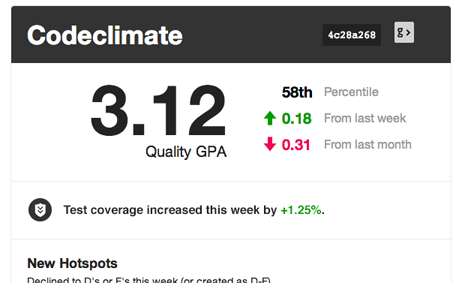
… in your chatroom:
… and in your weekly summary email:
We think the addition of test coverage to our code quality offering is a powerful upgrade in our mission of helping free teams from the burden of technical debt and unmaintainable code. Give it a try today, and let us know what you think.
How does test coverage work?
Code Climate does not run your code, and that’s not changing. Instead, our new test coverage feature works by accepting coverage data sent from wherever you are already running your tests. This means you can use Code Climate’s new test coverage feature with your existing continuous integration (CI) server. (In a pinch, you could even send up test coverage data from your laptop, or anywhere else.)
We’ve released the codeclimate-test-reporter RubyGem that you install into your Gemfile. When your tests finish, it sends an HTTPS post to us with a report on which lines of code were executed (and how many times).
Test Coverage is included in all our currently offered plans. To turn it on for a specific repo, just go to your repository’s feed page, click “Set up Test Coverage” and follow the instructions.
Our Partners
Some of you might not have a CI server in place for your project, or perhaps you’ve been frustrated maintaining your own CI server and are looking for something better. We believe cloud-based CI is the future and are excited to partner with three fantastic CI providers – Semaphore, Solano Labs, and Travis CI – to ensure you can integrate their services with just a few clicks.

All three of our partners save you from the headaches of administering a CI server (like Jenkins) on your own – time and money that adds up quickly. If you’re looking to make a move to a cloud CI vendor, now is a great time.
Joining forces with three companies that are experts at running your tests – safely, quickly and with little effort – means we can stay focused on what we do best. To get started with one of these great partner offers, login to your Code Climate account and head to the Test Coverage setup tab for one of your repos.