Use Cases
Navigating the world of software engineering or developer productivity insights can feel like trying to solve a complex puzzle, especially for large-scale organizations. It's one of those areas where having a cohesive strategy can make all the difference between success and frustration. Over the years, as I’ve worked with enterprise-level organizations, I’ve seen countless instances where a lack of strategy caused initiatives to fail or fizzle out.
In my latest webinar, I breakdown the key components engineering leaders need to consider when building an insights strategy.
Why a Strategy Matters
At the heart of every successful software engineering team is a drive for three things:
- A culture of continuous improvement
- The ability to move from idea to impact quickly, frequently, and with confidence
- A software organization delivering meaningful value
These goals sound simple enough, but in reality, achieving them requires more than just wishing for better performance. It takes data, action, and, most importantly, a cultural shift. And here's the catch: those three things don't come together by accident.
In my experience, whenever a large-scale change fails, there's one common denominator: a lack of a cohesive strategy. Every time I’ve witnessed a failed attempt at implementing new technology or making a big shift, the missing piece was always that strategic foundation. Without a clear, aligned strategy, you're not just wasting resources—you’re creating frustration across the entire organization.
Sign up for a free, expert-led insights strategy workshop for your enterprise org.
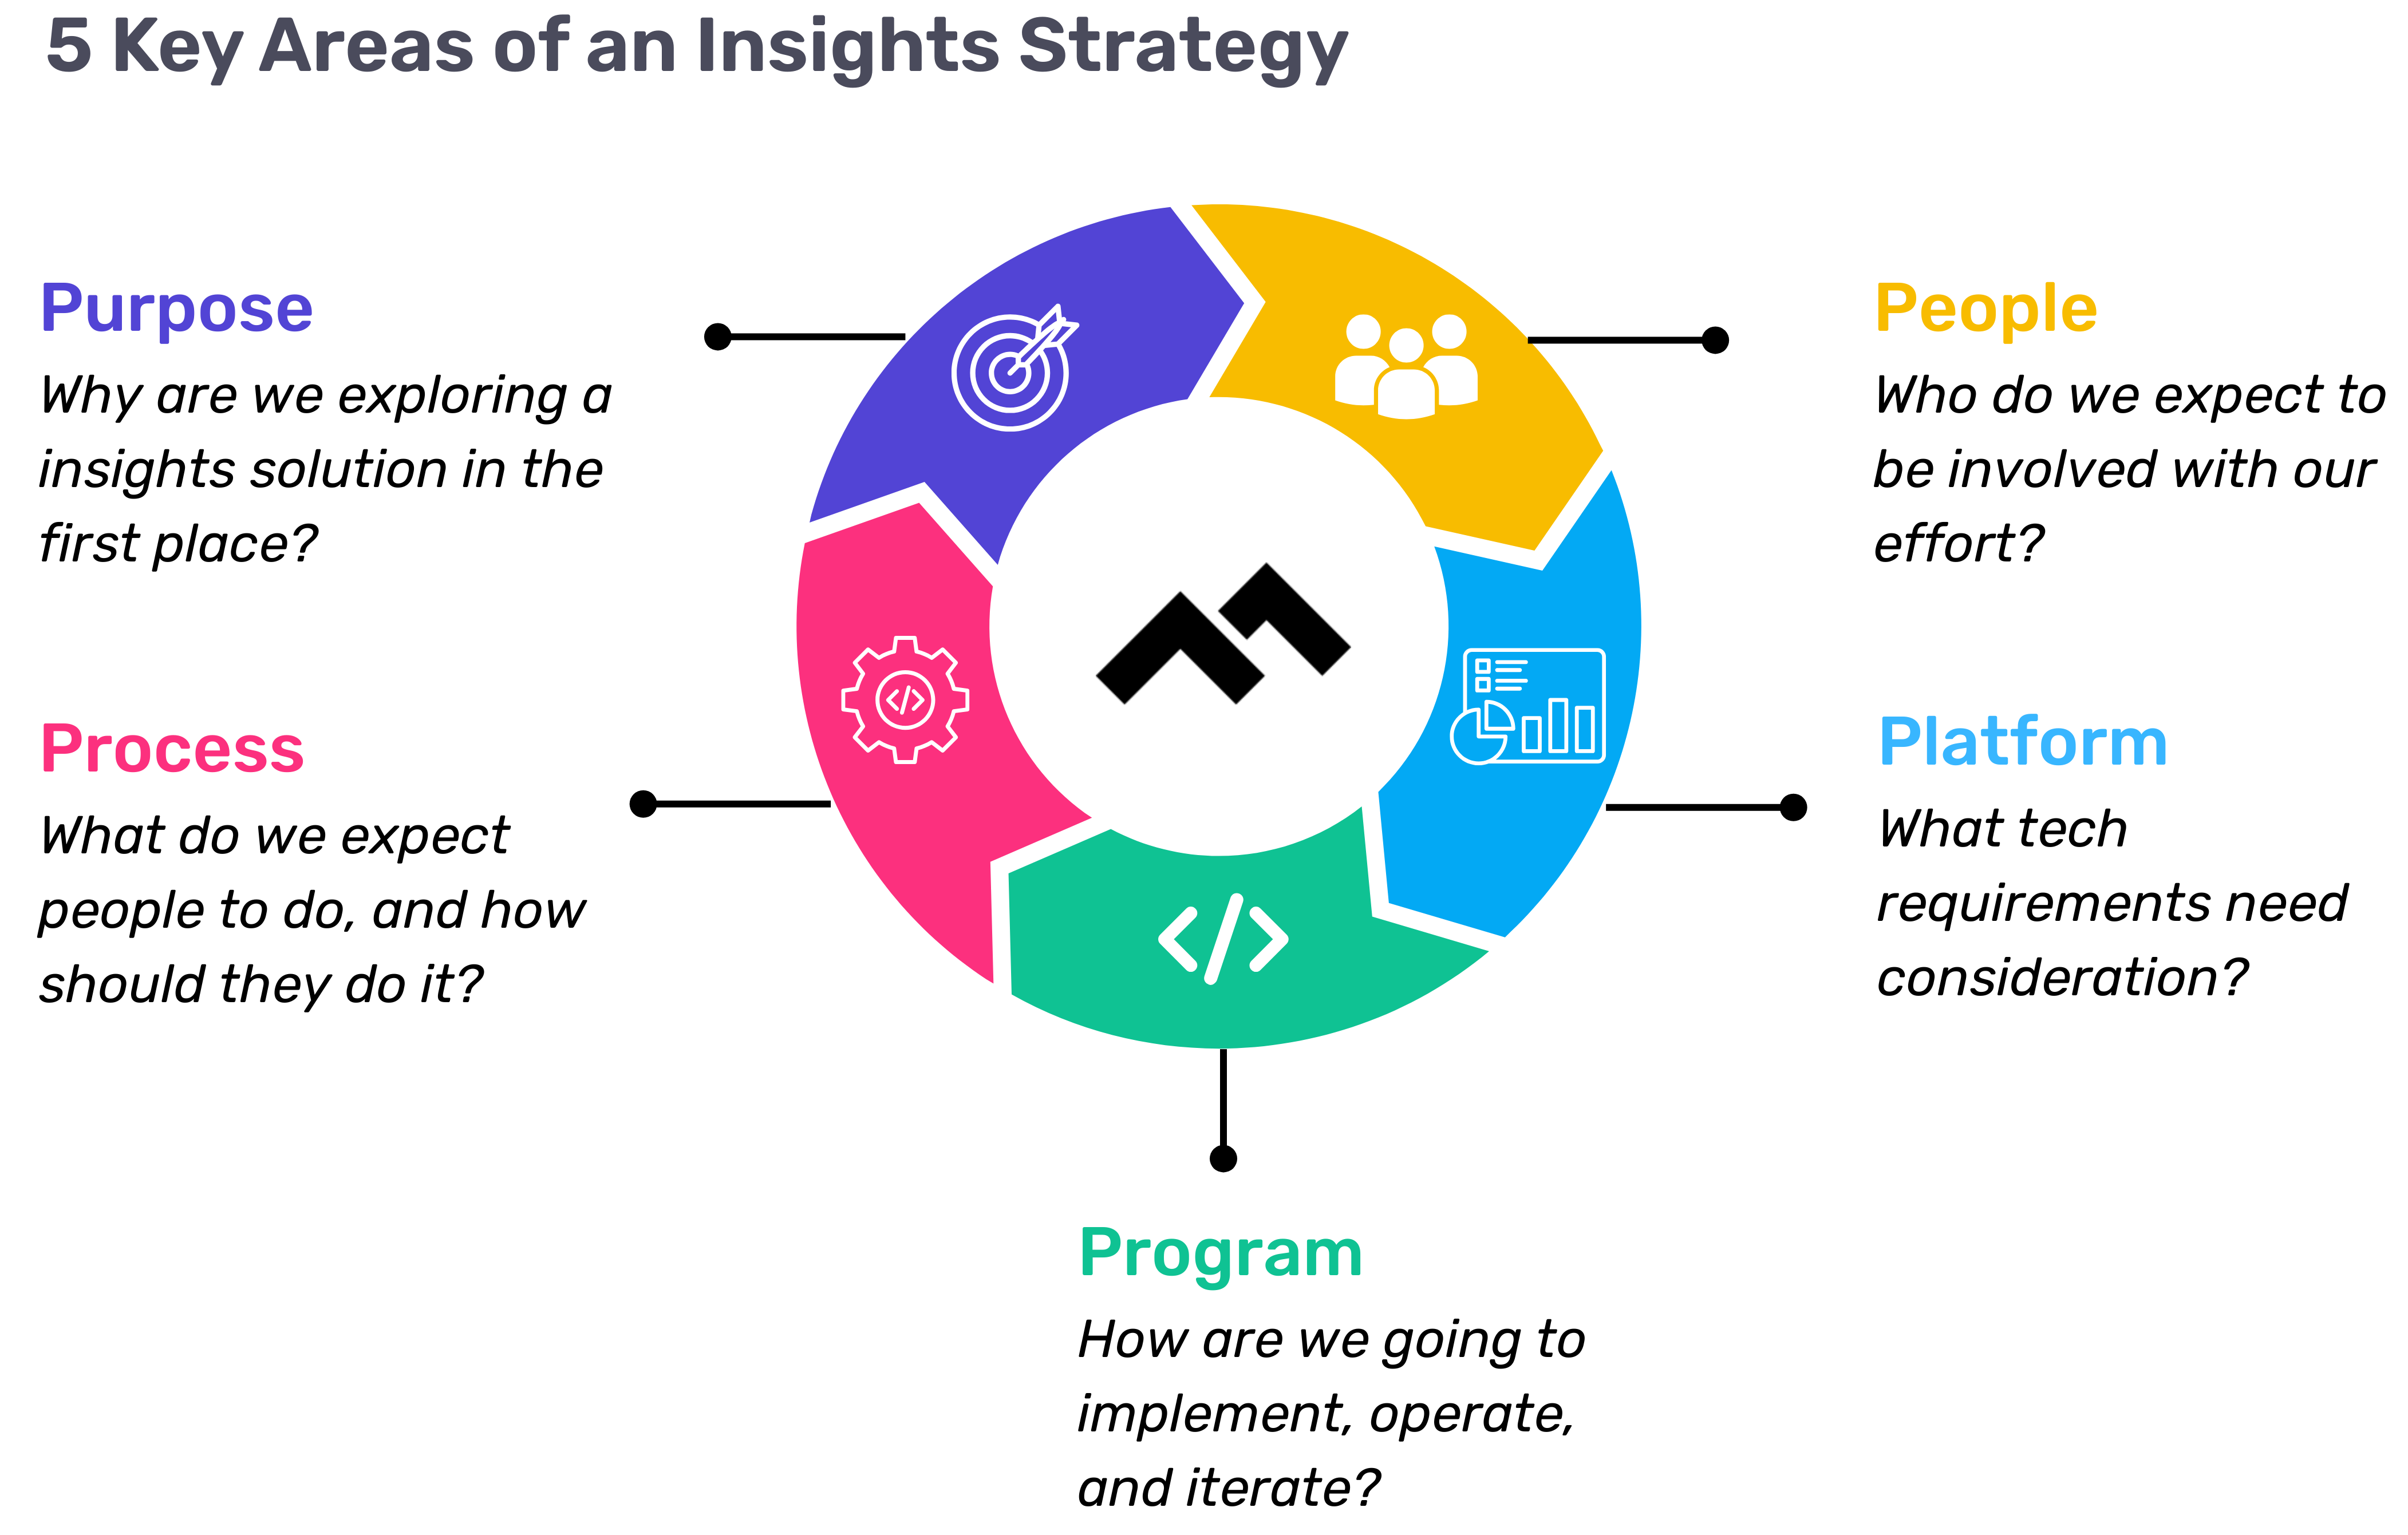
Step 1: Define Your Purpose
The first step in any successful engineering insights strategy is defining why you're doing this in the first place. If you're rolling out developer productivity metrics or an insights platform, you need to make sure there’s alignment on the purpose across the board.
Too often, organizations dive into this journey without answering the crucial question: Why do we need this data? If you ask five different leaders in your organization, are you going to get five answers, or will they all point to the same objective? If you can’t answer this clearly, you risk chasing a vague, unhelpful path.
One way I recommend approaching this is through the "Five Whys" technique. Ask why you're doing this, and then keep asking "why" until you get to the core of the problem. For example, if your initial answer is, “We need engineering metrics,” ask why. The next answer might be, “Because we're missing deliverables.” Keep going until you identify the true purpose behind the initiative. Understanding that purpose helps avoid unnecessary distractions and lets you focus on solving the real issue.
Step 2: Understand Your People
Once the purpose is clear, the next step is to think about who will be involved in this journey. You have to consider the following:
- Who will be using the developer productivity tool/insights platform?
- Are these hands-on developers or executives looking for high-level insights?
- Who else in the organization might need access to the data, like finance or operations teams?
It’s also crucial to account for organizational changes. Reorgs are common in the enterprise world, and as your organization evolves, so too must your insights platform. If the people responsible for the platform’s maintenance change, who will ensure the data remains relevant to the new structure? Too often, teams stop using insights platforms because the data no longer reflects the current state of the organization. You need to have the right people in place to ensure continuous alignment and relevance.
Step 3: Define Your Process
The next key component is process—a step that many organizations overlook. It's easy to say, "We have the data now," but then what happens? What do you expect people to do with the data once it’s available? And how do you track if those actions are leading to improvement?
A common mistake I see is organizations focusing on metrics without a clear action plan. Instead of just looking at a metric like PR cycle times, the goal should be to first identify the problem you're trying to solve. If the problem is poor code quality, then improving the review cycle times might help, but only because it’s part of a larger process of improving quality, not just for the sake of improving the metric.
It’s also essential to approach this with an experimentation mindset. For example, start by identifying an area for improvement, make a hypothesis about how to improve it, then test it and use engineering insights data to see if your hypothesis is correct. Starting with a metric and trying to manipulate it is a quick way to lose sight of your larger purpose.
Step 4: Program and Rollout Strategy
The next piece of the puzzle is your program and rollout strategy. It’s easy to roll out an engineering insights platform and expect people to just log in and start using it, but that’s not enough. You need to think about how you'll introduce this new tool to the various stakeholders across different teams and business units.
The key here is to design a value loop within a smaller team or department first. Get a team to go through the full cycle of seeing the insights, taking action, and then quantifying the impact of that action. Once you've done this on a smaller scale, you can share success stories and roll it out more broadly across the organization. It’s not about whether people are logging into the platform—it’s about whether they’re driving meaningful change based on the insights.
Step 5: Choose Your Platform Wisely
And finally, we come to the platform itself. It’s the shiny object that many organizations focus on first, but as I’ve said before, it’s the last piece of the puzzle, not the first. Engineering insights platforms like Code Climate are powerful tools, but they can’t solve the problem of a poorly defined strategy.
I’ve seen organizations spend months evaluating these platforms, only to realize they didn't even know what they needed. One company in the telecom industry realized that no available platform suited their needs, so they chose to build their own. The key takeaway here is that your platform should align with your strategy—not the other way around. You should understand your purpose, people, and process before you even begin evaluating platforms.
Looking Ahead
To build a successful engineering insights strategy, you need to go beyond just installing a tool. An insights platform can only work if it’s supported by a clear purpose, the right people, a well-defined process, and a program that rolls it out effectively. The combination of these elements will ensure that your insights platform isn’t just a dashboard—it becomes a powerful driver of change and improvement in your organization.
Remember, a successful software engineering insights strategy isn’t just about the tool. It’s about building a culture of data-driven decision-making, fostering continuous improvement, and aligning all your teams toward achieving business outcomes. When you get that right, the value of engineering insights becomes clear.
Want to build a tailored engineering insights strategy for your enterprise organization? Get expert recommendations at our free insights strategy workshop. Register here.Register here.
Andrew Gassen has guided Fortune 500 companies and large government agencies through complex digital transformations. He specializes in embedding data-driven, experiment-led approaches within enterprise environments, helping organizations build a culture of continuous improvement and thrive in a rapidly evolving world.
Most organizations are great at communicating product releases—but rarely do the same for process improvements that enable those releases. This is a missed opportunity for any leader wanting to expand “growth mindset,” as curiosity and innovation is as critical for process improvement as it is product development.
Curiosity and innovation aren’t limited to product development. They’re just as essential in how your teams deliver that product. When engineering and delivery leaders share what they’re doing to find efficiencies and unclog bottlenecks, they not only improve Time to Value — they help their peers level up too.
Create Buzz Around Process Wins
Below is a template leaders can use via email or communication app (Slack, Microsoft Teams) to share process changes with their team. I’ve personally seen updates like this generate the same level of energy as product announcements—complete with clap emojis👏 and follow-up pings like “Tell me more!” Even better, they’re useful for performance reviews and make great resume material for the leads who author them (excluding any sensitive or proprietary content, of course).
Subject: [Experiment update]
[Date]
Experiment Lead: [Name]
Goal: [Enter the longer term goal your experiment was in service of]
Opportunity: [Describe a bottleneck or opportunity you identified for some focused improvement]
Problem: [Describe the specific problem you aimed to solve]
Solution: [Describe the very specific solution you tested]
Metric(s): [What was the one metric you determined would help you know if your solution solved the problem? Were there any additional metrics you kept track of, to understand how they changed as well?]
Action: [Describe, in brief, what you did to get the result]
Result: [What was the result of the experiment, in terms of the above metrics?]
Next Step: [What will you do now? Will you run another experiment like this, design a new one, or will you rollout the solution more broadly?]
Key Learnings: [What did you learn during this experiment that is going to make your next action stronger?]
Please reach out to [experiment lead’s name] for more detail.
Sample Use Case
Subject: PR Descriptions Boost Review Speed by 30%
March 31, 2025
Experiment Lead: Mary O’Clary
Goal: We must pull a major capability from Q4 2024 into Q2 2025 to increase our revenue. We believe we can do this by improving productivity by 30%.
Opportunity: We found lack of clear descriptions were a primary cause of churn & delay during the review cycle. How might we improve PR descriptions, with information reviewers need?
Problem: Help PR Reviewers more regularly understand the scope of PRs, so they don’t need to ask developers a bunch of questions.
Solution: Issue simple guidelines for what we are looking for PR descriptions
Metric(s): PR Review Speed. We also monitored overall PR Cycle Time, assuming it would also improve for PRs closed within our experiment timeframe.
Action: We ran this experiment over one 2 week sprint, with no substantial changes in complexity of work or composition of the team. We kept the timeframe tight to help eliminate additional variables.
Result: We saw PR Review Speed increase by 30%
Next Step: Because of such a great result and low perceived risk, we will roll this out across Engineering and continue to monitor both PR Review Speed & PR Cycle Time.
Key Learnings: Clear, consistent PR descriptions reduce reviewer friction without adding developer overhead, giving us confidence to expand this practice org-wide to help accelerate key Q2 2025 delivery.
Please reach out to Mary for more detail.
How Make This Process Stick
My recommendation is to appoint one “editor in chief” to issue these updates each week. They should CC the experiment lead on the communication to provide visibility. In the first 4-6 weeks, this editor may need to actively solicit reports and coach people on what to share. This is normal—you’re building a new behavior. During that time, it's critical that managers respond to these updates with kudos and support, and they may need to be prompted to do so in the first couple of weeks.
If these updates become a regular ritual, within ~3 months, you’ll likely have more contributions than you can keep up with. That’s when the real cultural shift happens: people start sharing without prompting, and process improvement becomes part of how your org operates.
I’ve seen this work in large-scale organizations, from manufacturing to healthcare. Whether your continuous improvement culture is just getting started or already mature, this small practice can help you sustain momentum and deepen your culture of learning.
Give it a shot, and don’t forget to celebrate the wins along the way.
Jen Handler is the Head of Professional Services at Code Climate. She’s an experienced technology leader with 20 years of building teams that deliver outcome-driven products for Fortune 50 companies across industries including healthcare, hospitality, retail, and finance. Her specialties include goal development, lean experimentation, and behavior change.
Output is not the same as impact. Flow is not the same as effectiveness. Most of us would agree with these statements—so why does the software industry default to output and flow metrics when measuring success? It’s a complex issue with multiple factors, but the elephant in the room is this: mapping engineering insights to meaningful business impact is far more challenging than measuring developer output or workflow efficiency.
Ideally, data should inform decisions. The problem arises when the wrong data is used to diagnose a problem that isn’t the real issue. Using misaligned metrics leads to misguided decisions, and unfortunately, we see this happen across engineering organizations of all sizes. While many companies have adopted Software Engineering Intelligence (SEI) platforms—whether through homegrown solutions or by partnering with company that specializes in SEI like Code Climate—a clear divide has emerged. Successful and mature organizations leverage engineering insights to drive real improvements, while others collect data without extracting real value—or worse, make decisions aimed solely at improving a metric rather than solving a real business challenge.
From our experience partnering with large enterprises with complex structures and over 1,000 engineers, we’ve identified three key factors that set high-performing engineering organizations apart.
1. Treating Software Engineering Insights as a Product
When platform engineering first emerged, early innovators adopted the mantra of “platform as a product” to emphasize the key principles that drive successful platform teams. The same mindset applies to Software Engineering Intelligence (SEI). Enterprise organizations succeed when they treat engineering insights as a product rather than just a reporting tool.
Data shouldn’t be collected for the sake of having it—it should serve a clear purpose: helping specific users achieve specific outcomes. Whether for engineering leadership, product teams, or executive stakeholders, high-performing organizations ensure that engineering insights are:
- Relevant – Focused on what each audience actually needs to know.
- Actionable – Providing clear next steps, not just numbers.
- Timely – Delivered at the right moment to drive decisions.
Rather than relying on pre-built dashboards with generic engineering metrics, mature organizations customize reporting to align with team priorities and business objectives.
For example, one of our healthcare customers is evaluating how AI coding tools like GitHub Copilot and Cursor might impact their hiring plans for the year. They have specific questions to answer and are running highly tailored experiments, making a custom dashboard essential for generating meaningful, relevant insights. With many SEI solutions, they would have to externalize data into another system or piece together information from multiple pages, increasing overhead and slowing down decision-making.
High-performing enterprise organizations don’t treat their SEI solution as static. Team structures evolve, business priorities shift, and engineering workflows change. Instead of relying on one-size-fits-all reporting, they continuously refine their insights to keep them aligned with business and engineering goals. Frequent iteration isn’t a flaw—it’s a necessary feature, and the best organizations design their SEI operations with this in mind.
2. The Value of Code is Not the Code
Many software engineering organizations focus primarily on code-related metrics, but writing code is just one small piece of the larger business value stream—and rarely the area with the greatest opportunities for improvement. Optimizing code creation can create a false sense of progress at best and, at worst, introduce unintended bottlenecks that negatively impact the broader system.
High-performing engineering organizations recognize this risk and instead measure the effectiveness of the entire system when evaluating the impact of changes and decisions. Instead of focusing solely on PR cycle time or commit activity, top-performing teams assess the entire journey:
- Idea generation – How long does it take to move from concept to development?
- Development process – Are teams working efficiently? Are bottlenecks slowing down releases?
- Deployment & adoption – Once shipped, how quickly is the feature adopted by users?
- Business outcomes – Did the feature drive revenue, retention, or efficiency improvements?
For example, reducing code review time by a few hours may seem like an efficiency win, but if completed code sits for six weeks before deployment, that improvement has little real impact. While this may sound intuitive, in practice, it’s far more complicated—especially in matrixed or hierarchical organizations, where different teams own different parts of the system. In these environments, it’s often difficult, though not impossible, for one group to influence or improve a process owned by another.
One of our customers, a major media brand, had excellent coding metrics yet still struggled to meet sprint goals. While they were delivering work at the expected rate and prioritizing the right items, the perception of “failed sprints” persisted, creating tension for engineering leadership. After further analysis, we uncovered a critical misalignment: work was being added to team backlogs after sprints had already started, without removing any of the previously committed tasks. This shift in scope wasn’t due to engineering inefficiency—it stemmed from the business analysts' prioritization sessions occurring after sprint commitments were made. A simple rescheduling of prioritization ceremonies—ensuring that business decisions were finalized before engineering teams committed to sprint goals. This small yet system-wide adjustment significantly improved delivery consistency and alignment—something that wouldn’t have been possible without examining the entire end-to-end process.
3. Shifting from Tactical Metrics to Strategy
There are many frameworks, methodologies, and metrics often referenced as critical to the engineering insights conversation. While these can be useful, they are not inherently valuable on their own. Why? Because it all comes down to strategy. Focusing on managing a specific engineering metric or framework (i.e. DORA or SPACE) is missing the forest for the trees. Our most successful customers have a clear, defined, and well-communicated strategy for their software engineering insights program—one that doesn’t focus on metrics by name. Why? Because unless a metric is mapped to something meaningful to the business, it lacks the context to be impactful.
Strategic engineering leaders at large organizations focus on business-driven questions, such as:
- Is this engineering investment improving customer experience?
- Are we accelerating revenue growth?
- Is this new approach or tool improving cross-functional collaboration?
Tracking software engineering metrics like cycle time, PR size, or deployment frequency can be useful indicators, but they are output metrics—not impact metrics. Mature organizations go beyond reporting engineering speed and instead ask: "Did this speed up product releases in a way that drove revenue?"
While challenging to measure, this is where true business value lies. A 10% improvement in cycle time may indicate progress, but if sales remain flat, did it actually move the needle? Instead of optimizing isolated metrics, engineering leaders should align their focus with overarching business strategy. If an engineering metric doesn’t directly map to a key strategic imperative, it’s worth reevaluating whether it’s the right thing to measure.
One of our retail customers accelerated the release of a new digital capability, allowing them to capture additional revenue a full quarter earlier than anticipated. Not only did this directly increase revenue, but the extended timeline of revenue generation created a long-term financial impact—a result that finance teams, investors, and the board highly valued. The team was able to trace their decisions back to insights derived from their engineering data, proving the direct connection between software delivery and business success.
Understanding the broader business strategy isn’t optional for high-performing engineering organizations—it’s a fundamental requirement. Through our developer experience surveys, we’ve observed a significant difference between the highest-performing organizations and the rest as it relates to how well developers understand the business impact they are responsible for delivering. Organizations that treat engineers as task-takers, isolated from business impact, consistently underperform—even if their coding efficiency is exceptional. The engineering leaders at top-performing organizations prioritize alignment with strategy and avoid the distraction of tactical metrics that fail to connect to meaningful business outcomes.
Learn how to shift from micro engineering adjustments to strategic business impact. Request a Code Climate Diagnostic.
Technology is evolving very quickly but I don't believe it's evolving as quickly as expectations for it. This has become increasingly apparent to me as I've engaged in conversations with Code Climate's customers, who are senior software engineering leaders across different organizations. While the technology itself is advancing rapidly, the expectations placed on it are evolving at an even faster pace, possibly twice as quickly.
New Technology: AI, No-Code/Low-Code, and SEI Platforms
There's Generative AI, such as Copilot, the No-code/Low-code space, and the concept of Software Engineering Intelligence (SEI) platforms, as coined by Gartner®. The promises associated with these tools seem straightforward:
- Generative AI aims to accelerate, improve quality, and reduce costs.
- No-code and Low-code platforms promise faster and cheaper software development accessible to anyone.
- SEI platforms such as Code Climate enhance productivity measurement for informed decisions leading to faster, efficient, and higher-quality outcomes.
However, the reality isn’t as straightforward as the messaging may seem:
- Adopting Generative AI alone can lead to building the wrong things faster.
- No-code or Low-code tools are efficient until you hit inherent limitations, forcing cumbersome workarounds that reduce maintainability and create new challenges compared to native code development.
- As for SEI platforms, as we've observed with our customers, simply displaying data isn't effective if you lack the strategies to leverage it.
When I joined Code Climate a year ago, one recurring question from our customers was, "We see our data, but what's the actionable next step?" While the potential of these technologies is compelling, it's critical to address and understand their practical implications. Often, business or non-technical stakeholders embrace the promises while engineering leaders, responsible for implementation, grapple with the complex realities.
Navigating New Technology Expectations and Realities
Software engineering leaders now face increased pressure to achieve more with fewer resources, often under metrics that oversimplify their complex responsibilities. It's no secret that widespread layoffs have affected the technology industry in recent years. Despite this, the scope of their responsibilities and the outcomes expected from them by the business haven't diminished. In fact, with the adoption of new technologies, these expectations have only increased.
Viewing software development solely in terms of the number of features produced overlooks critical aspects such as technical debt or the routine maintenance necessary to keep operations running smoothly. Adding to that, engineering leaders are increasingly pressured to solve non-engineering challenges within their domains. This disconnect between technical solutions and non-technical issues highlights a fundamental gap that can't be bridged by engineering alone—it requires buy-in and understanding from all stakeholders involved.
This tension isn't new, but it's becoming front-and-center thanks to the promises of new technologies mentioned above. These promises create higher expectations for business leaders, which, in turn, trickle down to engineering leaders who are expected to navigate these challenges, which trickle down to the teams doing the work. Recently, I had a conversation with a Code Climate customer undergoing a significant adoption of GitHub Copilot, a powerful tool. This particular leader’s finance team told her, "We bought this new tool six months ago and you don't seem to be operating any better. What's going on?" This scenario reflects the challenges many large engineering organizations face.
Navigating New Technology Challenges and Taking Action
Here's how Code Climate is helping software engineering leaders take actionable steps to address challenges with new technology:
- Acknowledging the disconnect with non-technical stakeholders, fostering cross-functional alignment and realistic expectations. Facilitating open discussions between technology and business leaders, who may never have collaborated before, is crucial for progress.
- Clearly outlining the broader scope of engineering challenges beyond just writing code—evaluating processes like approval workflows, backlog management, and compliance mandates. This holistic view provides a foundation for informed discussions and solutions.
- Establishing a shared understanding and language for what constitutes a healthy engineering organization is essential.
In addition, we partner with our enterprise customers to experiment and assess the impact of new technologies. For instance, let's use the following experiment template to justify the adoption of Copilot:
We believe offering Copilot to _______ for [duration] will provide sufficient insights to inform our purchasing decision for a broader, organization-wide rollout.
We will know what our decision is if we see ______ increase/decrease.
Let’s fill in the blanks:
We believe offering Copilot to one portfolio of 5 teams for one quarter will provide sufficient insights to inform our purchasing decision for a broader, organization-wide rollout.
We will know what our decision is if we see:
- An increase in PR Throughput
- A decrease in Cycle Time
- No negative impact to Rework
- No negative impact to Defect Rate
Andrew Gassen leads Code Climate's enterprise customer organization, partnering with engineering leaders for organization-wide diagnostics to identify critical focus areas and provide customized solutions. Request a consultation to learn more.

Understanding the performance of engineering teams at large companies is no easy feat. For many, this is due to the diversity of processes across teams and the resulting complexity of collecting consistent data. Companies need a standard way of measuring and understanding engineering performance and a common language to communicate it to company leaders and individual contributors. In this article, we’ll discuss how large organizations leverage DORA metrics to do just that.
Using DORA DevOps metrics to communicate with leadership
In startups, engineering actions are often more directly linked to business goals, making it possible for leaders to understand what engineering is doing and communicate its impact. For example, if a startup is launching its flagship product, contributors from sales, marketing, and product management collaborate with engineering, often with executive support and oversight, to ensure the business goals are met. They consider what the product does, how it works, why it matters, who will benefit from it, and how it will be sold. Startups often have shared key performance indicators (KPIs) and operate on a single timeline.
Now scale that same workflow across dozens of teams launching and maintaining different products on varying timelines. While engineering will aim to align goals with business objectives, those goals may vary from team to team, and success will look different for each group. That’s why it’s crucial to establish which metrics are important to the company as a whole and create a framework to measure them. Establishing a framework to measure engineering success ensures that managers are measuring teams in a consistent and equitable way so they can identify and resolve bottlenecks to optimize the flow of work.
Using a framework like DORA is a great place to start. The four DORA metrics, Deployment Frequency (DF), Mean Lead Time for Changes (MLTC), Mean Time to Recover (MTTR), and Change Failure Rate (CFR), can be communicated to leadership to give them a holistic view of how the engineering organization is performing.When implementing DORA, it’s important that organizations start by agreeing on how these metrics will be measured. Unified calculations and standards (i.e. company-wide agreement on what is considered an "outage") are critical for measuring effectively throughout an organization. Standardizing on these four metrics and how they will be measured provides uniformity across teams and creates a common language between engineering and company leadership.
DORA metrics help teams balance speed and stability and are good big-picture checks into the health of the organization. Managers can use DORA to see how things are trending over time and spot when a team isn't working as expected. However, they must keep in mind that while it can be instructive to benchmark teams within an organization by identifying what high-performing teams are doing that others can learn from, it's important to note the context. Managers must understand that teams tasked with different kinds of work and different projects will naturally have variations in their DORA metrics, which is normal and expected.
Supporting developers with granular engineering metrics
Using DORA as the foundational framework across teams lets engineering leaders understand how a team is doing within the context of the broader organization and drill down into data from a specific team to learn more about the way it's working. DORA metrics can highlight areas worth attention, serving as a starting point from which managers and their teams can investigate the efficacy of their processes and make changes, then track the impact of those changes.
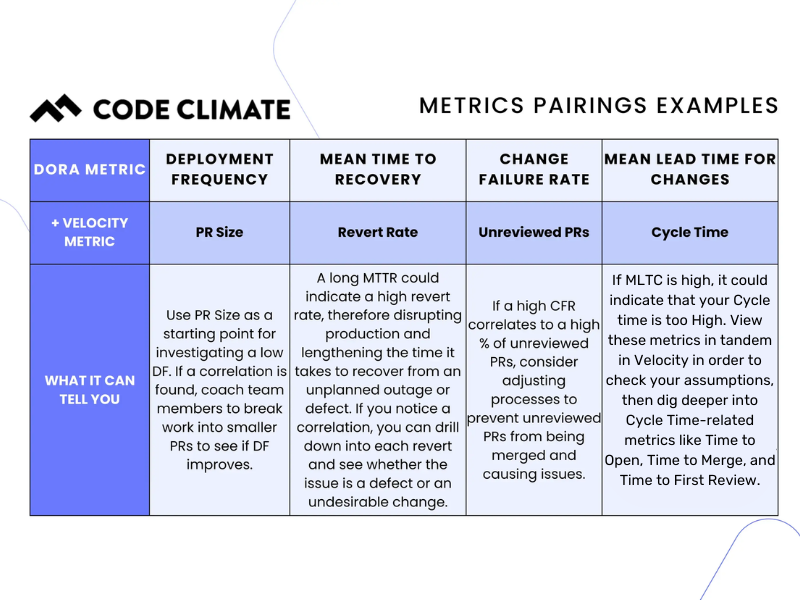
To do this, they can add context to the four DORA metrics and pair them with complementary metrics to get more insight into what’s happening with individual teams and what improvements might be useful. Common metrics pairings include:
- Change Failure Rate and Unreviewed Pull Requests. If a high CFR is correlated to a high percentage of unreviewed PRs, managers may consider adjusting the process to prevent unreviewed PRs from being merged and causing issues.
- Deployment Frequency and PR Size. If DF is low, managers can use PR size to investigate it. If large PRs are correlated with a low DF, they can coach team members to break work into smaller PRs to see if DF improves.
- Mean Time to Recovery and Revert Rate: A long MTTR could indicate a high Revert Rate, therefore disrupting production and lengthening the time it takes to recover from an unplanned outage or defect. If there’s a correlation, managers can drill down into each revert and see whether the issue is a defect or an undesirable change.
- Mean Lead Time for Changes and Cycle Time. If MLTC is high, it could indicate that Cycle Time is also high. Managers can view these metrics in tandem and dig deeper into related metrics like Time to Open, Time to Merge, and Time to First Review to find the root cause.
How DORA software creates a common language from ICs to the C-suite
Large companies can benefit from a Software Engineering Intelligence (SEI) platform to understand engineering performance at every level of the organization. It allows engineering managers to standardize measurement and reporting on the four DORA metrics to communicate performance to company leadership and ensure that the pace of work meets business needs. Managers can also combine DORA with other engineering metrics in their SEI platform to communicate with their teams to ensure they have what they need to be successful and roadblocks are quickly identified and removed.
Without a strong framework and a centralized platform to measure it, engineering data can become a tangled mess as the number of engineers at a company increases. Measuring DORA and complimentary engineering metrics in an SEI platform helps leaders make sense of their data to ensure that engineering work is optimized and aligned with business objectives.
To find out more about how an SEI platform can benefit leaders at large organizations, request a consultation.request a consultation.

The four DORA Metrics — Deployment Frequency, Change Failure Rate, Mean Time to Recovery, and Mean Lead Time for Changes — were identified by the DevOps Research and Assessment group as the metrics most strongly correlated to a software organization’s performance.
These metrics are a critical starting point for engineering leaders looking to improve or scale DevOps processes in their organizations. DORA metrics measure incidents and deployments, which can help you balance speed and stability. When viewed in isolation, however, they only tell part of the story about your engineering practices.
To begin to identify how to make the highest-impact adjustments, we recommend viewing these DORA metrics in tandem with their non-DORA counterparts, which can be done through Velocity’s Analytics module. These close correlations will help are a great starting point if you're looking for opportunities to make improvements, or might highlight teams that are doing well and might have best practices that could scale across the organization.
While there is no one-size-fits-all solution to optimizing your DevOps processes, certain pairings of metrics are logical places to start.
DORA Metric: Change Failure Rate
Velocity Metric: Unreviewed Pull Requests
Change Failure Rate is the percentage of deployments causing a failure in production, while Unreviewed Pull Requests (PRs) refers to the percentage of PRs merged without review (either comments or approval).
How can you identify the possible causes of high rates of failures in production? One area to investigate is Unreviewed PRs. Code review is the last line of defense to prevent mistakes from making it into production. When PRs are merged without comments or approval, you’re at a higher risk of introducing errors into the codebase.
In Velocity’s Analytics module, choose Unreviewed PRs and Change Failure Rate to see the relationship between the two metrics. If you notice a high Change Failure Rate correlates to a high percentage of Unreviewed PRs, you have a basis for adjusting processes to prevent Unreviewed PRs from being merged.
Engineering leaders may start by coaching teams to improve on the importance of code review so that they make it a priority, and if necessary, setting up a process that assigns reviews or otherwise makes it more automatic. If you’re using Velocity, you can note the date of this change right in Velocity in order to observe its impact over time. You can take this data to your team to celebrate successes and motivate further improvements.
For reference, according to the State of DevOps report for 2022, high-performing teams typically maintain a CFR between 0-15%.
DORA Metric: Deployment Frequency
Velocity Metric: PR Size
Deployment Frequency measures how frequently the engineering team is successfully deploying code to production, and PR Size is the number of lines of code added, changed, or removed.
Our research shows that smaller PRs pass more quickly through the development pipeline, which means that teams with smaller PRs are likely to deploy more frequently. If you’re looking to increase Deployment Frequency, PR size is a good place to start your investigation.
If you view these two metrics in tandem and notice a correlation, i.e. that a larger PR Size correlates to a lower Deployment Frequency, encourage your team to break units of work into smaller chunks.
While this may not be the definitive solution for improving Deployment Frequency in all situations, it is the first place you might want to look. It’s important to note this change and observe its impact over time. If Deployment Frequency is still trending low, you can look at other metrics to see what is causing a slowdown. Within Velocity’s Analytics module, you also have the ability to drill down into each deploy to investigate further.
DORA Metric: Mean Time to Recovery
Velocity Metric(s): Revert Rate or Defect Rate
Mean Time to Recovery (also referred to as Time to Restore Service) measures how long it takes an engineering team to restore service by recovering from an incident or defect that impacts customers.
Debugging could account for a significant amount of the engineering team’s time. Figuring out specifically which areas in the codebase take the longest time to recover could help improve your MTTR.
In Analytics, you can view MTTR and Revert Rate or Defect Rate by Application or Team. Revert Rate is the total percentage of PRs that are “reverts”— changes that made it through the software development process before being reversed — which can be disruptive to production. These reverts could represent defects or wasted efforts (undesirable changes). Defect Rate represents the percentage of merged pull requests that are addressing defects.
By viewing these metrics side by side in the module, you can see which parts of the codebase have the most defects or reverts, and if those correlate to long MTTRs (low-performing teams experience an MTTR of between one week and one month).
If you notice a correlation, you can drill down into each revert, speak to the team, and see whether the issue is a defect or an undesirable change. To prevent defects in the future, consider implementing automated testing and/or code review. To prevent wasted efforts, the solution may lie further upstream. This can be improved by focusing on communication and planning from the top down.
DORA Metric: Mean Lead Time for Changes
Velocity Metric: Cycle Time
Mean Lead Time for Changes is the time it takes from when code is committed to when that code is successfully running in production, while Cycle Time is the time between a commit being authored to a PR being merged. Both are speed metrics, and can offer insight into the efficiency of your engineering processes.
Low performing teams have an MLTC between one and six months, while high-performing teams can go from code committed, to code running in production in between one day and one week.
If your team is on the lower-performing scale for MLTC, it could indicate that your Cycle Time is too high or that you have issues in QA and testing. View these metrics in tandem in Velocity in order to check your assumptions. If your Cycle Time is high, you can dig deeper into that metric by investigating corresponding metrics, like Time to Open, Time to Merge, and Time to First Review.
Conversely, if your Cycle Time is satisfactory, the problem could lie with deployments. You should investigate whether there are bottlenecks in the QA process, or with your Deploy Frequency. If your organization only deploys every few weeks, for example, your team’s PRs could be merged but are not being deployed for a long time.
The power of DORA metrics in Analytics
DORA metrics are outcome-based metrics which help engineering teams identify areas for improvement, yet no single metric can tell the whole story of a team’s performance. It’s important to view DORA metrics with engineering metrics to gain actionable insights about your DevOps processes.
To learn more about using DORA metrics in Velocity, talk to a product specialist.

In the midst of pandemic lockdowns, VTS, a leading provider of commercial real estate technology, was in a period of rapid growth. In addition to aggressive hiring, VTS grew through acquisitions, adding Rise Buildings and Lane to its portfolio. Soon after onboarding, they discovered the new teams had less effective SDLC processes, which caused Cycle Time to trend toward 80 hours — nearly double the average Cycle Time of the core VTS team.
Engineering leadership leaned heavily on Code Climate as they incorporated the new teams and integrated the new products into the VTS platform. They leveraged Code Climate's partnership to investigate bottlenecks, and discovered the teams were spending Cycle Time resolving issues and needed more efficient workflows.
Fostering an Elite Engineering Culture
Being customer-obsessed and striving for excellence are the core tenets are the foundation of VTS culture. And for engineering, these values drive an ambitious vision of producing elite engineering talent who innovate to serve customers, achieve business outcomes, and positively impact the broader tech industry.
With more than 20 teams and 200-plus engineers, VTS fosters a high-caliber engineering culture built on mutual trust. They have collectively embraced a vision of engineering excellence, and they leverage Code Climate to measure proficiency and success, surface bottlenecks, and actively explore ways to improve. Code Climate's solution delivers end-to-end visibility into the entire development pipeline, which is crucial for tracking engineering progress and achieving OKRs with a large, distributed team.
Prashanth Sanagavarapu, Head of Platform Engineering at VTS, said without these insights, every decision would be a shot in the dark. “As a manager, my worst nightmare is running blind. I need to make decisions based on data and facts, and Code Climate provides exactly what we need.”
Metrics That Matter
For VTS, Code Climate provides visibility into the metrics that matter, and it is more intuitive and robust than what is built into other engineering tools. For example, Jira reporting was inadequate because it lacked context, and engineering leaders couldn’t compare metrics to industry standards.
“An ops team may close 100 tickets, but what does that mean? Someone has to go into each ticket and read the description to understand what is happening, and that just isn’t sustainable,” said Sanagavarapu.
Code Climate allows them to analyze factors like Pull Request (PR) size, frequency, and time to close, enabling them to optimize workflows to consistently deliver incremental value and maintain engineering velocity. Sanagavarapu said he learns quite a lot through the platform: “It’s a fact tool for me. I can see the trends of what is working and what isn’t working for a particular squad and correlate it back to sprint retros.”
Cycle Time is the north star metric at VTS. Measuring Cycle Time every two weeks with Code Climate provides visibility into how fast they are shipping, both organization-wide and at the team level, and it enables them to quickly see when fluctuations occur. Then, within the platform, they can easily drill down to identify choke points and dependencies that may be impacting performance. Understanding if the Cycle Time went up due to outages, open RFCs, or a change in personnel helps leaders to understand trends and better allocate resources to ensure their teams have what they need to be successful.
Sanagavarapu said the ability to drill down to the individual contributor level is very impactful because it allows you to diagnose problems at any level and scale. Since partnering with Code Climate, they have improved Cycle Time by 30% and doubled their deployment frequency.
“Our average Cycle Time tends to be around 35 hours with 48 hours as our max threshold. When we exceed that, we know there is something going on. If it’s not a holiday or another known factor, we can dig to discover and understand the problem and who is being impacted — then, we can solve it.”
Maintaining Excellence During Rapid Growth
Enhanced visibility has been crucial for engineering leadership over the past two years, with company growth accelerating during challenging pandemic lockdowns. Sanagavarapu said more than 60% of the company’s 600-plus employees joined during this time, most of whom were engineers.
Infrastructure stability was a big challenge, so they worked to reduce the number of incidents so that dev teams could spend more time on value-add work. When they discovered a lag time in PRs due to time zone differences, they changed their workflows to reduce the time for feedback and better manage resources across teams. They also added in more test cycles so that rework happened less frequently. Now, the entire engineering organization maintains Cycle time under its 48-hour threshold.
“Code Climate provided insights that helped us accelerate integrating those teams into our culture and processes more quickly and effectively,” Sanagavarapu said.
Measuring Impact
VTS leverages Code Climate's solution to track and quantify impact at all levels. Engineering leadership can measure business impact by translating metrics into stories that show how engineering delivers value. They can understand how quickly teams deliver new features that are important for customers and compare the time spent on new feature work to rework time to ensure engineering time and resources are optimized.
Code Climate surfaces important trends that help engineering managers better understand the impact of process and workflow changes on developer experience. They can drill down to the developer level to diagnose issues and determine what might be consuming a squad’s time. Visibility into engineering capacity helps planning for major initiatives, allowing them to best leverage internal resources and balance workloads with external contractors.
As VTS works continuously to innovate, evolve, and achieve both engineering and business milestones, the insights derived from Code Climate are invaluable, Sanagavarapu explained. “Code Climate is not a reporting tool. It’s the heart of engineering excellence.”
Request a consultation to learn how to maximize engineering impact.

Ten years ago, very few people tracked their steps, heart rate, or sleep. Sure, pedometers existed, as did heart rate monitors and clunky sleep monitors, but they weren’t particularly commonplace. Now, it’s not uncommon to know how many steps you’ve taken in a day, and many people sport metal and plastic on their wrists that monitor their activity, heart rate, and sleep quality.
What changed?
In the past, that information was inconvenient to access, and found in disparate places. Nowadays, fitness trackers and smart watches bring together all of that data so we can tap into it to make decisions.
Imagine this: I sit at my desk all day. I glance down at my fitness tracker and it says I’ve only taken 100 steps today. I feel really tired. What do I do? Take a walk? Drink another cup of coffee? Let’s say I take a walk. Awesome! A quick stroll to the park after lunch and I’ve reached my step goal of 8,000 steps! I feel great. I sleep well and my tracker says I got 8 hours.
The next day, faced with the same afternoon drowsiness, I skip the walk and opt for a second coffee. I sleep poorly, and when I wake up, I see that I only got 4 hours of sleep.
On the third day, instead of reaching for some caffeine, I choose to take a walk. It was a data-informed choice. Without the data, I might have ruined my sleep schedule by again drinking coffee too late in the day and later wondering why I felt so tired.
So, what does this have to do with engineering data? Ten years ago, the process of gathering engineering data involved a mishmash of spreadsheets, gut feel, and self-evaluation. Leaders faced a black hole with no easily accessible information in one place.
Code Climate Velocity changes that. Now, it’s possible to view trends from the entire software development lifecycle in one place without having to wrangle reports from Jira or comb through Github. Putting everything together not only makes the data more accessible, it makes it easier to make informed decisions.
Let’s say I want to boost code quality by adding second code reviews to my coding process. Sounds great, right? More eyes on the code is better? Not quite. The data we’ve gathered from thousands of engineering organizations shows that multiple review processes tend to negatively impact speed to market. Why? Naturally, by adding an additional step to the process, things take longer.
But what if those second reviews lead to higher code quality? Code Climate Velocity gives you insight into things like Defect and Rework Rates, which can validate whether quality increases by implementing second reviews. If the data within Velocity were to show that Cycle Time increases and second reviews have no effect on Defect Rate (or worse, if they increase Defect Rate), then maybe we shouldn’t have that second cup of coffee…er, second code review.
This is exactly the situation I ran into with a client of ours. A globally distributed engineering organization, they required two reviews as part of their development process. The second review typically depended on someone located multiple time zones ahead of or behind the author of the pull request. As a result, the team’s Cycle Time spanned multiple weeks, held up by second reviews that were often just a thumbs up. By limiting second reviews, the organization would save upwards of 72 hours per PR, cutting their Cycle Time in half. They would also be able to track their Defect Rate and Rework Rate to ensure there were no negative changes in code quality.
We don’t want to know that drinking a second cup of coffee correlates with poor sleep — that is scary. But by being alerted to that fact, we are able to make informed decisions about what to do and how to change our behaviors. Then, we can measure outcomes and assess the efficacy of our choices.
There is a common misconception that applying metrics to engineering is scary — that it will be used to penalize people who don’t meet arbitrary goals. Just as smart watches don’t force you to take steps, engineering data doesn’t force your hand. Code Climate Velocity presents you with data and insights from your version control systems, project management systems, and other tools so that you can make data-informed choices to continue or change course and then track the outcome of those choices. Like fitness and sleep data, engineering data is a tool. A tool that can have immense value when used thoughtfully and responsibly.
Now, go reward yourself with some more steps! We’ve brought the wonderful world of data into our everyday lives, why not into engineering?
To find out what kinds of decisions a Software Engineering Intelligence platform like Velocity can help inform, reach out to one of our specialists.

The final principle in the Agile manifesto urges developers to reflect on the past and use that knowledge to improve future outcomes. Since we learn from the past, holding sprint retrospectives is key to improving the results of future iterations. Conducted well, sprint retrospectives can boost outputs and propel teams forward; conducted poorly, they may breed toxicity. The careful use of objective data can help you steer your retro in the right direction — read on to find out how to leverage data from the beginning to the end of the retrospective process, so you can maximize the value of this key opportunity for continuous improvement.
Preparing for Your Sprint Retrospective
Practices vary by organization, but sprint retrospectives may be facilitated by anyone familiar with the sprint, from a developer on the team to a stakeholder from another department. If you find yourself in the facilitator role, it’s crucial that you build a strong foundation for your retro by performing an audit to collect data in advance.
Look back on the lifetime of the sprint, and ask yourself questions like:
- What was finished?
- Did we deliver all the items we intended to? If not, why?
- What specific units of work didn’t get shipped?
- What bottlenecks or blockers arose, and are they part of a pattern?
The answers will help you identify patterns and problem areas and formulate meaningful conversation points to guide the retrospective.
For example, if your sprint finished with a lot of unshipped work, you’ll want to know that in advance, so you can dig into the reasons during the retrospective. Look for unassigned tickets, which may indicate that some units of work were not prioritized correctly or that tickets were lost or overlooked unintentionally — though you’ll need to bring these tickets up at the retro to know for sure.
You’ll also want to look at the Issues from the iteration that are still categorized as In Progress, and see how many days they’ve been open. You can dig deeper by looking at the Pull Requests (PRs) associated with that Issue, and taking a look at relevant activity and comments for each. This can help you formulate a hypothesis as to why a unit of work was unshipped. For example, Issues with many PRs may indicate that work was not batched efficiently, while PRs with high levels of Rework may signal that an engineer was struggling with a difficult area of the codebase, or unclear technical direction. You can further investigate that hypothesis during your retro by discussing particular units of work to gain additional context and information.
While you can piece together this information from your VCS and project management tools, gaining a holistic view can be tedious as this data is typically dispersed. A Software Engineering Intelligence solution, like Code Climate, can save time and add a layer of valuable insights by aggregating that data in a series of customizable dashboards and rich visualizations.
Prioritize Your Sprint Retrospective
Typically, retrospectives last approximately 30 minutes for each week of the sprint, so if your sprint was three weeks long, you may want to carve out an hour and a half for your retro. Keep this time frame in mind to help you prioritize speaking points and focus on conversation topics that will keep your team engaged and on task.
Once you have compiled a list of topics, see if you discover any common themes and group them together. It may be helpful to get the perspective of your team members when you reach this point. Here at Code Climate, our facilitators ask the team to vote on which items should be talked through first to ensure engagement and alignment.
Open the Floor to Collaboration
In order to have a productive retrospective — one that surfaces meaningful opportunities for improvement — the team must feel safe talking through any missteps. The purpose of a retrospective is to measure processes, not individuals, so it’s important to remind your team to focus on the work, and not on the people behind it. As you set the stage for your retro, keep in mind that the data you gathered during preparation is to be used purely as an empowerment tool. When used appropriately, data can keep the conversation grounded in facts and tackle negative biases, allowing you and your team to have genuine conversations about things that could have been done better without making developers feel singled out.
Discuss
Now to discuss. Based on the topics you prioritized, you can split your sprint retrospective discussion portion into easily digestible parts. Though format can vary based on team and personal preference, many teams focus on three categories using a “Start, Stop, Continue” exercise, which asks developers to provide feedback on the following:
- Start: Actions we should start taking
- Stop: Actions we should stop or do away with
- Continue: Actions we should continue and codify
It can be helpful to use a visual aid to facilitate this exercise and keep the conversation on track. For in-person teams, that might mean distributing sticky notes that can be written on and affixed to a board; for remote teams, that might mean using a collaborative online platform like Trello. Take time to talk through each part, and…
Develop an Action Plan
By the end of the sprint retrospective, you and your team should have several actionable ideas to put into practice to help the next iteration go smoother. While this data is qualitative in nature, these new ideas can then be measured against the quantitative data (such as PR size) they are meant to improve during the next sprint, enabling you to enhance software development strategies as time goes on.
Standardize Sprint Retrospectives and Keep Improving
Best practices are best utilized when reinforced. Each new retro you hold keeps you on the path of continuous improvement.
While there is no golden rule as to how retros should be structured and held, some form of review is vital to achieving continuous improvement. By incorporating data into your retros, you can maximize the value of your discussions and help build a highly capable team that can successfully drive business goals.