Use Cases
Engineering metrics can be a powerful tool for tracking and communicating engineering progress, debugging processes, boosting team performance, and much more – but they must be wielded with care. When misused, metrics can backfire, creating confusion and resentment.
To help engineering leaders successfully leverage metrics, Code Climate has partnered with LeadDev on a series of blog posts and webinars that explore the fundamentals of data-driven leadership. Drawing on the expertise of engineering leaders from a range of industries, we highlight real-world perspectives on the what, why, and how of measuring as an engineering leader. We touch on everything from selecting the best metrics to track for your organization, to introducing metrics successfully, and specific use cases, like using metrics to run more impactful standups.
Here are some key insights:
- “I’ve found that metrics are valuable in helping zero in on what might be getting in the team’s way. Instead of treating them as a way to judge performance, I believe metrics are most useful in bringing to light areas of opportunity.” Leslie Cohn-Wein, Engineering Manager, Netlify
- “First and foremost, I use metrics to help me identify what the biggest bottlenecks are across different teams. Without metrics, I’d be left to make this judgment based on hearsay instead of methodology. The second reason I use metrics is to understand changes over time, particularly as we undergo organizational changes or make investments in specific areas.” Abi Noda, Developer Experience Expert
- “Cycle Time is a metric that I consistently come back to — it’s a great proxy for engineering speed, and can be a useful high-level look at whether certain key decisions are having the desired impact. If we’re moving slower than we had been, I can then isolate parts of the engineering pipeline and investigate where exactly things are going off track.” James McGill, VP of Engineering, Code Climate
- “The outcomes of productive standups ripple throughout the engineering team. By discussing specific metrics in standups, you can tell if your team is moving forward. You can ensure that the risks are being addressed from an objective, quantifiable standpoint rather than opinion.” Khan Smith, VP of Product, Code Climate
To dig deeper into what engineering leaders are doing today with metrics, check out the full series.
Ready to get started with engineering metrics in your organization? Contact our product specialists.

A good leader can respond to issues and course correct in the moment, but a great leader is proactive about staying ahead of the curve. With the help of data provided by Engineering Intelligence tools, an Engineering Manager can gain visibility into the development pipeline and stay equipped with the knowledge needed to cut problems off at the pass. No matter where an EM is in their professional lifecycle, a proactive one can prioritize more successfully, strengthen coaching strategies, and boost team effectiveness in the short term, mid-term, and long term.
Short Term Strategy: Spot Risk and Prevent Blockages
A lot of dedication goes into keeping sprints on track and software delivery on schedule. With so many moving parts in the development pipeline, an EM may find it tough to determine what needs their attention first, making it challenging to triage risks. However, by using a Software Engineering Intelligence platform — like Code Climate — that conveys insights based on aggregated data, an EM can swiftly analyze coding progress and prioritize their task list to focus on what’s most important.
For example, an EM can assess PR and Commit data to surface at-risk work — work that could benefit from their time and attention. If a Commit has had several days of inactivity and work on the associated PR has seemingly halted, it may indicate that the scope of the task is not clear to ICs, and that they require guidance. Or it may be a sign of task-switching, where too much Work In Progress pulls an IC’s focus and makes it difficult to complete work.
This is where data from a Software Engineering Intelligence platform is critical, as it can signal to a manager that a specific PR or Issue needs attention. Code Climate enables EMs to set Risk Alerts for PRs based on custom criteria, since risk thresholds vary from team to team. From there, the EM can use that information in standups, retros, and other conversations with ICs to help identify the root cause of the blocker and provide coaching where needed.
Mid-term Strategy: Improve Collaboration
As a proactive leader, an EM must understand the nuances of collaboration between all parties to ensure ICs and teams are working together effectively and prioritizing issues that are aligned with company goals. If teams fail to work cohesively, roadmaps may be thrown off course, deadlines may be missed, and knowledge silos may be created. Using their Engineering Intelligence tools, an EM can easily surface the quantitative data needed to gain visibility into team collaboration and interdepartmental alignment.
When it comes to collaboration on their team, an EM might want to look at review metrics, like Review Count. Viewing the number of PRs reviewed by each contributor helps an EM understand how evenly reviews are distributed amongst their team. Using these insights, a manager can see which contributors are carrying out the most reviews, and redistribute if the burden for some is too high. Doing so will not only help keep work in balance, but the redistribution will expose ICs to different parts of the codebase and help prevent knowledge silos.
To look at collaboration between teams, an EM can rely on quantitative data to help surface signs of misalignment. Looking at coding activity in context with information from Jira can help an EM identify PRs that signal a lack of prioritization, such as untraceable or unplanned PRs. Since these PRs are not linked back to initial project plans, it may indicate possible misalignment.
Long Term Strategy: Support Professional Growth and Improve Team Health
A proactive EM also needs to identify struggling IC’s, while simultaneously keeping high performers engaged and challenged to prevent boredom. This starts with understanding where each individual IC excels, where they want to go, and where they need to improve.
Using quantitative and qualitative data, an EM can gain a clearer understanding of what keeps each IC engaged, surface coaching opportunities, and improve collective team health. Qualitative data on each IC’s coding history — Commits, Pushes, Rework, Review Speed — can help signal where an IC performs well and surface areas where it might be useful for an EM to provide coaching. An EM can then use qualitative data from 1 on 1’s and retros to contextualize their observations, ask questions about particular units of work, or discuss recurring patterns.
For example, if an EM notes high levels of Rework, this signals an opportunity to open up a meaningful discussion with the IC to surface areas of confusion and help provide clarity. Or, an EM might see that an IC has infrequent code pushes and can coach the IC on good coding hygiene by helping them break work down into smaller, more manageable pieces that can be pushed more frequently.
Using a combination of both data sets, a manager can initiate valuable dialogue and create a professional development roadmap for each IC that will nurture engagement and minimize frustration.
Proactivity as an EM – The Long and Short of It
Proactivity is a skill that can be developed over time and enhanced with the help of data. Once empowered with the proper insights, EMs can more effectively monitor the health of their sprints, meet software delivery deadlines, keep engineers happy, and feel confident that they are well-informed and can make a marked, positive impact.

In the classic standup meeting, the onus is on individual contributors to come prepared. Questions are asked of the group — questions like “what are you working on?”, and “what blockers are you facing?” — and each team member has a turn to answer. Though this approach is theoretically designed to help facilitate alignment and detect possible issues before they derail sprints, it often results in non-engaging, ineffective meetings.
It’s not enough for a manager to pose broad questions and expect ICs to come prepared to discuss their work. To run a truly impactful standup, the expectation needs to be flipped. To ensure an engaging, high-value meeting, the Engineering Manager is the one who needs to show up prepared.
It’s Not Reasonable to Expect ICs to Surface All Potential Issues
When an IC is engaged with their work and invested in the outcome, it should be easy for them to show up at standup and give a status update. It’s getting to the next level that’s often difficult.
Even when you’ve done the work to foster psychological safety on your team, developers may still be hesitant to surface an issue or ask questions in a public forum. It’s not necessarily that they fear punishment or don’t want to appear uninformed — they may simply want the satisfaction of solving a tough problem before they share it with the team. Or, they may lack the context to realize that their teammates are working on a similar problem and that all of them would benefit from some discussion and collaboration.
And in the most blameless of cultures, where a developer feels comfortable flagging an issue or asking a question about their own work, it’s likely that same developer will hesitate to publicly bring up an issue that directly involves a teammate, for fear of being seen to call that teammate out.
Why it’s Critical for Engineering Managers to Show up for Standups Prepared
When an Engineering Manager walks into standup prepared, they can help guide their team past surface-level updates, towards higher-value conversations. A prepared manager has context — they understand how units of work fit together, and know when a team member’s work has critical downstream impacts, or when one developer has previously worked through an issue similar to one that another developer is struggling with.
With that perspective, it’s possible to make connections and facilitate conversations and collaboration. In a typical standup, a team member might just say they’re almost ready to ship a particular feature. Yet if the Engineering Manager comes prepared to that same standup, they’ll be able to have more informed conversations about the work. They might note that the developer’s work bounced back and forth in Code Review more than normal, and ask them if it would be helpful to take a step back and review the architecture. Or, they may flag an uptick in Rework, prompting the developer to volunteer that they’re working through a bug, and opening up an opportunity to pair them with a teammate who recently had a similar issue.
The information Engineering Managers need to prepare for standup is already there, in their VCS and project management tools. A Software Engineering Intelligence platform can help make it more accessible, pulling together data on everything from Code Review to Rework, and highlighting Pull Requests that aren’t moving through the development pipeline as expected.
If Engineering Managers take the time to review that data and gain context before standup, they’ll be able to help their team skip past the status update and spend their valuable meeting time having more impactful conversations — conversations that not only help move the work forward, but which improve alignment, foster collaboration, and help their team excel.

As you think about driving high performance on your team, it’s easy to focus on certain tangible improvements like optimizing processes, upskilling team members, and hiring new talent. But your team will only go so far if you neglect to cultivate a key aspect of team culture — psychological safety. Psychological safety, most commonly defined as the knowledge that you won’t be punished for making a mistake, is critical to the success of the highest performing organizations; it allows teams and individuals to have confidence in taking risks of all kinds, from the most basic risk of opening a Pull Request for feedback, to the larger leaps necessary to drive true innovation and stay ahead of the competition.
With the right data and a clear strategy for analysis, you’ll be able circumvent some common biases and assumptions, while fostering the psychological safety necessary to keep improving as a team.
Software Engineers Need Safety to Deploy
Safety is a prerequisite of speed; developers who aren’t confident in their code might become a bottleneck if they’re hesitant to open a PR and receive feedback. When your team has a culture of safety, that developer can feel more secure subjecting their work to the review process. They know they’ll have the opportunity to work through their mistakes, rather than being penalized for them.
Psychological safety is also critical at the other end of your software development pipeline. Developers need to feel secure enough to deploy code, and that security can be found on two levels: the confidence that their deployment won’t break things, and the trust that they won’t be punished if it does.
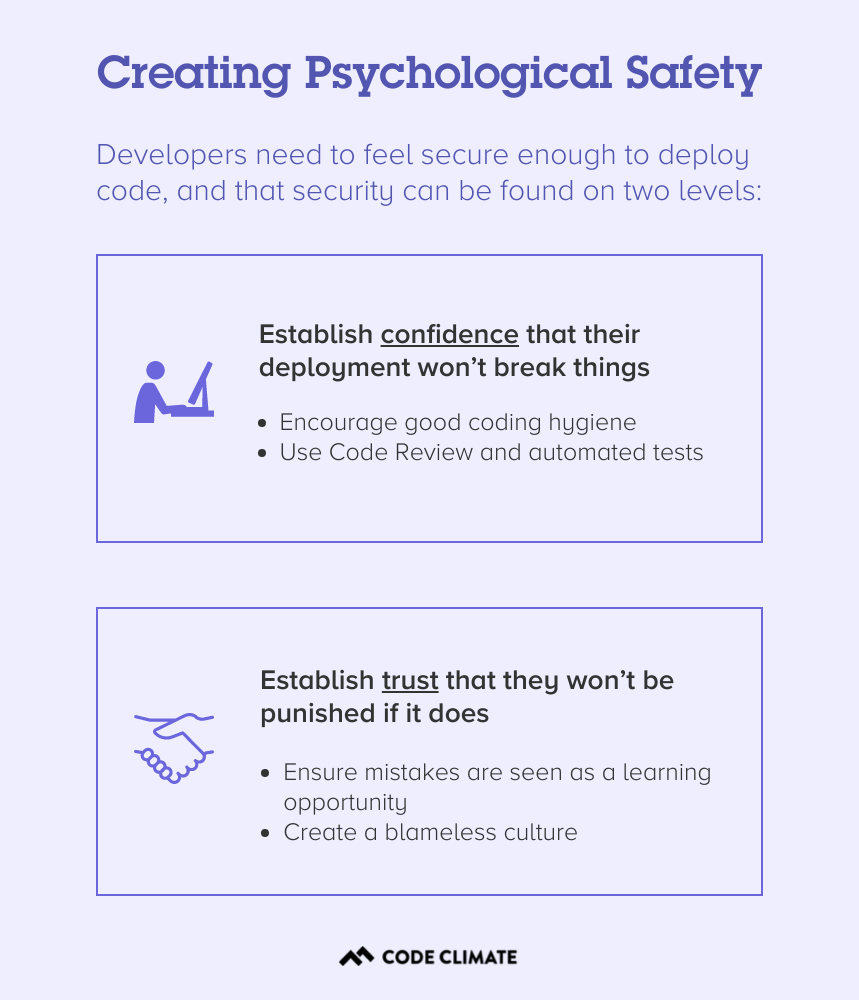
The first is mainly a factor of process and tooling. Code Review and automated tests can offer some degree of confidence that buggy code won’t be deployed, while good coding hygiene, specifically the practice of keeping Pull Requests as small as possible, will mean that any damaging changes are easier to identify and reverse.
The second level, the trust that a developer won’t be punished if their code introduces a bug or causes an incident, is a matter of culture. It’s an engineering leader’s responsibility to create a culture of psychological safety on their team, and to ensure that mistakes are seen as a learning opportunity, rather than an occasion for punishment. In a blameless culture, the work is evaluated and discussed independently of the person who completed it, and every member of a team stands to benefit from the learning experience.
Without this foundation of trust, your team will be hard-pressed to deploy quickly and consistently, let alone take the larger risks necessary to pursue big ideas, innovate, and stay ahead of your competition.
Using Data to Create Psychological Safety
Data can play a key role in your efforts to cultivate a culture of psychological safety. Whenever you introduce data in your organization, it’s important to do so responsibly — be transparent, put all data in context, and avoid using it to penalize members of your team. But used properly, clear, objective metrics can help you combat intrinsic biases and check your assumptions, while keeping conversations grounded in fact. This makes it easier to keep conversations focused on the work, rather than the person behind that work.
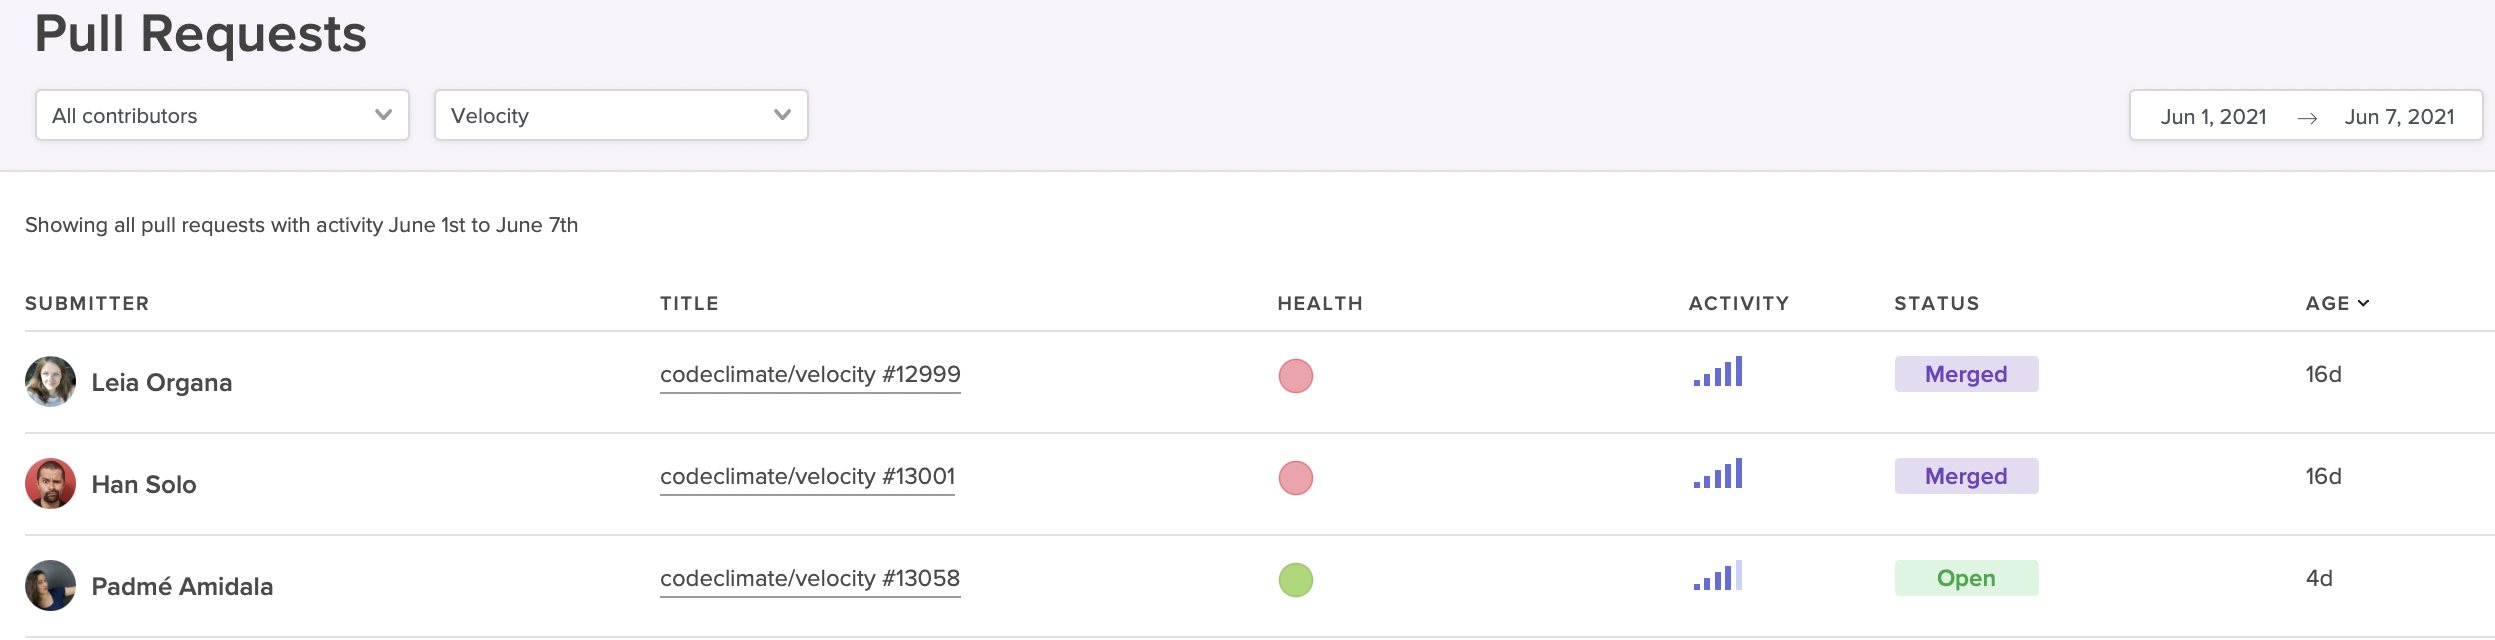
Surface high-activity Pull Requests that could be at risk of derailing your sprint.
For example, if a particular sprint is falling behind, you could frame the conversation in a general sense, asking the team why they’re moving slowly. But this framing risks putting your team members on the defensive — it could be construed as finding fault in your developers, and places blame on them for the slowdown.
With data from a Software Engineering Intelligence platform like Code Climate, it’s easier to ensure that discussions remain focused on the work itself. For instance, it’s possible to identify at-risk work before it derails your sprint. You can pull up a report that highlights long-running, high-activity Pull Requests, then dig into those PRs with your team. If you keep the conversation focused on those specific units of work, you’ll be better able to surface the particular challenges that are slowing things down and work through them together.
To find out how data can help you create psychological safety and drive performance in your organization, request a consultation.

Developers who are struggling to keep up, as well as those developers who are excelling but no longer growing, are likely to be unsatisfied in their current roles. But engineering leaders, especially managers of managers or those who are not involved in the day-to-day writing of code, may not have insight into who is in need of support and who is craving their next challenge.
With the right combination of quantitative and qualitative data, you’ll be able to spot opportunities to coach developers of all levels. You’ll also have an easier time setting and tracking progress towards concrete targets, which will empower your team members to reach their goals.
Start by Gathering Qualitative Engineering Data
Use your 1 on 1 time to initiate conversations with each of your team members about where they think their strengths and weaknesses lie, and what they’d like to improve. You may want to give your team members some time to prepare for these conversations, as it can be hard to make this sort of assessment on the spot.
Pay extra attention in standups and retros, keeping an eye out for any patterns that might be relevant, like a developer who frequently gets stuck on the same kind of problem or tends to surface similar issues — these could represent valuable coaching opportunities. It can also be helpful to look for alignment between individual goals and team objectives, as this will make it easier to narrow your focus and help drive progress on multiple levels.
Dig Into Quantitative Engineering Data
Next, you’ll want to take a closer look at quantitative data. A Software Engineering Intelligence platform like Code Climate can pull information from your existing engineering tools and turn them into actionable reports and visualizations, giving you greater insight into where your developers are excelling, and where they might be struggling. Use this information to confirm your team member’s assessment of their strengths and weaknesses, as well as your own observations.
You may find that an engineer who feels like they’re a a slow coder isn’t actually struggling to keep up with their workload because of their skill level, but because they’ve been pulled into too many meetings and aren’t getting as much coding time as other team members. In other cases, the quantitative data will surface new issues or confirm what you and your team member already know, underscoring the need to focus on a particular area for improvement.
A Code Climate customer and CTO finds this kind of quantitative data particularly helpful for ensuring new hires are onboarding effectively — and for spotting high-performers early on. As a new member of the team, a developer may not have an accurate idea of how well they’re getting up to speed, but data can provide an objective assessment of how quickly they’re progressing. James finds it helpful to compare the same metrics across new developers and seasoned team members, to find out where recent hires could use a bit of additional support. This type of comparison also makes it easier to spot new engineers who are progressing faster than expected, so that team leaders can make sure to offer them more challenging work and keep them engaged. Of course, as is true with all data, James cautions that these kinds of metrics-based comparisons must always be viewed in context — engineers working on different types of projects and in different parts of the codebase will naturally perform differently on certain metrics.
Set Concrete Engineering Goals
Once you’ve identified areas for improvement, you’ll want to set specific, achievable goals. Quantitative data is critical to setting those goals, as it provides the concrete measurements necessary to drive improvement. Work with each team member to evaluate the particular challenges they’re facing and come up with a plan of action for addressing them. Then, set realistic, yet ambitious goals that are tied to specific objective measurements.
This won’t always be easy — if a developer is struggling with confidence in their coding ability, for example, you won’t be able to apply a confidence metric, but you can find something else useful to measure. Try setting targets for PR Size or Time to Open, which will encourage that developer to open smaller Pull Requests more frequently, opening their work up to constructive feedback from the rest of the team. Ideally, they’ll be met with positive reinforcement and a confidence boost as their work moves through the development pipeline, but even if it does turn out their code isn’t up to par, smaller Pull Requests will result in smaller changes, and hopefully alleviate the overwhelming feeling that can come when a large Pull Request is met with multiple comments and edits in the review process.
Targets like these can be an important way to help developers reach their individual goals, but you can also use them to set team- or organization-wide goals and encourage progress on multiple fronts. Roger Deetz, VP of Engineering at Springbuk, used Code Climate to identify best practices and help coach developers across the organization to adopt them. With specific goals and concrete targets, the team was able to decrease their Cycle Time by 48% and boost Pull Request Throughput by 64%.
Though it’s certainly possible to coach developers and drive progress without objective data, it’s much harder. If you’re looking to promote high-performance on your team, look to incorporate data into your approach. You’ll be able to identify specific coaching opportunities, set concrete goals, and help every member of your team excel.

A retrospective is a time for our team to look back. Its function, however, is to improve the way in which we move forward. Let’s digest the original definition from Scrum:
“The Sprint Retrospective is an opportunity for the Scrum Team to inspect itself and create a plan for improvements to be enacted during the next Sprint.”
The first two components are activities, the third is a result. And while most teams have fruitful conversations and create action items to yield that result, few have systems in place to ensure that positive change is actually created.
- Inspect ✔
- Create a plan ✔
- Enact improvements 🤷♀️
The problem starts with the notion of “improvement.” It’s both vague and subjective, so any plan of activities feels like a step in the right direction (spoiler: it’s not). If you take measures to concretely define improvement, however, you can hold yourself and your team accountable to your action items. For that, we can use SMART goals.
SMART goals contextualize improvement
Research has shown that goals that are both specific and time-bound are considerably more likely to yield results than generic action items.
Putting a number and a date to each retrospective action item ensures:
- The department understands and aligns on what constitutes success, and
- Progress towards this goal is black and white – trending toward or away from the goal.
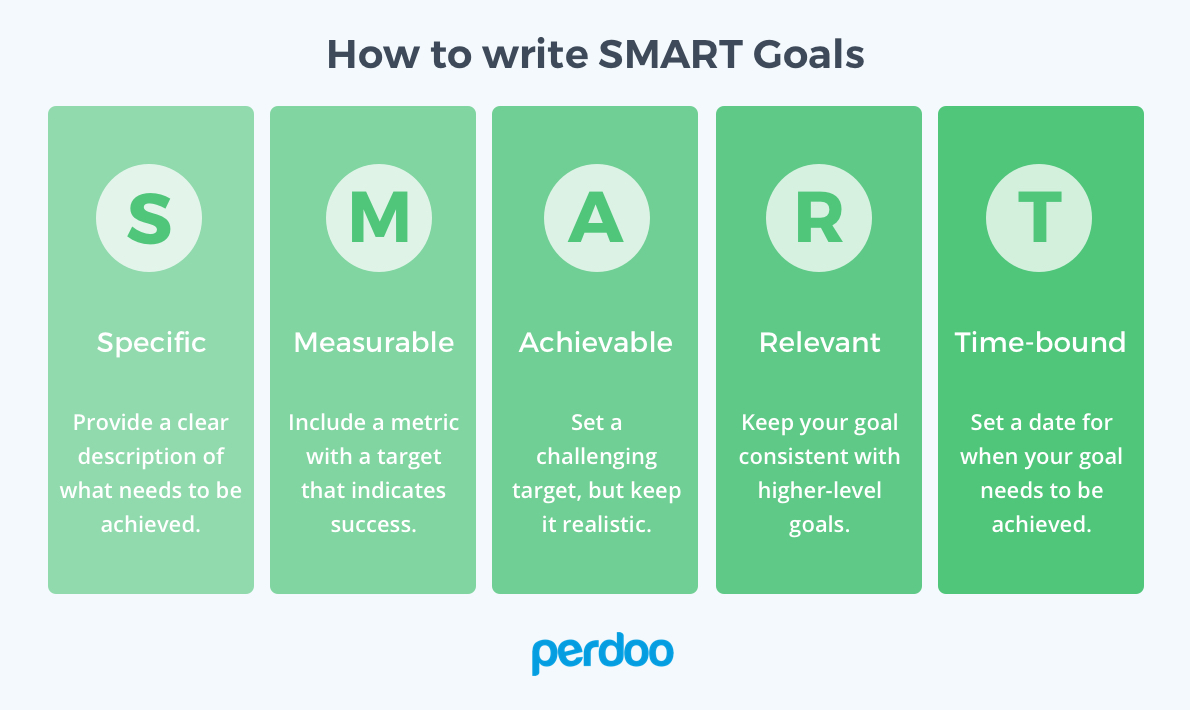
While there are plenty of systems that put a number and date to goals, but for the sake of this post, we’ll stick to one that’s tried-and-true: SMART (Specific, Measurable, Achievable, Relevant, Time-bound) goal-setting.
To best position your team to work with SMART goals, you’ll need to adjust all three components of the retro. You’ll be inspecting with more data, creating a plan using SMART goals, and enacting improvements by making progress transparent to everyone on the team.
Inspect: Use data to diagnose the biggest issues
Most teams decide on goals using only qualitative feedback. A team member raises what they perceived to be a large bottleneck, and the whole team immediately starts trying to mitigate that issue. This method gives precedence to what individuals remember and feel, not necessarily the largest and most pressing problems. While personal and anecdotal experience is vital to understanding how a problem affects the whole team, it doesn’t tell the whole story.
If you bring more data points into diagnosing the problem, however, you’re more likely to get a holistic understanding of each bottleneck. Quantitative data helps counteract recency bias and enables you to prioritize based on actual risk that the problems present to your team’s productivity.
Let’s say a given engineering team is trying to diagnose why they didn’t get to as many features as they anticipated this sprint. One engineer, Hannah, makes the following hypothesis:
I feel like there were more pull requests than usual that were open at any one given time. I think it’s because people were too busy to get to code reviews, so work piled up.
Several engineers nod their head. They also noticed that there were more open PRs than usual in GitHub.
Instead of immediately brainstorming action items, Hannah and her team investigate further. They start by looking at their Time to Review this past sprint, and realize it’s relatively low – just 6 hours. This is contradictory to Hannah’s assessment that the review process was slower than usual. From there, they see that their average number of Review Cycles is about 1.2, where most Pull Requests are approved after one review. Also, seems pretty good.
Finally, they found a red flag when they looked at their Time to Merge. They realize that many pull requests stay open for a long time after they’re reviewed as developers move on to new tracks of work. They then agreed to create a target for open lines of work, so that each team member would only work on one feature at a time.
The gut instinct of the team recognized the symptom– long running pull requests– but not the cause. Without data, they couldn’t have uncovered and addressed a deeper systemic problem.
Other data points you may consider looking at:
- All recent activities, including Pull Requests, Code Reviews, and Tickets, to remind your team of what they worked on last sprint, and where they might have gotten stuck.
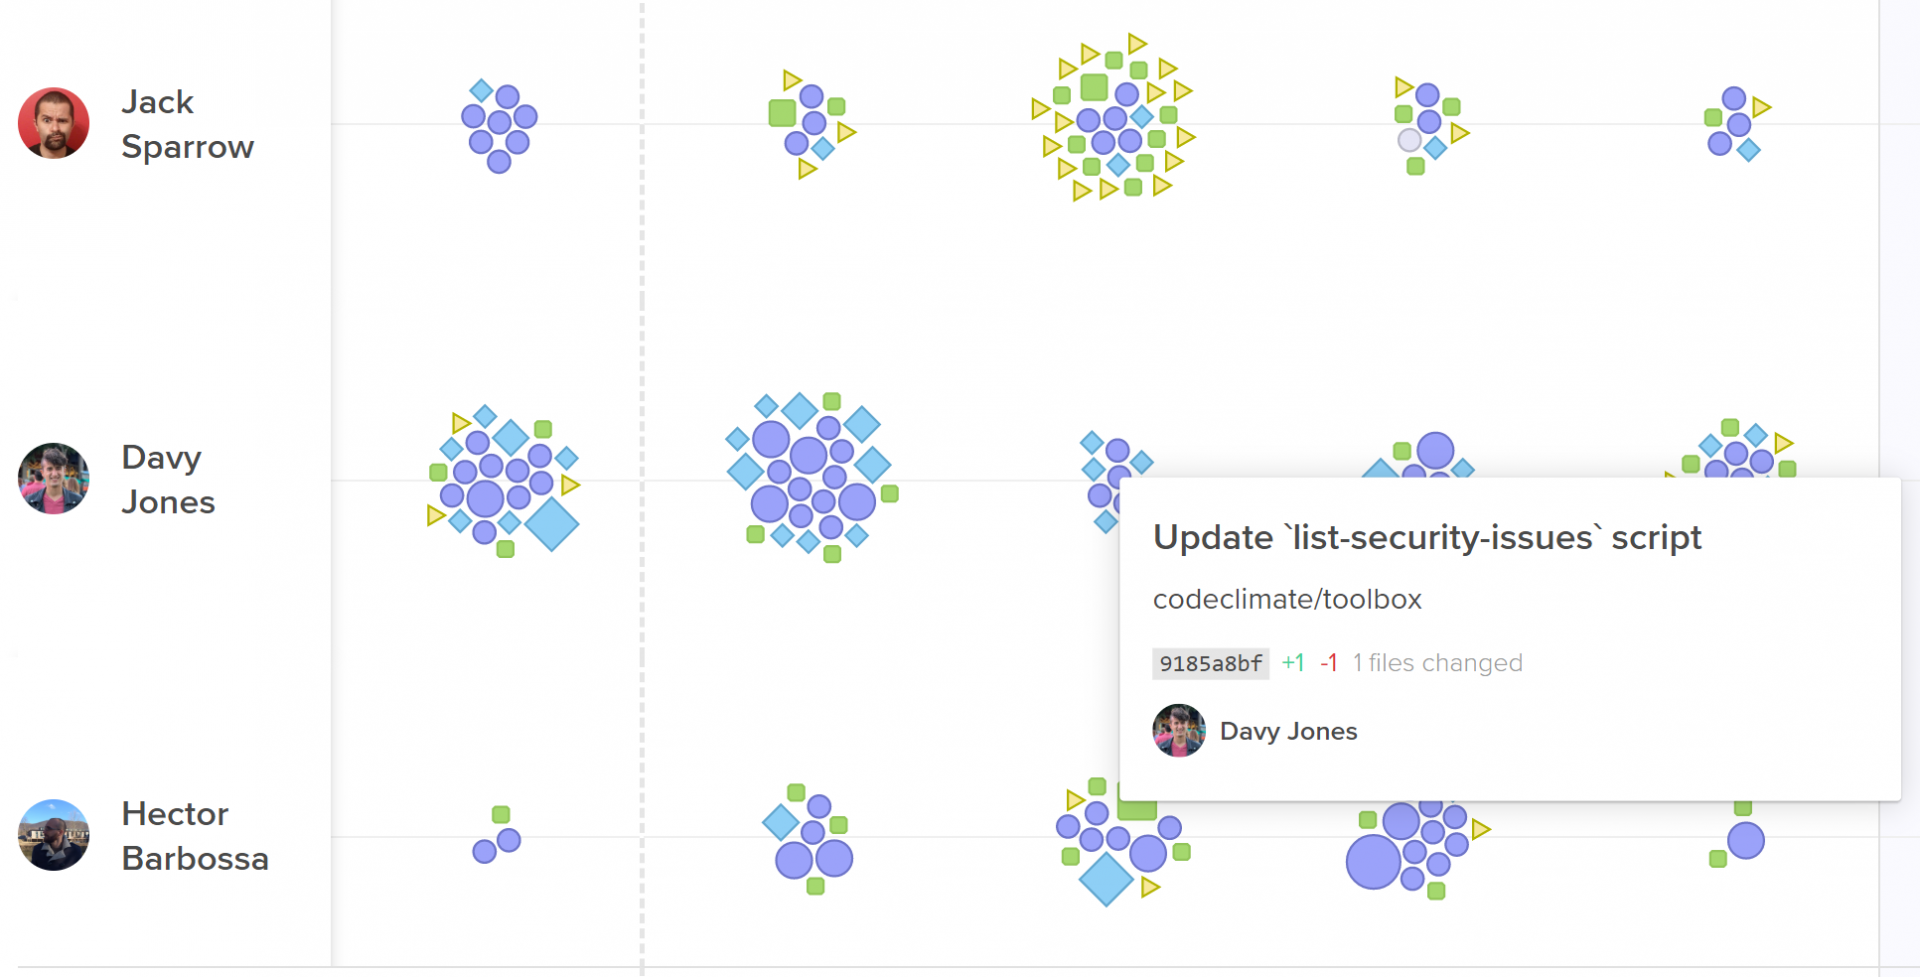
Activity Log represent every engineering activity with a shape.
- The most important pull requests last sprint. Look at pull requests that had a big effect on the codebase, as well as pull requests that were larger or older than the rest.
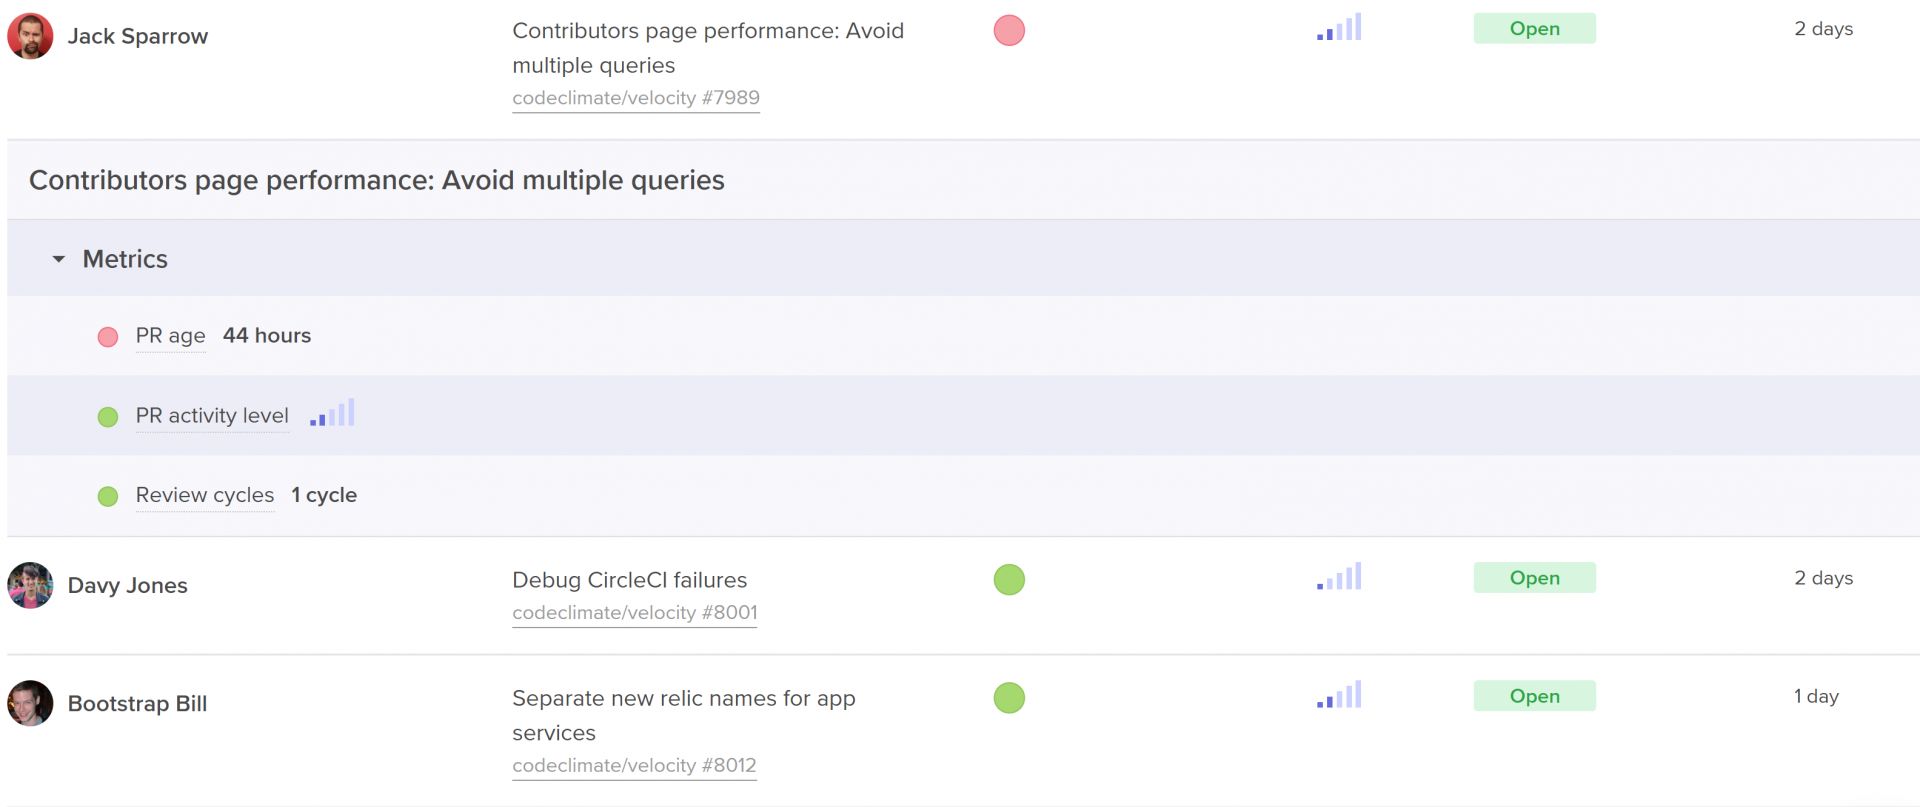
Code Climate's insights show work in progress with activity level, age, and health.
- Process metrics including outcome metrics like Cycle Time and Pull Request Throughput, but also metrics that represent more specific areas of the software development process, like Time to Open, Time to Review, and Time to Merge.
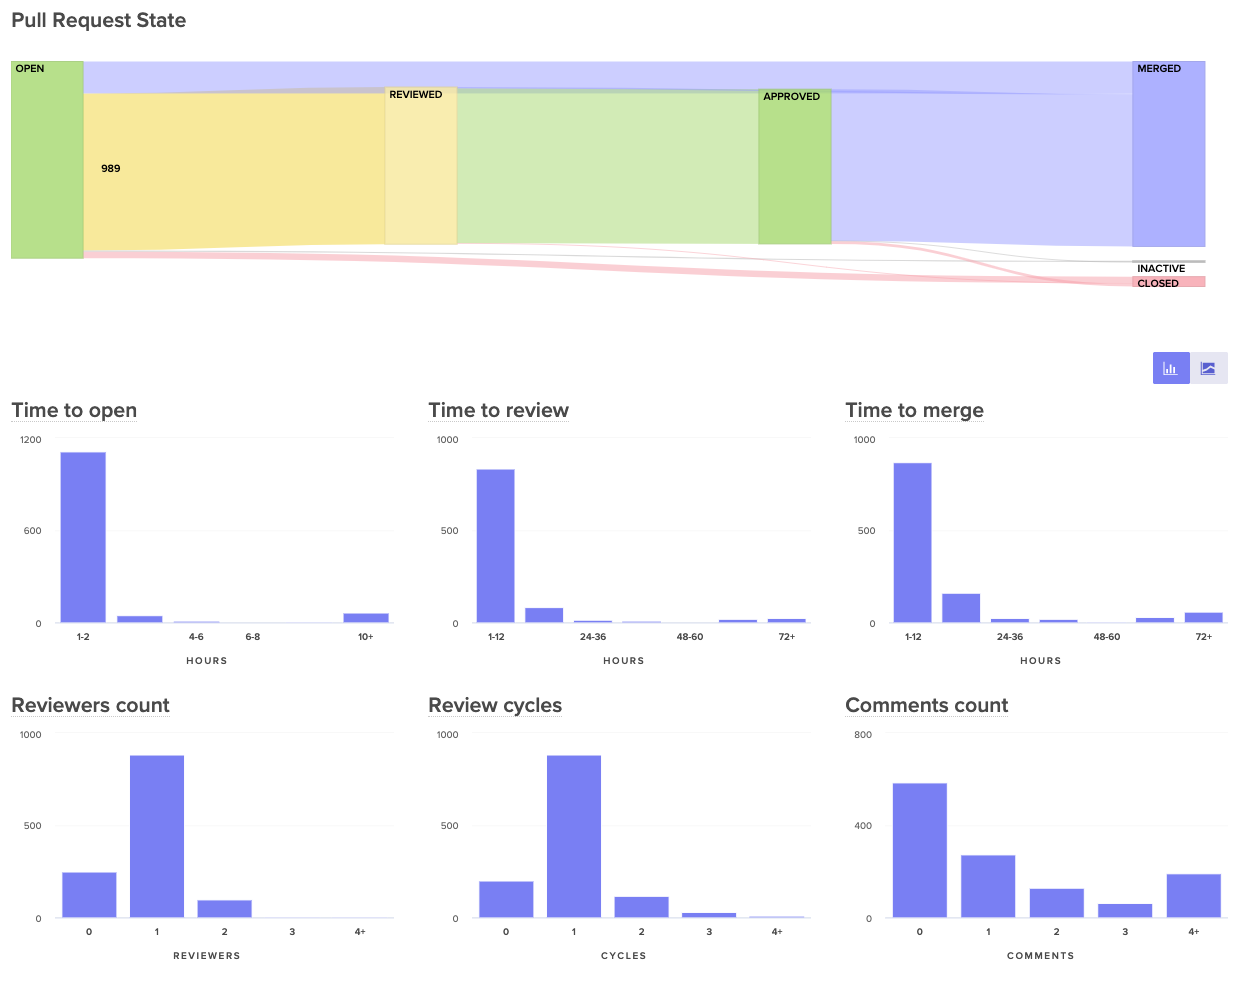
Visualize the journey of your pull requests from open to merged. Below, you can see metrics that represent constituents of this journey to better diagnose slowdowns.
Plan: Align with SMART goals
Once your team has fully diagnosed an issue using both qualitative and quantitative data, they’ll have to decide on one, specific metric that they can use as their SMART goal.
Specific
Success of hitting or missing your metric should be black or white, so you need a concrete number in your goal. “Improving our Time to Review” is vague, “Decreasing our Time to Review to under 4 hours” is specific.
Also, make sure the metric is narrow enough that the team knows which behaviors drive this metric up or down. Metrics that are too broad can obscure progress since they’re affected by many different kinds of unrelated data. Hannah’s team, for example, would want to choose a metric like Time to Merge, rather than total Cycle Time, so the team can easily self-correct when they notice the metric trending in a negative direction.
Measurable
The way in which you measure your metric depends on your objective. If you’re measuring output, for example, a simple count can do the trick. If you’re looking to adhere to specific standards– such as keeping pull requests small, or keeping downtime minimal– you’ll want to decide between tracking the simple average and tracking it as a sort of Service Level Objective (SLO) based on a percentile.
Here are a few examples:
Average Target
SLO Target
Decrease Pull Request Cycle Time to under 1 day.
90% of pull requests should have a cycle time of under 1 day.
Decrease Pull Request Size to an average of 250 lines of code.
Keep 95% of pull requests under 250 lines of code.
Reduce Review Cycles to an average of 1.5 cycles.
Keep 90% of reviews to one cycle.
Reduce Review Speed to an average of 1 hour.
Keep 90% of reviews to under 1 hour.
While averages are more commonly used in process metrics, SLOs enable your team to deviate from the goal in a few instances without hindering their ability to meet the target.
Assignable
Pick one person to own and track this goal. Research has shown that having exactly one team member check in at regular intervals drastically increases the chances that a goal will be hit. Apple championed the idea of a Directly Responsible Individual (DRI) for all initiatives, and teams at leading tech companies like Microsoft have applied the DRI model to all DevOps related functions.
Ownership will also help you secure buy-in for bringing data into retros. Consider asking the person who uncovered the problem in the first place to own the goal.
Realistic
Make sure your goal is reachable, so your team feels success if they’ve put a concerted effort into reaching the goal.
Execute: Increase visibility to keep goals front of mind
The true test of your action items come after the retro. How frequently will your team think about these metrics? Will success be known across the team? If your team is unsuccessful, will they be able to try a different adjustment?
To keep the goal front of mind, you need to make progress visible to everyone on the team. Many managers use information radars, either in shared spaces or in universally accessible dashboards.
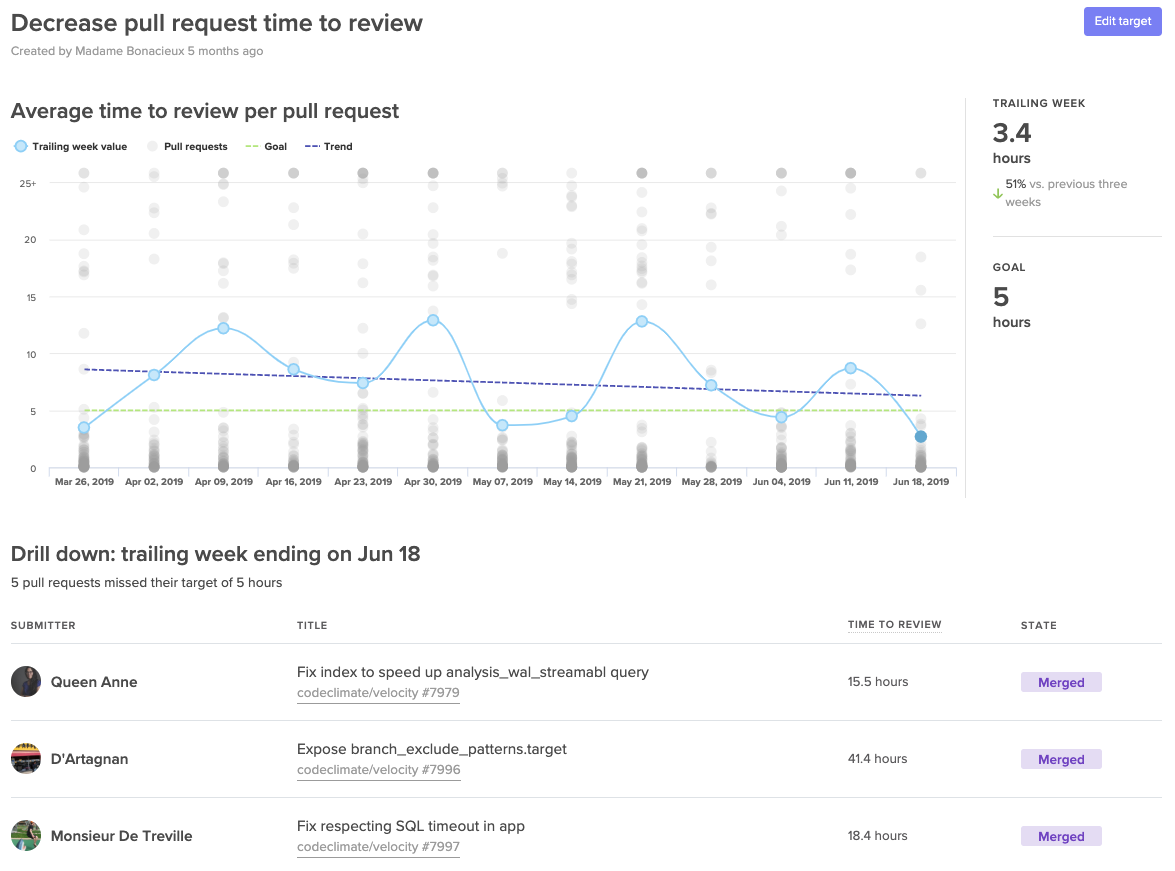
A Target dashboard that lets you visualize progress towards your SMART goals.
Making progress transparent equips the team to bring the results-oriented discussions outside of their retros. Effective goals will be brought up during standups, 1:1s, and even pairing sessions. Repetition will secure focus and will further unify the team around success.
📈 makes engineers 😊
When Boaz Katz, the founder and CTO of Bizzabo, started setting concrete targets he found that sharing success motivated his team to find more ways to improve. He told us, “My team developed a winning attitude and were eager to ship even faster.”
When the whole team sees success each retro, the momentum creates a flywheel effect. Team members are eager to uncover more improvement opportunities creating a culture around enacting positive change to your processes.