Webinars
Navigating the world of software engineering or developer productivity insights can feel like trying to solve a complex puzzle, especially for large-scale organizations. It's one of those areas where having a cohesive strategy can make all the difference between success and frustration. Over the years, as I’ve worked with enterprise-level organizations, I’ve seen countless instances where a lack of strategy caused initiatives to fail or fizzle out.
In my latest webinar, I breakdown the key components engineering leaders need to consider when building an insights strategy.
Why a Strategy Matters
At the heart of every successful software engineering team is a drive for three things:
- A culture of continuous improvement
- The ability to move from idea to impact quickly, frequently, and with confidence
- A software organization delivering meaningful value
These goals sound simple enough, but in reality, achieving them requires more than just wishing for better performance. It takes data, action, and, most importantly, a cultural shift. And here's the catch: those three things don't come together by accident.
In my experience, whenever a large-scale change fails, there's one common denominator: a lack of a cohesive strategy. Every time I’ve witnessed a failed attempt at implementing new technology or making a big shift, the missing piece was always that strategic foundation. Without a clear, aligned strategy, you're not just wasting resources—you’re creating frustration across the entire organization.
Sign up for a free, expert-led insights strategy workshop for your enterprise org.
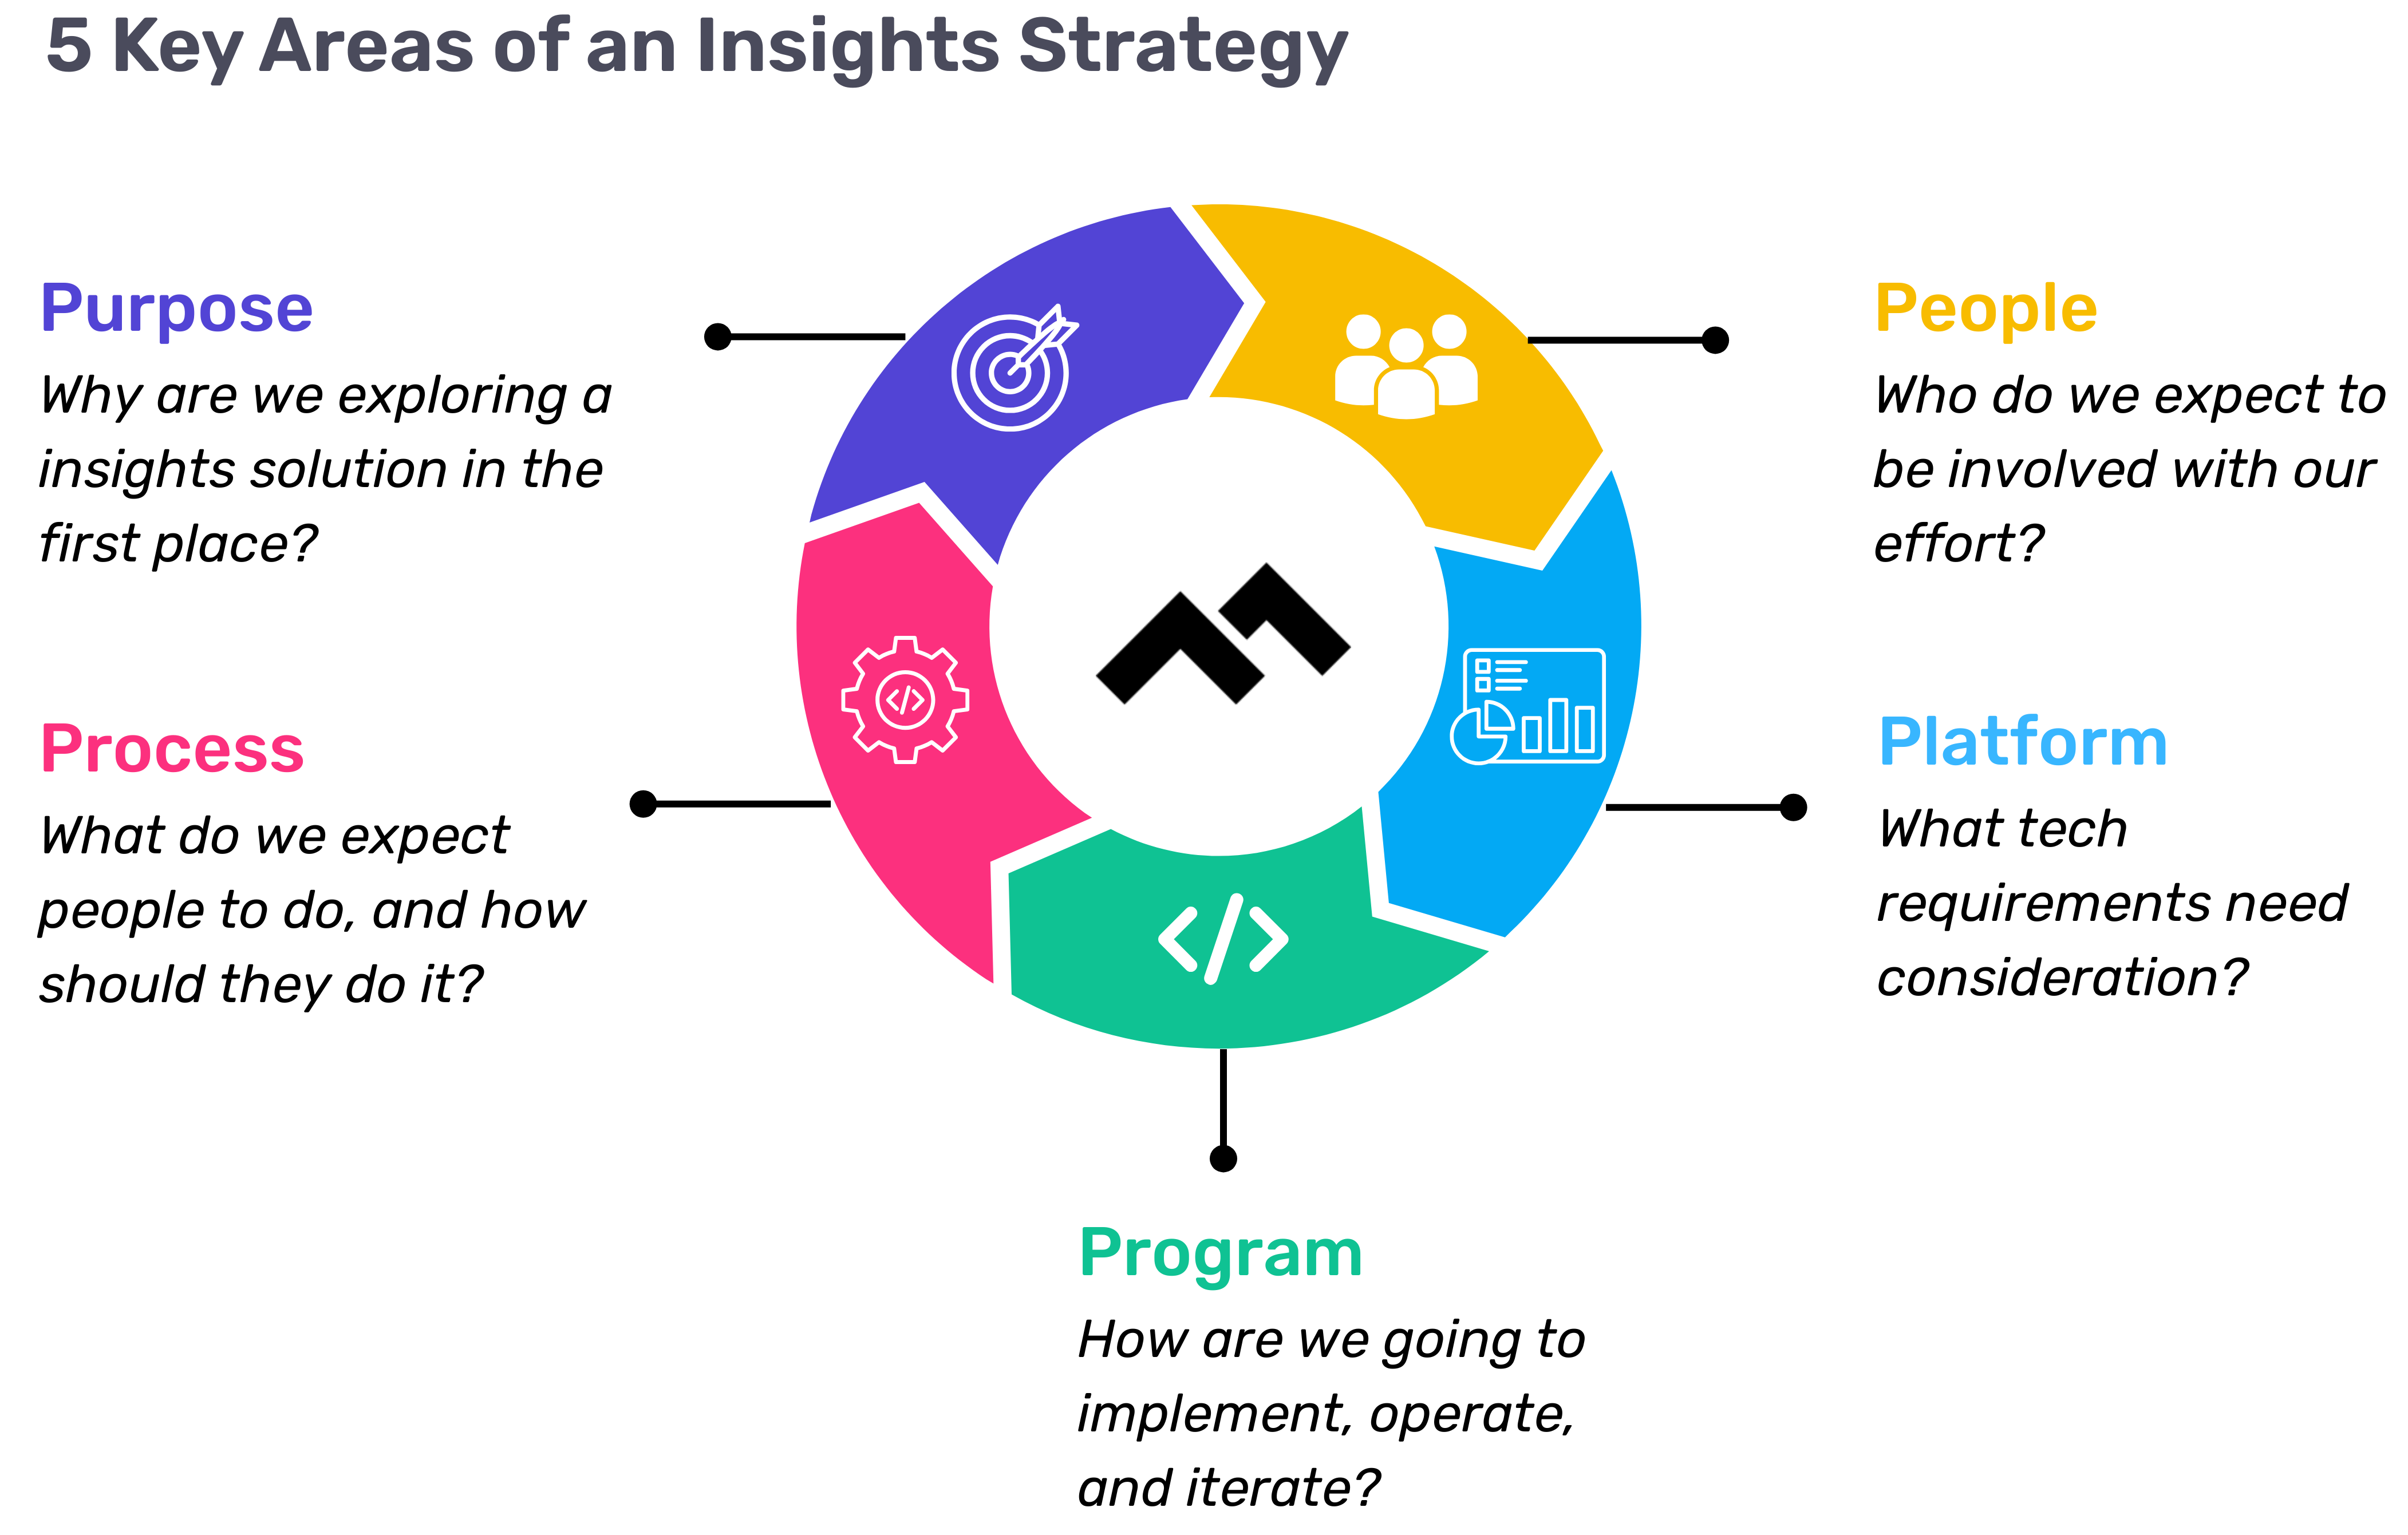
Step 1: Define Your Purpose
The first step in any successful engineering insights strategy is defining why you're doing this in the first place. If you're rolling out developer productivity metrics or an insights platform, you need to make sure there’s alignment on the purpose across the board.
Too often, organizations dive into this journey without answering the crucial question: Why do we need this data? If you ask five different leaders in your organization, are you going to get five answers, or will they all point to the same objective? If you can’t answer this clearly, you risk chasing a vague, unhelpful path.
One way I recommend approaching this is through the "Five Whys" technique. Ask why you're doing this, and then keep asking "why" until you get to the core of the problem. For example, if your initial answer is, “We need engineering metrics,” ask why. The next answer might be, “Because we're missing deliverables.” Keep going until you identify the true purpose behind the initiative. Understanding that purpose helps avoid unnecessary distractions and lets you focus on solving the real issue.
Step 2: Understand Your People
Once the purpose is clear, the next step is to think about who will be involved in this journey. You have to consider the following:
- Who will be using the developer productivity tool/insights platform?
- Are these hands-on developers or executives looking for high-level insights?
- Who else in the organization might need access to the data, like finance or operations teams?
It’s also crucial to account for organizational changes. Reorgs are common in the enterprise world, and as your organization evolves, so too must your insights platform. If the people responsible for the platform’s maintenance change, who will ensure the data remains relevant to the new structure? Too often, teams stop using insights platforms because the data no longer reflects the current state of the organization. You need to have the right people in place to ensure continuous alignment and relevance.
Step 3: Define Your Process
The next key component is process—a step that many organizations overlook. It's easy to say, "We have the data now," but then what happens? What do you expect people to do with the data once it’s available? And how do you track if those actions are leading to improvement?
A common mistake I see is organizations focusing on metrics without a clear action plan. Instead of just looking at a metric like PR cycle times, the goal should be to first identify the problem you're trying to solve. If the problem is poor code quality, then improving the review cycle times might help, but only because it’s part of a larger process of improving quality, not just for the sake of improving the metric.
It’s also essential to approach this with an experimentation mindset. For example, start by identifying an area for improvement, make a hypothesis about how to improve it, then test it and use engineering insights data to see if your hypothesis is correct. Starting with a metric and trying to manipulate it is a quick way to lose sight of your larger purpose.
Step 4: Program and Rollout Strategy
The next piece of the puzzle is your program and rollout strategy. It’s easy to roll out an engineering insights platform and expect people to just log in and start using it, but that’s not enough. You need to think about how you'll introduce this new tool to the various stakeholders across different teams and business units.
The key here is to design a value loop within a smaller team or department first. Get a team to go through the full cycle of seeing the insights, taking action, and then quantifying the impact of that action. Once you've done this on a smaller scale, you can share success stories and roll it out more broadly across the organization. It’s not about whether people are logging into the platform—it’s about whether they’re driving meaningful change based on the insights.
Step 5: Choose Your Platform Wisely
And finally, we come to the platform itself. It’s the shiny object that many organizations focus on first, but as I’ve said before, it’s the last piece of the puzzle, not the first. Engineering insights platforms like Code Climate are powerful tools, but they can’t solve the problem of a poorly defined strategy.
I’ve seen organizations spend months evaluating these platforms, only to realize they didn't even know what they needed. One company in the telecom industry realized that no available platform suited their needs, so they chose to build their own. The key takeaway here is that your platform should align with your strategy—not the other way around. You should understand your purpose, people, and process before you even begin evaluating platforms.
Looking Ahead
To build a successful engineering insights strategy, you need to go beyond just installing a tool. An insights platform can only work if it’s supported by a clear purpose, the right people, a well-defined process, and a program that rolls it out effectively. The combination of these elements will ensure that your insights platform isn’t just a dashboard—it becomes a powerful driver of change and improvement in your organization.
Remember, a successful software engineering insights strategy isn’t just about the tool. It’s about building a culture of data-driven decision-making, fostering continuous improvement, and aligning all your teams toward achieving business outcomes. When you get that right, the value of engineering insights becomes clear.
Want to build a tailored engineering insights strategy for your enterprise organization? Get expert recommendations at our free insights strategy workshop. Register here.Register here.
Andrew Gassen has guided Fortune 500 companies and large government agencies through complex digital transformations. He specializes in embedding data-driven, experiment-led approaches within enterprise environments, helping organizations build a culture of continuous improvement and thrive in a rapidly evolving world.
Technology is evolving very quickly but I don't believe it's evolving as quickly as expectations for it. This has become increasingly apparent to me as I've engaged in conversations with Code Climate's customers, who are senior software engineering leaders across different organizations. While the technology itself is advancing rapidly, the expectations placed on it are evolving at an even faster pace, possibly twice as quickly.
New Technology: AI, No-Code/Low-Code, and SEI Platforms
There's Generative AI, such as Copilot, the No-code/Low-code space, and the concept of Software Engineering Intelligence (SEI) platforms, as coined by Gartner®. The promises associated with these tools seem straightforward:
- Generative AI aims to accelerate, improve quality, and reduce costs.
- No-code and Low-code platforms promise faster and cheaper software development accessible to anyone.
- SEI platforms such as Code Climate enhance productivity measurement for informed decisions leading to faster, efficient, and higher-quality outcomes.
However, the reality isn’t as straightforward as the messaging may seem:
- Adopting Generative AI alone can lead to building the wrong things faster.
- No-code or Low-code tools are efficient until you hit inherent limitations, forcing cumbersome workarounds that reduce maintainability and create new challenges compared to native code development.
- As for SEI platforms, as we've observed with our customers, simply displaying data isn't effective if you lack the strategies to leverage it.
When I joined Code Climate a year ago, one recurring question from our customers was, "We see our data, but what's the actionable next step?" While the potential of these technologies is compelling, it's critical to address and understand their practical implications. Often, business or non-technical stakeholders embrace the promises while engineering leaders, responsible for implementation, grapple with the complex realities.
Navigating New Technology Expectations and Realities
Software engineering leaders now face increased pressure to achieve more with fewer resources, often under metrics that oversimplify their complex responsibilities. It's no secret that widespread layoffs have affected the technology industry in recent years. Despite this, the scope of their responsibilities and the outcomes expected from them by the business haven't diminished. In fact, with the adoption of new technologies, these expectations have only increased.
Viewing software development solely in terms of the number of features produced overlooks critical aspects such as technical debt or the routine maintenance necessary to keep operations running smoothly. Adding to that, engineering leaders are increasingly pressured to solve non-engineering challenges within their domains. This disconnect between technical solutions and non-technical issues highlights a fundamental gap that can't be bridged by engineering alone—it requires buy-in and understanding from all stakeholders involved.
This tension isn't new, but it's becoming front-and-center thanks to the promises of new technologies mentioned above. These promises create higher expectations for business leaders, which, in turn, trickle down to engineering leaders who are expected to navigate these challenges, which trickle down to the teams doing the work. Recently, I had a conversation with a Code Climate customer undergoing a significant adoption of GitHub Copilot, a powerful tool. This particular leader’s finance team told her, "We bought this new tool six months ago and you don't seem to be operating any better. What's going on?" This scenario reflects the challenges many large engineering organizations face.
Navigating New Technology Challenges and Taking Action
Here's how Code Climate is helping software engineering leaders take actionable steps to address challenges with new technology:
- Acknowledging the disconnect with non-technical stakeholders, fostering cross-functional alignment and realistic expectations. Facilitating open discussions between technology and business leaders, who may never have collaborated before, is crucial for progress.
- Clearly outlining the broader scope of engineering challenges beyond just writing code—evaluating processes like approval workflows, backlog management, and compliance mandates. This holistic view provides a foundation for informed discussions and solutions.
- Establishing a shared understanding and language for what constitutes a healthy engineering organization is essential.
In addition, we partner with our enterprise customers to experiment and assess the impact of new technologies. For instance, let's use the following experiment template to justify the adoption of Copilot:
We believe offering Copilot to _______ for [duration] will provide sufficient insights to inform our purchasing decision for a broader, organization-wide rollout.
We will know what our decision is if we see ______ increase/decrease.
Let’s fill in the blanks:
We believe offering Copilot to one portfolio of 5 teams for one quarter will provide sufficient insights to inform our purchasing decision for a broader, organization-wide rollout.
We will know what our decision is if we see:
- An increase in PR Throughput
- A decrease in Cycle Time
- No negative impact to Rework
- No negative impact to Defect Rate
Andrew Gassen leads Code Climate's enterprise customer organization, partnering with engineering leaders for organization-wide diagnostics to identify critical focus areas and provide customized solutions. Request a consultation to learn more.
Read on for highlights from the conversation, and watch the full webinar on demand here.
In an effort to understand the markers of a productive engineering team, the DORA (DevOps Research and Assessment) group, founded by Dr. Nicole Forsgren, Jez Humble, and Gene Kim, designed their research to answer core questions about DevOps:
Does technology matter for organizations? If so, how can we improve software delivery and engineering performance?
Through rigorous academic and analytical research, the group was able to demonstrate that improving software delivery and engineering performance leads to increased profitability and customer satisfaction. They identified four key metrics, now known as the DORA metrics, which address the areas of engineering most closely associated with success, and established benchmarks, enabling engineering teams to improve performance and balance the speed and stability of their software delivery.
How can organizations get started with DORA metrics and turn those insights into action? Code Climate’s Director of GTM Strategy and Intelligence, Francesca Gottardo, sat down with DORA expert Nathen Harvey to discuss how leaders leverage DORA metrics to improve engineering team health and truly drive change in their organization.
Francesca Gottardo: How did the DORA team choose between metrics that measure the quality of software versus how quickly it was getting shipped?
Nathen Harvey: Delivering technology can enable and accelerate any business. We all want to accelerate the delivery of that technology to enable great customer experiences.
So we look at two metrics: Deployment Frequency, how frequently are you pushing changes out to your users? And Lead Time for Changes, how long does it take for code to go from committed to actually in the hands of your users? The challenge there is that moving fast is good, but not enough, so we also have two stability metrics that complement that. The stability metrics are your Change Failure Rate, what I like to call the ‘Oh, Expletive’ rate — when you push a change to production and someone shouts out an expletive – and Time to Restore, how do we as a team quickly respond and recover when there is an incident or an outage that impacts our users?
That traditional thinking leads us to believe that these two are trade-offs of one another: we can either be fast or we can be stable. But what the data shows us over almost a decade now, is that these two ideas move together in lockstep. There are teams that are good, are good at all four metrics and the teams that are performing poorly are performing poorly across all four metrics as well.
Francesca: Who are DORA metrics for? Are they best suited for a specific type or size of company?
Nathen: We've seen teams of all shapes and sizes using DORA and insights from it successfully. But there were also some challenges there. First, measuring those metrics at an organizational level doesn't really give you a whole lot of value. How frequently does Google deploy? A lot, but what are we going to learn from that?
We really want to look at an application or a service, a particular set of capabilities, if you will, that we deliver to our customers, so first we have to measure at that level. And let's also make sure that we're using or getting insights across the entirety of the team that's responsible for prioritizing, building, deploying, and operating that application or service — it often takes a cross-functional team focused on one application or service.
The technology really doesn't matter. You can use those four metrics to look at how you’re doing with the custom application that you’re building for customers, but you could also do that for the commercial off-the-shelf software that you're using to deliver to your customers, or a SaaS that you're using.
Francesca: Is there a specific type of view or a few specific metrics that a leader of a few teams should look at?
Nathen: From a leadership perspective, I think the best insights you can get from the DORA metrics are just really to understand how your teams are doing. But here's the pitfall there: you're not using this to weigh teams against one another. Instead, what DORA really tries to get at is embracing a practice and a mindset of continuous improvement.
You might want to look across your teams to understand how each team is doing, find those teams that are doing really well, and identify what lessons you can learn from that team. Of course, the context is so important here. If you're shipping a mobile application or if you're working on the mainframe, we can use those same four measurements, but we don't expect the values are going to be the same across those teams. As a leader, I think that there are really good ways to have insight into what sort of investments you need to make in the team, and what sort of support each of your teams need.
Francesca: What are some other common pitfalls you find when people start using DORA metrics?
Nathen: The biggest one is this idea that we have to reach peak performance. Really, the goal is improvement. Don't worry about how other teams are doing. It's nice to have a benchmark to understand where you sort of fit, but the more important thing is, how do you get better? In fact, looking at the four metrics, it's difficult to say, ‘How do I get better? My Deployment Frequency isn't what I want, so I need to get better.’ You don't get better just by mashing the deploy button more frequently. That's not the right approach. The research actually goes a little bit deeper beyond those four key metrics into some capabilities — practices or tools or things that your team does regularly.
The capabilities that the research investigates are technical capabilities like version control, continuous integration, and continuous testing. There are also process capabilities: How much work do you have in-flight at any given time? Maybe shrink down your amount of work-in-progress. What does that change approval look like? Focusing on that change approval process is maybe the thing that's going to unlock value.
Most important of the capabilities are the cultural capabilities. How do the people in your team show up? How do they communicate and collaborate with one another? How are they rewarded? What's incentivized? All of these things really matter, and DORA is really about taking that comprehensive view of what capabilities a team needs to improve in order to drive those four metrics.
Francesca: What is the starting point that you recommend leaders look at?
Nathen: One of the beautiful things about these four metrics is thinking about them holistically. You may want to improve Deployment Frequency, but do you know how you're going to get there? You're going to make your lead times shorter. You're going to make your Change Failure Rate go down and you're going to restore service faster. It doesn't matter which one you focus on; changes are likely going to have good impacts across all four, and we really encourage you to look at all four as a whole.
How do you get started from there? You really then need to go deeper into the capabilities. Start with the capabilities where your teams have a lot of opportunity for growth. It's really about finding your constraint and making improvements there.
Francesca: And you would say as you're measuring that opportunity for growth, it's really relative to the benchmark, correct?
Nathen: Oh, absolutely. Let's say that continuous integration popped up as the thing that you should focus on. Now we have to figure out how we get better at continuous integration. Let's go put some new things in place. Those new things might be new measures, so we can test how well we're doing with continuous integration. There's certainly going to be new practices, maybe even new technologies, but after you've made some of that investment, you have to go back to those four key metrics, back to the benchmarks. Did this investment actually move those metrics in the way that we expected it to?
Francesca: Sometimes leaders can have a hard time getting buy-in for new forms of measurement, or the individual developers on a team have seen a lot of flawed measurement and can be skeptical. How do you suggest that leaders get their teams on board to be measured like this?
Nathen: Yeah, I don't like to be measured either. I get it. I think honestly, the best way to help teams get on board with this is for leaders to share the idea of these metrics and then step out of the way and give the teams the autonomy that they need to make the right choices. If a leader comes to me and says, ‘I'm going to measure your team's performance based on these four metrics,’ that's fine, but what I don't want that leader to do is tell me exactly how to improve those four metrics, because the leader isn't attached to the daily work of our team. But if that same leader says, ‘These are the metrics by which you'll be measured and we want to improve these metrics, what can we do?’ Now, as a team, we’ve been given that trust and the autonomy to select where we should invest and what we should do. A leader's job really is to support that investment, support that learning of the team.
Francesca: How could you ensure that you're comparing kind of apples to apples as you're looking at DORA metrics for teams that may be looking or working in different platforms?
Nathen: You are in fact comparing apples to oranges, and so the thing that I encourage folks to do is celebrate the teams that make the most progress. Maybe you can get to a derivative: This team increased their Deployment Frequency by 10%, this team increased their Deployment Frequency by 50%. Maybe that 50% team went from annual deployments to twice a year, but that's still a 50% improvement, and that's worthy of celebration. I think really looking at the progress that you're making instead of the raw numbers or that sort of benchmark data is the best way to go.
Francesca: One thing I've heard is that it's really important for teams to improve to a higher performance bucket, rather than stay within that bucket.
Nathen: We put out an annual report and people are hungry for benchmarks, and they really want those benchmarks and want to understand how they measure up to peers, to others in the industry. And each year, we do a cluster analysis of those four key measures, and these clusters emerge from the data. We don't set in advance what it means to be a low performer or medium performer. We let the data answer that question for us, but then we have to put labels on those clusters to make them consumable by a leader and by teams, and unfortunately, we use labels like low or medium or high or elite.
Nobody wants to be a low performer. It's not very encouraging to show up to work as a low performer. But I try to encourage folks to recognize that this is not a judgment and maybe just discard the label; it's about that improvement. How are you making progress against that? As you're making changes, you're likely to have some setbacks as well.
In 2020, we did an investigation into reliability practices, and we saw that some teams, as they began their journey changing some of their reliability practices, the reliability of their systems dropped. But over time, as they stayed committed and got more of their teams involved and more of the practices honed within their team, they saw this J curve illustrating impact across the team. So I think the important takeaway there is that this requires commitment. We're asking people to change process and technology. It's going to take some commitment.
Francesca: DORA metrics have had a huge impact in this space and are a popular starting point for taking a data-driven approach. What are your thoughts on how popular they’ve become?
Nathen: It's really exciting for me and for my team, and of course for the researchers, to see that it's had such a lasting and big and expanding impact on the industry. I think that it is important, though, to remember that the research is focused on that process of software delivery and operations. Oftentimes people ask about developer productivity or developer experience. This isn't particularly measuring that, although I would say that a developer is going to have a much better experience knowing that the code that they wrote is actually in the hands of users.
So it's not a direct measure there, it is an outcome of that process. When it comes to any sort of metric that we are looking at, it is important to remember which of these measures are inputs, which of these measures are outcomes. Even something like software delivery as an outcome is an input to organizational performance. It's really important just to understand the full context of the system, which of course includes the people in the system.
Francesca: If you're looking at DORA metrics in a tool like ours, there's also the context available so that you can have those conversations upward and people aren't going to be using that data in the ways that it wasn't intended.
Nathen: Absolutely. And with tools like Code Climate, you can go beyond those four keys. What are the inputs that are driving that? As an example, what is the quality of the code that's been written? Is it following the practices that we've set within our team? How long does a peer review of this code take? All of these things are really, really important and drive those overall metrics.
Francesca: We've seen that Deployment Frequency really is closely related to PR Size. So that's a great place to look first.
Nathen: Yeah, I think that one in particular is interesting because those four measures really, I think what the researchers really wanted to measure were batch sizes.
But how do we ask you, ‘What's the size of your batch?’ Smaller for you might be a medium for me. So those four metrics can really be used as a proxy to get at batch size and you're going to improve if you make that batch size smaller.
What is the size of our PRs? We can actually look across teams and say, ‘This team that has large PRs, lots and lots of code changes, they tend to go out slower.’ We could also start to look at things like from the time the change is committed, that lead time, what does it do for our Change Failure Rate? We've worked with customers who can pull out data and show us on a dashboard that the longer this change takes to get to production, the higher chance it's going to fail when it reaches production.
Francesca: Can you talk a little bit more about the importance of having metrics be standardized or making sure that Deploy Frequency, for example, means the same thing to everybody in the organization?
Nathen: I think it can be a real challenge, and I think that one of the values of DORA is that it gives us a shared language that we're communicating with one another. Deployment Frequency is a really interesting one. Of course, it's just how frequently you’re pushing changes out to your customers, but then there can be a lot of nuance.
The most important thing there is that you have consistency over time within a team. And then the second most important thing is across an organization as you're looking across teams, even if you can't get to a consistent definition, at least you can publish or write down and probably store in version control, how are we measuring this thing so that it's clearly communicated across those teams?
Francesca: So how do people connect something like Deployment Frequency and Lead Time to higher levels of work? For example, a story, a project, or business feature where you're really delivering that end-user value.
Nathen: DORA metrics are really focused on this idea of software delivery. We are looking only at code commit through to code deploy, but of course there's a lot of stuff that happens before we even get to code commit. Teams want to know things like feature velocity. How fast am I able to ship a feature? That's a different question than ‘How fast am I able to ship a change?’ because a feature is likely multiple changes that get rolled up together. This is where other metrics frameworks, like the flow metrics, might start to come in, where we look at a broader view of that entire value chain. And I think that it can be very difficult. Is a feature brand new thing that we're launching from fresh, or is a feature changing the location of this particular button? They're both features, they both have very different scales. One of the reasons that the DORA research really focuses on that software delivery process is it gives us a little bit more sort of continuity. A change, is a change, is a change, is a change. If we're shipping a change, it should follow the same process. There should be less variability in the size of that or in the duration of how frequent or how long that takes.
Francesca: A lot of the questions that we've been getting from the audience are more about digging deeper into the context of each of these metrics because they're very big picture outcomes. So let's take Mean Time to Recovery, for example. How do you suggest digging into this one?
Nathen: I think the best thing to do is look at something that just happened. So let's say you just had an incident or an outage, something that you recovered from. First and foremost, make sure you're recovered, make sure your users are happy again. Now that we're there, let's take some time to learn from that incident or from that outage. And that's where the investment really starts to take place.
One of the first things we have to do is go talk to people. We have to understand your mindset during this incident or outage, and really try to unwind what led to this, not in a way that we're looking for what things we should blame, but instead just to get a better understanding of the system overall. Let's ask really good questions, and involve the right people in those conversations.
Francesca: Your research is in the abstract, but when you’re seeing DORA metrics practices in actuality, what were some surprises?
Nathen: What I so often see is a thing that you mentioned earlier: it really comes down to the process and the people. The people really matter.
The truth is that as we're trying to change culture and the way that teams and people show up at work, it is oftentimes the case that you have to change how they work to change how they think. Technology and culture are kind of stuck together. You can't just change out a tech and expect that the culture's going to change, nor can you just change the culture and expect that the technology's going to follow. These two amplify and reinforce one another. I think that we're reminded again and again and again that there is not a magic wand. There are no silver bullets. This takes consistent practice. It takes commitment and it takes looking at the entire system if you want to improve.
Francesca: If the need and desire for measuring DORA isn't coming from leadership, how do you suggest a team goes about implementing it?
Nathen: In my opinion, these measures matter for the teams that are building the software. And in fact, I don't mind if a leader isn't pushing me to measure DORA metrics. What I really want is for the team of engineers, the team of practitioners that come together to ship that software, to care about these metrics. Because at the end of the day, the other thing that we know is that these teams are more productive when they're able to hit those metrics. And a productive team is a happy team.
I often ask this question: is a happy team productive or is a productive team happy? I think the answer is yes, right? As an engineer, when I'm productive, when I'm able to be in the flow of my work and get fast feedback on the work that I'm doing, that makes me happier. I have better days at work. There's even research from GitHub that looks exactly at that. What does a good day look like? It's when that engineer, that developer is in the flow doing the work that they love to do, getting that fast feedback. So these metrics really matter for the team.
Francesca: It's what we see in how people use our tool as well, and that so often people or customers will come to us either wanting to fix some inefficiencies in their SDLC or wanting to improve team health, and they may be one and the same when you're really looking at the big picture.
Nathen: Absolutely. I don't know of any CEO who has come to a team and said, ‘Wow, you've deployed more frequently this year. Congratulations. Here's a big bonus.’ The CEO cares about the customer. These metrics can help reinforce that. As technologists, it's easy for us to get caught up in the latest, greatest new technology, this new microservices framework, this new stuff from AI. But at the end of the day, we're here to deliver value to our customers and really understand what they need out of this. That's what our CEO cares about. Frankly, that's what we should care about. We're using technology to further those goals and to keep our customers happy.
Francesca: In the polls, 26% of people said that they have philosophical or cultural barriers to implementing DORA. If leadership doesn't see it as a priority, how can managers still motivate the team?
Nathen: I think that one approach that is successful is to — and this pains me a little bit — stop using the word DORA. Stop using the word DevOps. Don't talk about those things, don't talk about those labels. Turn to a more curious mindset and a questioning mindset. What would it be like for our customers, for our organization, for our team, if we were able to deliver software faster? Imagine that world because we can do that. We can get there and do that in a safe way. Imagine or ask the question, ‘What happens if we don't improve? What happens if we stay stagnant and our practices aren't improving?’ And really start at digging into some of those questions to find that intrinsic motivation that we have. As an engineer, like I said, I want to ship more things. I want to get feedback from that faster. I want to do the right thing for my customers.
Francesca: What is the future of DORA? Are there additional metrics you think of exploring or avenues outside of stability, outside of speed, that you think are important to include in the future?
Nathen: Yeah, absolutely. I think this is really where we get back to those capabilities. Number one, we will continue this research and continue our ongoing commitment to that research being program and platform-agnostic, really trying to help teams understand what capabilities are required to drive those metrics forward. Number two, like you mentioned earlier, we're seeing more and more teams that are trying to use the DORA framework and the metrics and the research to drive those improvements. In fact, we've recently launched dora.dev as a place where the community can start to come together and learn from one another and collaborate with one another and answer these questions.
Don't ask Nathen, let's ask each other. Let's learn from each other and the lived experiences of everyone here. And then, of course, I mentioned that the research will continue. So stay tuned. In the next couple of months, we'll launch the 2023 state of DevOps survey. And the best thing about the survey is the questions that it asks. And I think that teams can really get a lot of value by carefully considering the questions that are posed in the survey. Just by looking at those questions, a team is going to start to identify places where they could make investments and improvements right now.
Francesca: Something that is going to stick with me from what you've said today is that the benchmarks that are standardized may not be what we should all be spending so much time on. It's really about how we compare to ourselves and where we can improve.
Nathen: It is that practice and mindset of continuous improvement. Now, look, the benchmarks are still important because we have to have dashboards, we have to have ways to report, we have to have ways to test that what we're doing is making things different. Whether that's good, better, or worse, at least these benchmarks give us a way to test that and prove out the theories that we have.
To learn how your engineering team can implement DORA metrics to drive improvement, request a consultation.
Metrics are an essential tool for engineering leaders looking to gain objective insights about the teams they manage. In order to improve business outcomes and overall team health, leaders must identify which metrics to track and apply the data with intention.
Code Climate’s Senior Product Manager, Mike Koeneke, sat down with three directors of engineering: Sophie Roberts of Shopify; Mojtaba Hosseini of Zapier; and Romain Dupas of Code Climate, to discuss how they each define and utilize metrics to meet their goals.
Read on for highlights from their conversation. Answers have been shortened for length and clarity.
Defining Metrics: Which metrics do engineering leaders look at, and why?
Sophie: There are four kinds of metrics I look at on a regular basis:
- Operational or system health metrics: These include SLAs, API failure rates, system throughput — the things that tell you, as an engineering leader, if your product is healthy.
- Development metrics: Your average time to commit, your average build time, and your build success failure, which fall under engineering productivity, helping us understand how to improve the productivity of our engineering teams.
- Organizational health metrics: Team composition, retention, employee morale, and ability to actually hit goals that you set. It helps us understand if our people are in a good place and are being effective.
- Business metrics: These metrics show that the business is moving forward. Are we having the impact on the business that we expect to have with regards to things like revenue, customer acquisition, efficiency?
Mojtaba: One thing we’ve started to do at Zapier is to talk about hierarchy of metrics that go beyond engineering, and trying to tie in the engineering metrics into a larger set. As a SaaS company, we’ve got our financial metrics which are very top of mind for the board and the C levels…[so for example,] your customer metrics: your churn and activation…if you’re developing quickly, if you’re getting that feedback, if your teams are high performing and happy and engaged. If so, you probably are creating good products, which bring in users, which then brings in the revenue.
Romain: I look at metrics corresponding to all aspects of our process and our goals: Team goals such as OKRs, financial goals, computing metrics, API metrics, productivity. At the end of the day, any goal or process needs to be measurable. Defining those goals and metrics will make the process more efficient.
Balancing Intuition With Objective Data
Sophie: The superpower of actually using metrics is to combine the data with judgment and instincts. If someone on your team is in the lower bound of what you’ve chosen as a performance metric, and you substitute the metric for your judgment and say they’re underperforming, you’re making a bad decision.
When it comes to things like organizational metrics or individual performance metrics, I don’t even look at those as objective pieces of data. I look at those as pieces of data that allow us to explore the margins and find things to be curious about. That’s where your judgment and instinct come in.
Mojtaba: I have a mental model around using metrics: the dashboard of a car. The car’s purpose is to serve the drivers and the passengers. The dashboard, intrinsically, is of no real value if the humans don’t get where they want to go.
You need the objective data: What is my speed? What is the oil gauge telling me? The speedometer? But you still need the human to decide where to go. [As the driver], I might know the maintenance history of the car, so even if the manufacturer tells me I can go faster, I’m not going to push the car to the maximum speed — because of experience and intuition. The intuition by itself can be too vague and needs the objective data, a reality check. But the reality check without that vision just becomes a bunch of numbers.
Romain: Continuing with the car analogy, on the dashboard is a limited amount of space to show the information that matters. You don’t have anything related to what’s in your trunk; the only information you have is what’s valuable: information about the safety of your car. With metrics, you don’t measure everything; understand what you want to measure for your own goal.
Context is Key: Make Sure Your Team Knows Their Purpose
Sophie: It’s critical for me, and I think for all businesses, for every single engineer to understand how the work contributes to the business’ success. When people understand that, then they understand what [things like] an outage actually mean for our merchants.
My engineering team will sit in on interviews with our customers on a weekly basis and they’ll just chat and understand the pain points, because it’s really important that people can tie the experience of your customers to the metrics of the work that they’re doing.
Mojtaba: The job of the leader is to understand how pieces work together and track the outcome they’re working towards. If a platform team is going very slowly, that’s okay, because they are the platform team. They build, they make it so that other teams can go faster. At a high level, we’re still going fast, but I’m not going to tell the platform team they should be going as fast as these other non-platform teams. They fulfill different functions, and it’s the aggregate of those that really brings value. That interpretation, that context, is what leaders need to bring together.
Be Transparent: Share Metrics With Your Team
Sophie: Don’t hide your business metrics from the engineering team. If I could get anyone to take an action item from this, it would be that if your engineering team isn’t getting a copy of your Monthly Business Review (MBR), make that happen.
Romain: My team and I actually set the OKRs together to be aligned with the business OKRs. I ask the team, What do you think we can do to move the organization in accordance with the business OKRs? And that works very well because it goes back to the idea of making sure that the team understands the metrics and is motivated to reach that goal, instead of imposing from the top down that you have to fit these metrics into your day-to-day work.
Using Metrics for Compensation: What to Avoid and What to Reward
Sophie: You want people to take risks, you want people to fail, and you want the metrics to reflect the fact that things failed, but you don’t want to punish people. So there are a whole bunch of cultural interdependencies there that you have to manage.
The metrics can show us if the work is successful or not, but [for me], the metrics themselves don’t tie into people’s compensation. What ties into people’s compensation is how they approach solving the problem. I think that’s the only way you can do it if you’re going to build a culture where experimentation, risk, and failure are genuinely valid, as opposed to just being talking points on a wall.
Mojtaba: We don’t use the metrics in any way, even in the conversations we have about performance. This might sound controversial, but we don’t even have performance evaluation of individual contributors tied to compensation. We have competency levels tied to compensation.
Romain: Metrics are a foundational bed to talk with my engineers about how we can make our process better. And the compensation aspect would be more about where we are today, and where we want to be. Who are the contributors that are going to lead the team, and what will be the involvement and quality of their contribution? [I base compensation on] what their work brings to the table to help the company, more than on the metrics themselves.
To find out what else Sohpie, Mojtaba, and Romain had to say, listen to the full discussion here.
To find out how you can maximize engineering impact, request a consultation.
Psychological safety is a hot topic across all industries these days, but in the fast-paced and dynamic world of software engineering, it plays an especially important role in driving innovation and high performance. Yet, what exactly is psychological safety? Why is it so important for software engineering teams in particular, and how can it be fostered?
To gain real-world insight into this complex topic, Code Climate’s SVP, Customer Organization, Karthik Chandrashekar sat down with Anjuan Simmons, Engineering Coach at Help Scout, Heidi Waterhouse, Principal Developer Advocate at LaunchDarkly, and Lisa Van Gelder, VP of Engineering at Avvir.io, to discuss the importance of safety, the strategies they use to implement it, and how data helps them achieve it. Here are some highlights from their virtual roundtable.
Psychological Safety Heightens Speed and Performance
Lisa: [Psychological safety] gives engineers the ability to fully participate in a team. To give their ideas, to debate ideas, to feel free to take risks, to experiment. And if people don’t feel free to do those things, everything slows down.
Anjuan: I boil psychological safety down to two things, truth and trust. People can live their truth – the truth of their experiences, their history, even the truth of their performance.
Heidi: When I come at psychological safety, I frequently come at it from the sort of scientific side, realizing how much of a difference it makes to the performance of a team. The faster a team moves, the more psychologically safe they are, the more they feel like they can take risks, but also the more they feel like they can take risks, the faster they move.
Learning Your Team’s Lived Experiences Helps Cultivate Safety
Anjuan: I think that leaders have to establish authentic relationships with their directs. One of the easy tactical things to do is to have weekly 1:1s. If you’re a manager and have people who you are responsible for, if you’re not meeting with them weekly in a 1:1, then you’re not engaged in a psychologically safe environment, because you just don’t even know where you are.
[During 1:1s] talk about more than just status or work. Discuss their career and personal goals and see what you can do to be supportive. By having those 1:1s, you begin to get an idea of their background and their profile. You’ll probably find that a number of the people who you work with and who are your directs have gone through trauma brought on by work, especially if they are members of marginalized groups. Knowing [someone’s history] is really important to understanding what team members may not be feeling psychologically safe and steps that you can take to help with that. I’ve never found a one size fits all approach to this. You have to tailor it to the individual people who you’re working with.
Heidi: The more senior we get, the more trauma we have. To this day I have a fear reaction when I’m one-on-one with my manager and they close the door. There’s nothing wrong with closing the door to give me feedback. That is in fact the responsible thing for a manager to do. But I got fired enough at crucial times in my career that I have a fear reaction. And so if I tell my manager [about my fear] they know that, and they preface the conversation with “nothing bad, just a little feedback,” and then I can relax and actually take in the feedback.
I think the idea of moving through the world as a trauma-informed person enables you to be considerate of the scars people are carrying around, becoming a force multiplier for your ability to be a good friend and manager, and to get the best out of the people that you’re working with.
Lisa: It’s not always obvious if your team is having issues with psychological safety. Ideally, they will tell you, but quite often, especially if you are a new leader on a team, they don’t trust you enough to let you in and tell you what’s going on. You kind of have to go into debugging teams mode, observe them, and see what happens. See if there are strange things that they’re doing that you don’t quite understand, because often there’s a safety issue underneath that.
I once had a team that used to hide around the office on Fridays. They weren’t answering emails, they weren’t answering Slacks. They wouldn’t tell me what was going on either. I did try and ask, but I also sat there the rest of the week with them to try and see what was happening. I realized that people were trying to give them work on Fridays and then they would blame them if it wasn’t done by Monday. On the outside it looked like the team was slacking off, when in reality, it was a safety issue. So when I say look for odd things you may have to do a little bit of detective work to see if something’s happening.
Put Metrics in Context
Lisa: When you think about introducing data or metrics onto your team, I encourage you to think about what those metrics are nudging the teams to do in order to meet those metrics, because it’s really easy to accidentally introduce a metric that would harm the psychological safety of your team.
A lot of the time when I come onto a new team, people will say the engineering team is moving too slow, that they want them to go faster and they want to measure this through the velocity of the team. However, it comes with connotations that the team isn’t working hard enough, and can impact the quality of work being delivered.
A metric I love to use instead is Cycle Time. I love it because it’s a full-team metric. [For example], if it takes an engineer two days to complete a story and seven days to deploy it, you have a better idea of where to start digging to spot areas that can be optimized. Cycle Time encourages you to find the bottlenecks in your system as a team and address them. It also encourages you to break stories into smaller pieces because the smaller your stories, the quicker you can get them deployed. They’re good nudges that help a team work together to solve problems.
Heidi: Metrics are useful for building safety and consideration around your team while still figuring out where your gaps and your problems are in a blameless way. Saying like, okay, here’s where things are sticking. How do we unstick them? Is that actually the first cause?

Anjuan: As an engineering leader who’s often called to figure out how to measure my teams and how to support them in getting better, there are a lot of metrics that are well-meaning, but are often counterproductive, like how many lines of code people do each week.
Some languages are simply wordier than others. So you can actually end up penalizing people working in languages where you may need 50 lines in one language but can do it in three in the other. It can also drive developers to add more crud to the codebase because they’re trying to gain in number of lines of code.
So you really need to take a step back and say “what are we measuring? What metrics are we trying to use?” to see if they are serving us well. And, “are they creating an environment where our engineers feel that they can inspect themselves, learn from their experiences, do their best work, or are we doing something where we’re actually harming them?”
Small Changes in Syntax can Improve the Environment
Anjuan: As I mentioned before, you always want to hone in on the lived experiences of the people who come through the doors of your company, whether they’re physical or virtual. There’s so many things that you can do to help take our industry, which is still steeped in colonialism, misogyny, transphobia, and all these horrible things, to begin debugging your work. So for example, at Help Scout, we took the common scrum term “backlog grooming” and changed it to “backlog refinement” because the word “grooming” has negative connotations. That small change was a nod to the fact that we understand that some words can be triggering to some people.
One other quick example: master/slave is used in weird ways in our industry when there’s better terminology out there. You can use “main,” for example. So again, if you look for these terms you can make changes to make a better environment.
Heidi: I love the example of the master/slave terminology because it’s also a safety check for your team. If somebody fights you really hard on that, there’s someone to keep an eye on because they are not considering how other people on the team might feel about it. They are attached the way things were.
Anjuan: We also talk about how, when people use the word “guys,” right? People in Slack will say, “Hey guys, I have a question.” Why are you assuming that everybody in the Slack channel are all male, right? Just [changing] little small things like that, you’re debugging your environment to be more inclusive, to be more open.
To find out more about using data to help foster psychological safety on your team, request a consultation.
As part of our ongoing series on data-driven performance reviews, Code Climate Founder and CEO, Bryan Helmkamp, sat down with Katie Wilde, VP of Engineering at Ambassador Labs, and Smruti Patel, Head of Engineering, LEAP & Data Platform, at Stripe to discuss the intricacies of performance reviews and how to best conduct them with the help of objective data. Read on to learn how leveraging objective data in your reviews can improve retention, mitigate bias, and positively impact developer confidence. To see the conversation in full, check out the recording here.
Performance Reviews – Intended and Ancillary Benefits
Objective data can assist in conducting fair and equitable performance reviews that help to improve retention and save organizations the added expense of sourcing and hiring new talent.
“Engineering hiring right now is extremely difficult, and what would be really great is if you didn’t have to backfill roles on your team. If you manage to retain people, that’s way better than having to hire a bunch of new folks,” Katie says, adding “[Performance reviews] are extremely important for cultivating and retaining our top people and that’s a different ‘why’ to the kind of thing people think of with performance reviews… yeah, sometimes we need to fire people for not doing a good job, but it’s actually far more important to make sure that the people that are doing a fantastic job don’t leave.”
To Katie’s point — a survey conducted by LinkedIn reports that, depending on the role, it can take the average organization over 40 days to fill a technical position, while the US Bureau of Labor Statistics projects that the demand for software engineers will grow 22% over the next decade, signaling hiring challenges to come in the space.
Echoing Katie’s sentiment, Smruti adds “[Data-driven performance reviews] are key for supporting your high performers who want a formal way of [understanding], what does the next year look like? Or what does the next part of the journey look like? And so for me, this process, at the very least, provides missing data where a manager or organization might not even be aware of all the things that [a developer] is involved in, or the initiatives that they’ve led and delivered.”
Using Objective Data to Combat Biases
Biases are a noted flaw of performance reviews, and a great way to mitigate those prejudices is to check assumptions against objective data.
Katie has seen firsthand the inequities gender bias in particular can cause. In one instance, when it came time to review a female engineer, Katie noticed inconsistencies between the engineer’s self-review and her peer reviews. While the engineer had given herself a strong rating, her peers stated that her work pace was a little slow. Katie decided to dig deeper and determine the cause of this discrepancy: had the engineer overstated her own abilities, or were her peers being overly critical?
Using Code Climate, Katie dug into the engineer’s work and discovered that her PRs were in fact moving more slowly through the development pipeline, but not for the reason one might expect. Her PRs were getting held up in code review by change requests, and the requests were often for minor, stylistic changes. Further investigation revealed that requests of this kind were not common across the team, and PRs written by male engineers tended to be approved quickly, without getting stuck in a similar feedback loop. With this information, Katie was able to check her assumptions, calibrate her feedback, and uncover bias in both the review process and the team’s day-to-day work.
Reflecting on the experience, Katie says “So that review cycle for that entire team went a completely different way than if I hadn’t used data. [Without objective data] I absolutely would have done the review of, give all the men great reviews, tell the woman she needs to be more productive and get her act together, that she’s got some decent skills, but she’s got to do a better job, not promote her, and carry on. It’s just quite eye-opening. I am a woman in engineering. I know how hard it is. So yeah, that’s a case where I’m just very grateful to have had that data.”
Articulating Impact with Engineering Data
Many times during the performance review process, ICs are asked to conduct a self-evaluation. This portion of the review process surfaces an opportunity for ICs to share their perspectives on their own performance, actions, and choices. It also helps managers understand how ICs view themselves in relation to their team and the company as a whole.
Citing personal experience, Smruti observed that ICs can be so focused on what they’ve built and delivered, that they often fail to see why their work mattered and the impact it had on the organization. She noticed that this lack of self-advocacy rang especially true for underrepresented minorities. To combat this, Smruti uses data to link individual achievements to verifiable facts to help ICs break the glass ceiling of self-perception.
“So for me, when it comes down to quantifiable or qualitative data, it comes down to finding the right engineering data that best articulates that impact to the team on business goals. So if you think about it, you can use a very irrefutable factor, say, ‘I shipped X, which reduced the end-to-end API latency from 4 or 5 seconds to 2.5 seconds. And this is how it impacted the business.’”
In using objective data, ICs are able to see the impact their work has on their organization, and advocate for themselves to secure promotions and higher salaries.
The Annual Performance Review Process, Optimized
With Engineering Intelligence data at their fingertips, leaders can develop a review approach that places quantitative and qualitative data into context to deliver meaningful and actionable feedback that promotes the well-being of ICs and the growth of their teams.
Speak to a Code Climate expert and see for yourself how data can help you conduct more effective annual performance reviews and drive engineering excellence.
Standups are a cornerstone of the Agile process and an essential ceremony in many engineering organizations. A great way to facilitate knowledge sharing, team cohesion, collaboration, and more, standups can help keep projects on track and clear of roadblocks. However, standups as we know them are in need of some TLC. When you meet with your team every day and ask the same questions, it can get monotonous, and engagement may be lackluster.
To step up your team’s standups, you’ll need to move beyond the typical standup questions. A Software Engineering Intelligence (SEI) platform like Code Climate can help you do that, making it possible to get your status updates before standup, so you can spend the meeting digging into at-risk work, addressing potential blockers, and helping to drive work forward. Code Climate aggregates data from DevOps and project management tools, acting as a single pane of glass for engineering managers to gain visibility into their team’s sprints and help them better prepare for the day ahead.
Without the help of an SEI platform, your standup likely looks something like this:
Engineering Manager to Dev: What will you do today?
Dev: Today I’m finishing up the Health Check feature. Dev2 had been working on it all week, but they passed it on to me before taking their vacation. Should have everything I need.
Engineering Manager: Great, let me know if there’s anything you’re missing.
Short and perfunctory, this conversation only skimmed the surface.
With the help of a Software Engineering Intelligence (SEI) solution, an engineering manager can more clearly identify at-risk work and potential blockers before standup, so they know exactly what to ask to get past surface-level updates. That means standup can look more like this:
Dev: Today I’m finishing up the Health Check feature. Dev2 had been working on it all week, but they passed it on to me before taking their vacation. Should have everything I need.
Engineering Manager: Ok, I also see there were multiple discussions on the feature that required you to make a change in the code two weeks ago. Did the requirements change?
Dev: Actually, there have been bugs reported so I am adjusting my approach.
Engineering Manager: Ok, let’s grab some time this morning to walk through your approach step-by-step as this has been a tricky part of the codebase.
Because the manager came to standup with context on the PR in question, they were able to dig deeper and ask questions that uncovered potential risks. Both parties were then able to walk away from standup with clear objectives and next steps to keep the sprint healthy and on track.
There are many ways to structure standups, but one fact always rings true — the more prepared you are walking into standup, the more effective your meeting will be. Request a consultation to learn more.

Engineering leaders looking to drive high performance and achieve Continuous Delivery often hear that metrics are the answer.
With metrics, it’s possible to objectively evaluate your team’s progress, measure it against industry benchmarks, and set targets for improvement.
But how should metrics be used? If you’re looking to translate Continuous Delivery ideals into actual practices and processes, where should you start?
In this free, 30-minute on-demand webinar, Code Climate Engineering Data Specialist, Nico Snyder, explains how Velocity metrics can help you implement Continuous Delivery best practices on your team.
He offers actionable strategies for:
- Identifying the metrics that matter most in your organization
- Using metrics to understand where your team stands
- Setting quantitative targets and driving progress towards those goals
To find out more about how engineering metrics can help your team, reach out to one of our product specialists.
In this free, 45-minute webinar for CTOs, VPs, and managers of managers, we explain how an engineering analytics tool like Velocity can help every member of your team excel — whether they’re a new hire or an emerging leader.
- Code Climate Engineering Data Specialist, Sherianne Bolling, walks through the Velocity metrics and reports you need to scale your team while empowering ICs and managers to level up.
- CTO of Greenlight, James Gaythwaite, discusses how Velocity metrics are helping him lead his team through a period of hyper growth. With Velocity, he is able to:
- Support new hires struggling to get up to speed
- Identify high performers and give them opportunities to grow into leaders
- Empower managers to improve team processes and become more effective coaches
To find out how Velocity can help you level up members of your team, reach out and talk to a product specialist.