Resources & Insights
Featured Article
Navigating the world of software engineering or developer productivity insights can feel like trying to solve a complex puzzle, especially for large-scale organizations. It's one of those areas where having a cohesive strategy can make all the difference between success and frustration. Over the years, as I’ve worked with enterprise-level organizations, I’ve seen countless instances where a lack of strategy caused initiatives to fail or fizzle out.
In my latest webinar, I breakdown the key components engineering leaders need to consider when building an insights strategy.
Why a Strategy Matters
At the heart of every successful software engineering team is a drive for three things:
- A culture of continuous improvement
- The ability to move from idea to impact quickly, frequently, and with confidence
- A software organization delivering meaningful value
These goals sound simple enough, but in reality, achieving them requires more than just wishing for better performance. It takes data, action, and, most importantly, a cultural shift. And here's the catch: those three things don't come together by accident.
In my experience, whenever a large-scale change fails, there's one common denominator: a lack of a cohesive strategy. Every time I’ve witnessed a failed attempt at implementing new technology or making a big shift, the missing piece was always that strategic foundation. Without a clear, aligned strategy, you're not just wasting resources—you’re creating frustration across the entire organization.
Sign up for a free, expert-led insights strategy workshop for your enterprise org.
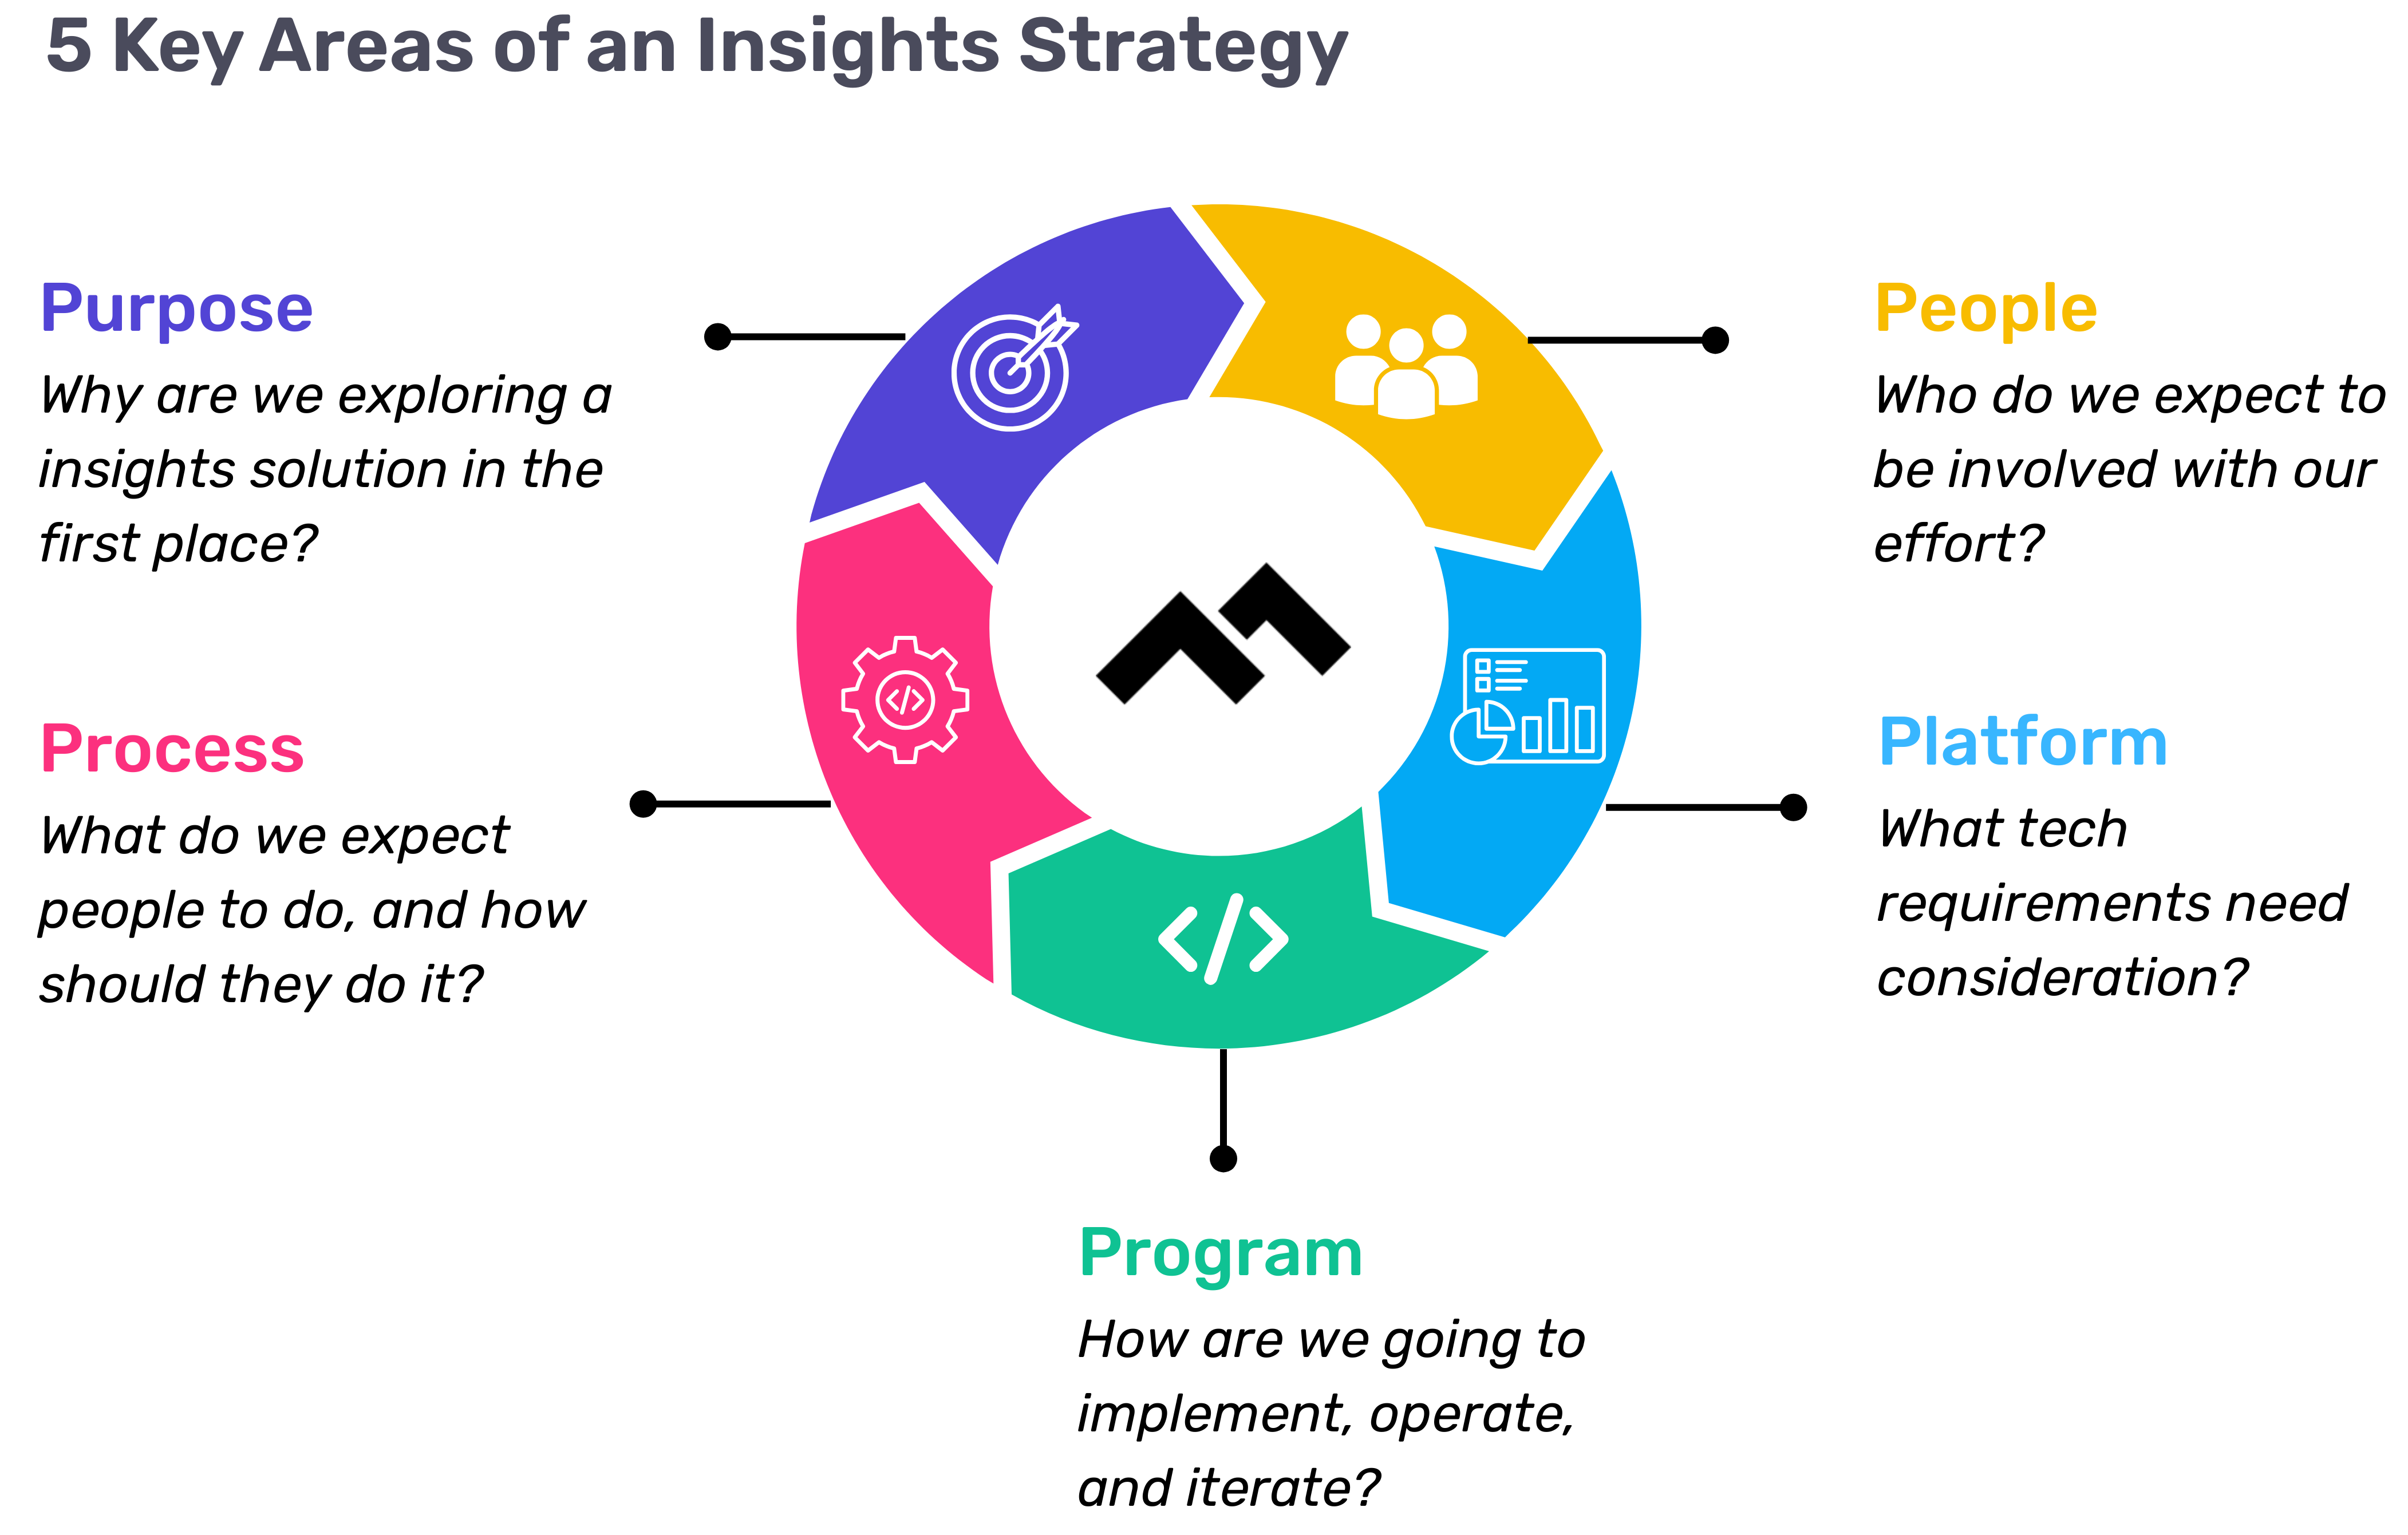
Step 1: Define Your Purpose
The first step in any successful engineering insights strategy is defining why you're doing this in the first place. If you're rolling out developer productivity metrics or an insights platform, you need to make sure there’s alignment on the purpose across the board.
Too often, organizations dive into this journey without answering the crucial question: Why do we need this data? If you ask five different leaders in your organization, are you going to get five answers, or will they all point to the same objective? If you can’t answer this clearly, you risk chasing a vague, unhelpful path.
One way I recommend approaching this is through the "Five Whys" technique. Ask why you're doing this, and then keep asking "why" until you get to the core of the problem. For example, if your initial answer is, “We need engineering metrics,” ask why. The next answer might be, “Because we're missing deliverables.” Keep going until you identify the true purpose behind the initiative. Understanding that purpose helps avoid unnecessary distractions and lets you focus on solving the real issue.
Step 2: Understand Your People
Once the purpose is clear, the next step is to think about who will be involved in this journey. You have to consider the following:
- Who will be using the developer productivity tool/insights platform?
- Are these hands-on developers or executives looking for high-level insights?
- Who else in the organization might need access to the data, like finance or operations teams?
It’s also crucial to account for organizational changes. Reorgs are common in the enterprise world, and as your organization evolves, so too must your insights platform. If the people responsible for the platform’s maintenance change, who will ensure the data remains relevant to the new structure? Too often, teams stop using insights platforms because the data no longer reflects the current state of the organization. You need to have the right people in place to ensure continuous alignment and relevance.
Step 3: Define Your Process
The next key component is process—a step that many organizations overlook. It's easy to say, "We have the data now," but then what happens? What do you expect people to do with the data once it’s available? And how do you track if those actions are leading to improvement?
A common mistake I see is organizations focusing on metrics without a clear action plan. Instead of just looking at a metric like PR cycle times, the goal should be to first identify the problem you're trying to solve. If the problem is poor code quality, then improving the review cycle times might help, but only because it’s part of a larger process of improving quality, not just for the sake of improving the metric.
It’s also essential to approach this with an experimentation mindset. For example, start by identifying an area for improvement, make a hypothesis about how to improve it, then test it and use engineering insights data to see if your hypothesis is correct. Starting with a metric and trying to manipulate it is a quick way to lose sight of your larger purpose.
Step 4: Program and Rollout Strategy
The next piece of the puzzle is your program and rollout strategy. It’s easy to roll out an engineering insights platform and expect people to just log in and start using it, but that’s not enough. You need to think about how you'll introduce this new tool to the various stakeholders across different teams and business units.
The key here is to design a value loop within a smaller team or department first. Get a team to go through the full cycle of seeing the insights, taking action, and then quantifying the impact of that action. Once you've done this on a smaller scale, you can share success stories and roll it out more broadly across the organization. It’s not about whether people are logging into the platform—it’s about whether they’re driving meaningful change based on the insights.
Step 5: Choose Your Platform Wisely
And finally, we come to the platform itself. It’s the shiny object that many organizations focus on first, but as I’ve said before, it’s the last piece of the puzzle, not the first. Engineering insights platforms like Code Climate are powerful tools, but they can’t solve the problem of a poorly defined strategy.
I’ve seen organizations spend months evaluating these platforms, only to realize they didn't even know what they needed. One company in the telecom industry realized that no available platform suited their needs, so they chose to build their own. The key takeaway here is that your platform should align with your strategy—not the other way around. You should understand your purpose, people, and process before you even begin evaluating platforms.
Looking Ahead
To build a successful engineering insights strategy, you need to go beyond just installing a tool. An insights platform can only work if it’s supported by a clear purpose, the right people, a well-defined process, and a program that rolls it out effectively. The combination of these elements will ensure that your insights platform isn’t just a dashboard—it becomes a powerful driver of change and improvement in your organization.
Remember, a successful software engineering insights strategy isn’t just about the tool. It’s about building a culture of data-driven decision-making, fostering continuous improvement, and aligning all your teams toward achieving business outcomes. When you get that right, the value of engineering insights becomes clear.
Want to build a tailored engineering insights strategy for your enterprise organization? Get expert recommendations at our free insights strategy workshop. Register here.Register here.
Andrew Gassen has guided Fortune 500 companies and large government agencies through complex digital transformations. He specializes in embedding data-driven, experiment-led approaches within enterprise environments, helping organizations build a culture of continuous improvement and thrive in a rapidly evolving world.

Navigating the world of software engineering or developer productivity insights can feel like trying to solve a complex puzzle, especially for large-scale organizations. It's one of those areas where having a cohesive strategy can make all the difference between success and frustration. Over the years, as I’ve worked with enterprise-level organizations, I’ve seen countless instances where a lack of strategy caused initiatives to fail or fizzle out.
In my latest webinar, I breakdown the key components engineering leaders need to consider when building an insights strategy.
Why a Strategy Matters
At the heart of every successful software engineering team is a drive for three things:
- A culture of continuous improvement
- The ability to move from idea to impact quickly, frequently, and with confidence
- A software organization delivering meaningful value
These goals sound simple enough, but in reality, achieving them requires more than just wishing for better performance. It takes data, action, and, most importantly, a cultural shift. And here's the catch: those three things don't come together by accident.
In my experience, whenever a large-scale change fails, there's one common denominator: a lack of a cohesive strategy. Every time I’ve witnessed a failed attempt at implementing new technology or making a big shift, the missing piece was always that strategic foundation. Without a clear, aligned strategy, you're not just wasting resources—you’re creating frustration across the entire organization.
Sign up for a free, expert-led insights strategy workshop for your enterprise org.
Step 1: Define Your Purpose
The first step in any successful engineering insights strategy is defining why you're doing this in the first place. If you're rolling out developer productivity metrics or an insights platform, you need to make sure there’s alignment on the purpose across the board.
Too often, organizations dive into this journey without answering the crucial question: Why do we need this data? If you ask five different leaders in your organization, are you going to get five answers, or will they all point to the same objective? If you can’t answer this clearly, you risk chasing a vague, unhelpful path.
One way I recommend approaching this is through the "Five Whys" technique. Ask why you're doing this, and then keep asking "why" until you get to the core of the problem. For example, if your initial answer is, “We need engineering metrics,” ask why. The next answer might be, “Because we're missing deliverables.” Keep going until you identify the true purpose behind the initiative. Understanding that purpose helps avoid unnecessary distractions and lets you focus on solving the real issue.
Step 2: Understand Your People
Once the purpose is clear, the next step is to think about who will be involved in this journey. You have to consider the following:
- Who will be using the developer productivity tool/insights platform?
- Are these hands-on developers or executives looking for high-level insights?
- Who else in the organization might need access to the data, like finance or operations teams?
It’s also crucial to account for organizational changes. Reorgs are common in the enterprise world, and as your organization evolves, so too must your insights platform. If the people responsible for the platform’s maintenance change, who will ensure the data remains relevant to the new structure? Too often, teams stop using insights platforms because the data no longer reflects the current state of the organization. You need to have the right people in place to ensure continuous alignment and relevance.
Step 3: Define Your Process
The next key component is process—a step that many organizations overlook. It's easy to say, "We have the data now," but then what happens? What do you expect people to do with the data once it’s available? And how do you track if those actions are leading to improvement?
A common mistake I see is organizations focusing on metrics without a clear action plan. Instead of just looking at a metric like PR cycle times, the goal should be to first identify the problem you're trying to solve. If the problem is poor code quality, then improving the review cycle times might help, but only because it’s part of a larger process of improving quality, not just for the sake of improving the metric.
It’s also essential to approach this with an experimentation mindset. For example, start by identifying an area for improvement, make a hypothesis about how to improve it, then test it and use engineering insights data to see if your hypothesis is correct. Starting with a metric and trying to manipulate it is a quick way to lose sight of your larger purpose.
Step 4: Program and Rollout Strategy
The next piece of the puzzle is your program and rollout strategy. It’s easy to roll out an engineering insights platform and expect people to just log in and start using it, but that’s not enough. You need to think about how you'll introduce this new tool to the various stakeholders across different teams and business units.
The key here is to design a value loop within a smaller team or department first. Get a team to go through the full cycle of seeing the insights, taking action, and then quantifying the impact of that action. Once you've done this on a smaller scale, you can share success stories and roll it out more broadly across the organization. It’s not about whether people are logging into the platform—it’s about whether they’re driving meaningful change based on the insights.
Step 5: Choose Your Platform Wisely
And finally, we come to the platform itself. It’s the shiny object that many organizations focus on first, but as I’ve said before, it’s the last piece of the puzzle, not the first. Engineering insights platforms like Code Climate are powerful tools, but they can’t solve the problem of a poorly defined strategy.
I’ve seen organizations spend months evaluating these platforms, only to realize they didn't even know what they needed. One company in the telecom industry realized that no available platform suited their needs, so they chose to build their own. The key takeaway here is that your platform should align with your strategy—not the other way around. You should understand your purpose, people, and process before you even begin evaluating platforms.
Looking Ahead
To build a successful engineering insights strategy, you need to go beyond just installing a tool. An insights platform can only work if it’s supported by a clear purpose, the right people, a well-defined process, and a program that rolls it out effectively. The combination of these elements will ensure that your insights platform isn’t just a dashboard—it becomes a powerful driver of change and improvement in your organization.
Remember, a successful software engineering insights strategy isn’t just about the tool. It’s about building a culture of data-driven decision-making, fostering continuous improvement, and aligning all your teams toward achieving business outcomes. When you get that right, the value of engineering insights becomes clear.
Want to build a tailored engineering insights strategy for your enterprise organization? Get expert recommendations at our free insights strategy workshop. Register here.Register here.
Andrew Gassen has guided Fortune 500 companies and large government agencies through complex digital transformations. He specializes in embedding data-driven, experiment-led approaches within enterprise environments, helping organizations build a culture of continuous improvement and thrive in a rapidly evolving world.
All Articles

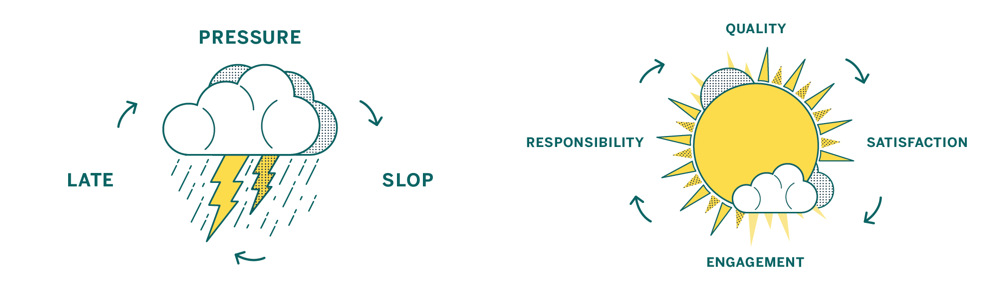
If you’ve spent any amount of time working with software professionally, chances are you’ve experienced the vicious cycle of development (if you haven’t, take a moment to count your blessings then read on for a cautionary tale):

High pressure situations place strain on developers, which leads to sloppy work, resulting in software being delivered late and broken – when it’s delivered at all.
Instead of being pressure-driven, as in the cycle pictured above, we’re aiming for a “virtuous cycle” which focuses on quality:
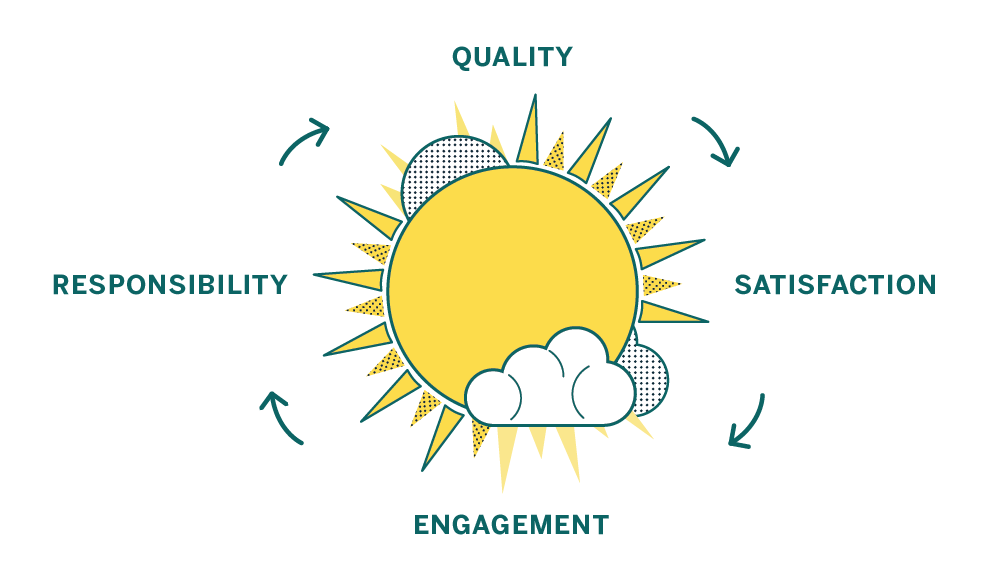
A focus on quality leaves individual contributors feeling satisfied, which makes them more engaged. That engagement leads to a sense of responsibility over the product and the code. A sense of responsibility and ownership leads to higher quality work, and the cycle starts over again.
Here at Code Climate we have experience as software engineers, engineering managers, product owners, and startup founders – and in all those roles we’ve seen evidence that a commitment to code quality has amazing benefits. Over time your codebase will become healthier, making it easier to change, more fun to work with, and your features will be easier to implement. As a result your code will be more reliable when it runs, bringing benefits to your business. Sounds good, right?
Unfortunately, breaking out of a vicious cycle is challenging because the cycle feeds on itself and doesn’t allow much time for the work needed to establish good practices. But while there is work involved, it’s definitely not impossible, and good tools and advice can help you beat the clock and replace your vicious cycle with a culture of code quality.
We’ve identified steps you can take to move toward a sustainable culture of code quality, no matter what kind of code you’re working with:
- Codify your best practices
- Automate, automate, automate
- Get the right info to the right people
- Measure your progress
- Encourage participation and ownership

Developers have access to a variety of tools to help ensure that the code they produce doesn’t break, works as intended, and is easy to understand. Among them are tools that use static analysis.
Static analysis is a technique used to discover issues in your code without actually running it.
Finding issues with your code before it runs is a good thing because it means that you can address issues before they hit production, before they bother users, or before they are costly in any way. Because so much research attention has been paid to static analysis over the years, it’s possible to find all kinds of interesting problems in code without executing it — it really seems like magic!
Let’s start with a small example of the kind of simple things that static analysis can uncover that can save you actual time during development, and prevent real bugs and maintainability issues. Check out this snippet of JavaScript code:
function main(a,b){ return a == null; }
An experienced JavaScript developer looking at this code can probably note a couple of things right off the bat:
- The ‘b’ variable is unused in the function
- The function name ‘main’ is not descriptive of its functionality
- You should use
===, not==when comparing tonull
While a less seasoned developer might miss #3 or disagree with #2, at least two of these, #1 and #3, can be automatically detected by static analysis. That’s right — instead of a developer having to context switch and review simple things, you can have it done automatically. And as the old saying goes (okay, it’s not an old saying, we just made it up):
When in doubt, automate.
So what kinds of issues can static analysis find? Let’s take a look:
- Quality issues themselves come in a variety of flavors. You can discuss quality in terms of code clarity, bug risk, and complexity, to name a few. Different issues require different means of detection, but many quality issues boil down to analysis that understands the conventions of the programming language under scrutiny. Tools developed within programming language communities tend to enforce the idioms of that community, which can be a very helpful thing in static analysis.
- Security is important to most users of static analysis, and a wide range of issues can be detected. Simple security checks can take the form of making sure that your dependencies are up-to-date or enforcing the deprecation of unsafe functions or APIs. Sophisticated security checks can do what is called data flow analysis, where the paths of data that come from “outside” of the system are extrapolated using complex algorithms.
- Style issues in code are often trivial to detect, but implementing and maintaining consistent style guidelines is a key component of an effective code review process and a maintainable codebase. Simply taking discussions about style off the table can work wonders for a team that tends to quarrel endlessly over the nitpicking style issues that, in the long run, can be automated away.
Between quality, security, and style, static analysis is a serious power-up for your development workflow. So how do you get in on this?
The most useful places to get static analysis results are on your developer’s machines, and again in your team’s pull requests. Fortunately, Code Climate does both.
With our command line tool, you can run a variety of static analysis tools at once to enforce your team’s standards and also look for subtle bugs, complexity issues, duplication, and more. As everyone on your team has access to these tools locally, they can make sure that they aren’t introducing new issues when they push code, improving the quality of commits.
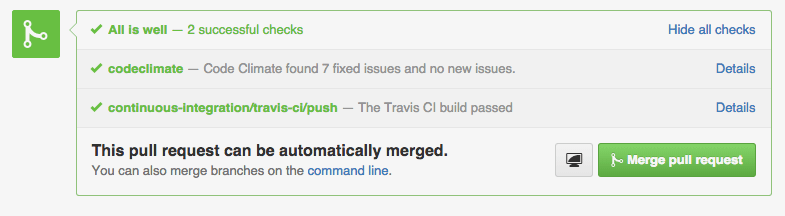
After you push, analysis is run on the Code Climate server and the results pushed directly to your pull request. Reviewers can instantly see that your code doesn’t introduce new errors, letting them focus on reviewing the aspects of the commit which require human expertise.
Once you get some automated static analysis in your workflow, you’ll wonder how you lived without it. The tedious but necessary tasks that burn out your best developers are the ones at which computers excel – and will ensure your code is secure, not prone to a variety of annoying bugs, and conforms to your team’s best practices. We suggest checking it out today!

In our first post, we looked at how pressure-driven development leads to sloppy code and saw how shifting focus from deadlines to quality leads to happier, more productive teams. In this part, we’ll cover in detail five steps you can take to make that shift, so you have an actionable plan for building a culture of quality in your team.
1. Codify your best practices
Establish a shared and agreed-upon style and standard.
One of the best first steps you can take as a team is to start working on a style guide for the various languages and frameworks you use.
Style guides reduce friction because they take a whole class of issues off the table during code review. They enforce standards by codifying best practices. And best of all, style guides make contribution easier because people will know your project’s contribution requirements up front.
There are lots of great examples online, like GitHub’s Ruby Style Guide or Airbnb’s JavaScript Style Guide. They each represent the guidelines of contributing code to existing projects in those organizations, and guide how code is written when new projects are made.
2. Automate, automate, automate
Let your tools work for you.
When it comes to working on your internal process and company culture, it’s important that any improvements you introduce are perceived as being worth any additional work involved. Style guides are one great example of this, as enforcing a style guide is a much longer project than creating one.
To reduce the amount of work for your engineers, project managers, and QA team, seek to automate whatever tools they are using as part of your overall process. Relieve your team of the burden of running tests locally, and instead run them automatically on a centralized CI server. Instead of relying on everyone to run multiple code quality tools locally, run them simultaneously and automatically with Code Climate. Reducing the friction inherent in running these tools will make a big impact in your organization.
3. Get feedback in the right places
Bring the right data to the right people at the right time.
Once you’ve automated your build process and style guide enforcement, it’s time to make sure that the information gets to the right people. Don’t make people go to the data, bring the data to the people.
Tools that can post where your developers work – like in a GitHub Pull Request – have an advantage of those that don’t. Bringing feedback about code that doesn’t pass the style guide, or doesn’t pass tests inline with code review as it happens makes a huge impact.
When people see data, they can act on it. It’s as simple as that.
4. Measure your progress
Quantify what matters to you.
Building a culture of code quality means creating quantitative goals, and having quantitative goals depends on having stuff that you can measure. Tools like Code Climate can help you create guidelines for progress, and offer ways for your team to see the impact that they are having on the code over time.
Once you have metrics like the GPA of your Code Climate repo or the number of issues found by Code Climate’s static analysis engines, you can begin to act on them. To start with, though, there are just two guidelines you need to keep in mind to observe your code quality improving, your communication getting easier, and your results coming faster:
- Leave code better than you found it
- Don’t introduce new files that aren’t up to quality standards
When you focus on the impact of every proposed change to your code, you’ll improve with every commit.
5. Encourage participation and ownership
Once your tools are set up and running smoothly, it’s up to your team to enforce standards and welcome feedback evenly. You’ll find that getting these best practices in place involves making many compromises: older projects will have established standards while new projects may be opportunities to explore new ideas.
When every individual on every team is working along with a set of automated tools that provide actionable, quantified data, you’re on your way to a culture of code quality. Remember that your team wants to execute at the highest possible levels, and everyone participating in an open, encouraging atmosphere will activate the potential of the virtuous cycle.
Getting there takes time and energy, but we think the steps outlined here will send you well on your way. You’ll be able to measure your progress, react when necessary, and stay on top of your goals: to ship awesome stuff, and achieve a virtuous cycle that perpetuates healthy code and happy developers.

Today we’re excited to announce that the Code Climate Quality platform is out of beta. When we launched the first open, extensible platform for static analysis back in June of last year, we knew it would take some time to perfect. Since then, we’ve been working hard to add features, fix bugs, support community contributors, and upgrade infrastructure to create a superior experience for developers everywhere.
Our engines-based analysis now offers the key features you’ve come to expect from our “classic” offering, and a lot more, including:
- Style checks for Ruby, PHP and Python
- Support for more programming languages like Go, Haskell, JSX, CoffeeScript and SCSS; and frameworks like Ember.js, React and RubyMotion
- Dependency audits for potential vulnerabilities in your RubyGems and NPM packages
- Atom editor integration and a CLI to get feedback before you push
- Improved configurability and tuning options support in
.codeclimate.yml(and per-engine config files) - Ability to create your own analysis engines using our open source spec and make them available through CodeClimate.com
Already, Code Climate serves tens of thousands of developers. We’re proud to be working with a community of over 100 contributors and members of our Developer Program to provide over 1,800 checks across 20 static analysis engines on our new platform.
"Code Climate allows us to incrementally improve and maintain good code hygiene, decreasing the number of defects in our products, and leading to better overall product quality. The Code Climate open platform is a game changer and allows us to build and improve static analysis engines to support our highly complex environment." — Andy Blyler, Senior Director of Engineering, Barracuda Networks
For those who gave our engines-based analysis a try soon after launch, in addition to bug fixes you’ll notice a number of key improvements, including:
- Visibility into the analysis process via our new Builds pages
- More accurate ratings and GPAs
- Improved Issues browsing and filtering
- Better performance for faster results
- Improved stability from infrastructure upgrades we’ve made behind the scenes
Want to see it for yourself? Take a look!
Start using the Code Climate Quality platform today
Sign up today to get started with Code Climate Quality for your projects.
For existing customers, just follow these instructions for moving your repositories over to our new engines-based analysis. We’re confident that you’ll find it’s a superior experience to our “classic” offering.
Finally, we recognize that Code Climate is most valuable when you can use it wherever your work. For customers whose ability to host code with third-party services is limited, we recommend Code Climate Enterprise, our on-premise service.
With the new foundation that the Code Climate Quality platform provides, we’re looking forward to the new opportunities we’ll have to bring you even more functionality. Stay tuned for more big announcements (you can follow us on Twitter here).

We’re thrilled today to share a project we’ve been working on for some time −editor integrationwith GitHub’s awesomeAtomtext editor. We’re super excited about it, and since it’s customary to express one’s excitement with an animated GIF, we’ve done just that:
This integration takes advantage of Code Climate’s unique platform, allowing you to seamlessly aggregate the results from all of your favorite static analysis tools into one clear, unified report. Our CLI makes it easy to get those results right on your laptop, before code is merged − and now the same is true inside your text editor:
Integration with Atom is powered by theAtom Linter project, a fantastic, open toolset for integrating static analysis into Atom. We collaborated with the Linter team to provide you with the best possible Atom experience, and we think you’re going to love being able to use Code Climate in your editor.
To get started, you’ll need to have theCode Climate CLIinstalled. If you’re using a Mac withbrew, installing is as simple as:
brew tap codeclimate/formulae brew install codeclimate
Oncebrewis done, you’ll want to make sure that the engines you need to analyze your code are installed locally. If the repo you want to analyze already includes a.codeclimate.ymlfile, you can run:
cd MYPROJECT codeclimate engines:install
When you’ve got the CLI up and running, you’re ready to see analysis results within the comfort of Atom. Install thelinterandlinter-codeclimatepackages using the UI or like so:
apm install linter apm install linter-codeclimate
After the packages are installed, reload your editor. Now, when you save a file it will kick off Code Climate analysis – woot! You’ll see your results inline, as in the screenshot above.
Currently our Atom package supports analysis engines for JavaScript, Ruby, Python, CoffeeScript and PHP (plus the perennial favorite FIXME, for all of your bug-finding needs). We’ll ship an update soon which will include support for the balance of our engines.
We hope you’re as excited as we are to have so much powerful analysis available right inside Atom. Being able to get feedback to developerswhere they workhas always been at the core of our mission, and editor integration is a big step for us in that regard. If you’re interested in building support for your favorite editor shoot an email tomrb@codeclimate.comand we’ll help get you started! Building tools that suit your workflow is what Code Climate is all about.

Recently, we announced the release of the Code Climate Quality platform, which lets anyone create and deploy static analysis tools to an audience of over 50,000 developers. These Open Source static analysis tools are called “engines" or "plugins," and in this post I’ll show you how to create one from scratch.
We’ll create a plugin that greps through your source code and looks for instances of problematic words like FIXME, TODO, and BUG. This plugin conforms to the Code Climate plugin specification, and all of the code for this plugin is available on GitHub. When we get up and running, you’ll see results like this on your command line:
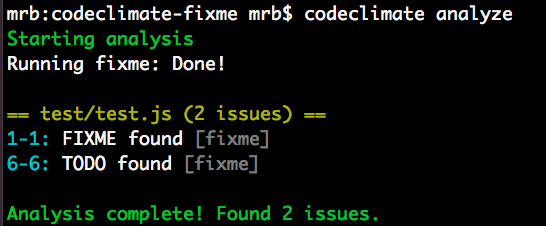
Plugins that you create can be tested with the Code Climate command line tool. Once you’ve got an Open Source plugins that works, we’d love to chat with you about making it available on our cloud platform, so that your whole community can have access to it!
For more information join our Developer Program.
What’s a plugin made of?
Instead of asking you to dive into the Code Climate plugin specification, to learn what a plugin is, I’ll give you a brief overview here.
A Code Climate plugin is a containerized program which analyzes source code and prints issues in JSON to STDOUT.
Sound simple? We really think it is! Hopefully this blog post will illustrate what we mean.
More concretely, the FIXME plugin we’re going to create contains three important files:
- A
Dockerfilewhich specifies the Docker image - A
bin/fixmeexecutable wrapper script that runs the plugin - The
index.jsfile, which contains the plugin source code
There are other requirements in the specification regarding resource allocation, timing, and the shape of the output data (which we’ll see more of below), but that’s really all there is to it.
A little bit of setup
Before we write any code, you need a few things running locally to test your plugin, so you might as well get that out of the way now. You’ll need the following things running locally:
- A Docker environment (we recommend Docker For Mac for OSX development.
- The Code Climate CLI tool (you can
brew tap codeclimate/formulae && brew install codeclimateon OSX)
Run codeclimate -v when you’re done. If it prints a version number, you should be ready to go!
FIXME
The idea for FIXME came to us when we were brainstorming new plugin ideas which were both high value and easy to implement. We wanted to release a sort of Hello, world plugin, but didn’t want it to be one that did something totally pointless. Thus, FIXME was born.
The FIXME plugin looks for (case-insensitive, whole word) instances of the following strings in your project’s files:
- TODO
- FIXME
- HACK
- BUG
- XXX
This is not a novel idea. It’s well known that instances of these phrases in your code are lurking problems, waiting to manifest themselves when you least expect it. We also felt it worth implementing because running a FIXME plugin in your workflow has the following benefits:
- Existing
FIXMEs hacks will be more visible to you and your team - New
FIXMEs will bubble up and can even fail your pull requests if you configure them properly on codeclimate.com
Pretty nifty for around 75 lines of code.
To achieve this, the plugin performs a case insensitive grep command on all of the files you specify, and emits Code Climate issues wherever it finds one.
Implementing an plugin in JavaScript
The meat of the actual plugin is in the index.js file, which contains around 50 lines of JavaScript. The entirety of the file can be found here. I’ll highlight a few important sections of the code for the plugin below, but if you have any questions, please open an issue on the GitHub repo and I’ll try my best to answer promptly!
On to the code. After requiring our dependencies and typing out the module boilerplate, we put the phrases we want to find in grep pattern format:
var fixmeStrings = "'(FIXME|TODO|HACK|XXX|BUG)'";
This will be used in a case insensitive search against all of the files the plugin we’ll analyze.
Next, we create a function that we will use to print issues to STDOUT according to the issue data type specification in the plugin spec. The printIssue function accepts a file name, a line number, and the issue string,
var printIssue = function(fileName, lineNum, matchedString){
  var issue = {
    "type": "issue",
    "check_name": "FIXME found",
    "description": matchedString + " found",
    "categories": ["Bug Risk"],
    "location":{
      "path": fileName,
      "lines": {
        "begin": lineNum,
        "end": lineNum
      }
    }
  };

  // Issues must be followed by a null byte
  var issueString = JSON.stringify(matchedString)+"\0";
  console.log(issueString);
}
This data format contains information about the location, category, and description of each issue your plugin emits. It’s at the heart of our plugin specification and massaging data from an existing tool to conform to this format is typically straightforward.
The data in the JSON your plugin prints will be consumed by the CLI and if you join our Developer Program and work with us, it can also be made available to all users of Quality. We’ll work with you to ensure your plugin is spec compliant and meets our security and performance standards, and get your work in front of a lot of people!
The actual code that greps each file isn’t super interesting, but you should check it out on GitHub and open an issue on the repo if you have a question.
Because it’s a requirement of plugins to respect the file exclusion rules passed to it by the CLI or our cloud services, though, I’ll show a bit of how that works:
// Uses glob to traverse code directory and find files to analyze,
// excluding files passed in with by CLI config
var fileWalk = function(excludePaths){
  var analysisFiles = [];
  var allFiles = glob.sync("/code/**/**", {});

  allFiles.forEach(function(file, i, a){
    if(excludePaths.indexOf(file.split("/code/")[1]) < 0) {
      if(!fs.lstatSync(file).isDirectory()){
        analysisFiles.push(file);
      }
    }
  });

  return analysisFiles;
}
Here I am using the NPM glob module to iterate over all of the files starting at /code recursively. This location also comes from the plugin specification. The fileWalk function takes an array of excludePaths, which it extracts from /config.json (this will be made available to your plugin after the CLI parses a project’s .codeclimate.yml file). This all happens in the main function of the plugin, runEngine:
FixMe.prototype.runEngine = function(){
  // Check for existence of config.json, parse exclude paths if it exists
  if (fs.existsSync("/config.json")) {
    var engineConfig = JSON.parse(fs.readFileSync("/config.json"));
    var excludePaths = engineConfig.exclude_paths;
  } else {
    var excludePaths = [];
  }

  // Walk /code/ path and find files to analyze
  var analysisFiles = fileWalk(excludePaths);

  // Execute main loop and find fixmes in valid files
  analysisFiles.forEach(function(f, i, a){
    findFixmes(f);
  });
}
This main function gives hopefully gives you a clear picture of what this plugin does:
- It parses a JSON file and extracts an array of files to exclude from analysis
- It passes this list of files to a function that walks all files available to the plugin, and produces a list of files to be analyzed
- It passes the list of analyzable files to the
findFixmesfunction, which greps individual files and prints them to STDOUT
Packaging it up
How plugins are packaged as Docker containers is important: it has its own section of the plugin specification. The Dockerfile for FIXME is pretty typical:
FROM node

MAINTAINER Michael R. Bernstein

RUN useradd -u 9000 -r -s /bin/false app

RUN npm install glob

WORKDIR /code
COPY . /usr/src/app

USER app
VOLUME /code

CMD ["/usr/src/app/bin/fixme"]
Here’s a breakdown of each line (for more information about each directive, see the official Docker documentation):
- The official
nodeDocker container is the basis for this plugin container. It hasnodeandnpminstalled, and generally makes our lives easier. - Declare a maintainer for the container.
- Create the
appuser to run the command as specified. - Install packages with
npm install globso that the external dependency is available when the plugin runes. - Set the
WORKDIRto/code, where the source to be analyzed will be mounted. - Copy the plugin code to
/usr/src/app. - Use the
appuser that we created earlier. - Mount
/codeas aVOLUMEper the spec - Our plugin specification says that the plugin should launch and run immediately, so we use
CMDto achieve this. In the case ofFIXME, the executable wrapper script instantiates the plugin we wrote in JavaScript above, and runs it. Check it out:
#!/usr/bin/env node

var FixMe = require('../index');
var fixMe = new FixMe();

fixMe.runEngine();
We now have all of the pieces in places. Let’s test it out.
Testing your plugin locally
If you want to test the code for this plugin locally, you can clone the codeclimate-fixme repository locally, and follow these steps:
- Build the docker image with
docker build -t codeclimate/codeclimate-fixme .(You must be inside the project directory to do this) - Make sure the plugin is enabled in the
.codeclimate.ymlfile of the project you want to analyze:
  engines:
    fixme:
      enabled: true
- Test the plugin against the plugin code itself (whoooah) with
codeclimate analyze --dev
And you should see some results from test/test.js! Pretty cool, right?
Note that if you want to test modifications you are making to this plugin, you should build the image with a different image name, e.g. codeclimate/codeclimate-fixme-YOURNAME. You would then add fixme-YOURNAME to your .codeclimate.yml file as well.
If you get stuck during development, invoke codeclimate console and run:
Analyze.new(['-e', 'my-engine', '--dev']).run
And you should be able to see what’s going on under the hood.
What will you build?
Hopefully seeing how straightforward an plugin can be will give you lots of great ideas for plugins you can implement on your own. If tools for your language don’t exist, contact us, and maybe we can help you out!
Simple ideas like FIXME have a lot of power when your entire team has access to them. Wire up the codeclimate CLI tool in your build process, push your repositories to Code Climate, and keep pursuing healthy code. We can’t wait to see what you’ll build.

Update: See our CEO and Co-Founder Bryan Helmkamp introducing the Code Climate Quality Platform!
Today, we’re thrilled to launch the Code Climate Quality Platform − the first open, extensible platform for all types of static analysis.
We’ve come a long way since we started building a static analysis tool for Rubyists. Today, we’re fortunate enough to help 50,000 developers analyze about 700BN lines of code every weekday. As we’ve grown, we’ve seen that clear, actionable static analysis leads to healthier code and happier developers. Our new platform brings those benefits to every team, regardless of the technologies they use, so that they can focus on shipping quality software.
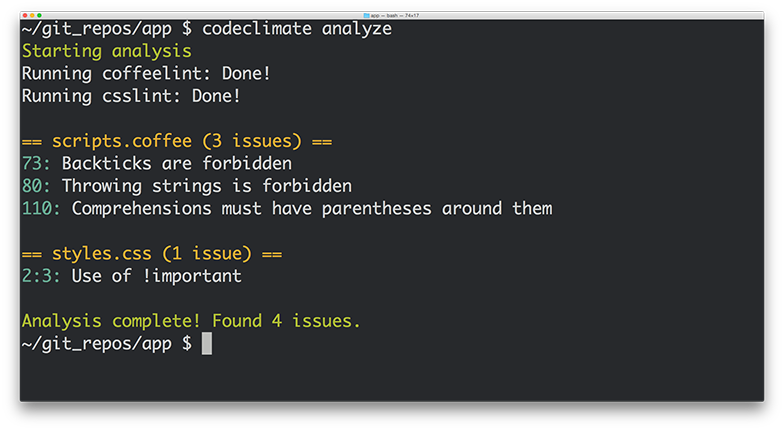
What does this mean exactly? First, we’re open sourcing our analysis tools, including the engines and algorithms we use to evaluate code. If you have a running Docker host, using Code Climate on your command line is as easy as:
boot2docker up && `boot2docker shellinit` brew tap codeclimate/formulae brew install codeclimate
We’re also enabling anyone to write static analysis engines that run on our servers by following a simple specification. No longer will you have to wait for us to provide support for your programming languages, frameworks and libraries of choice. Finally, using our new Code Climate CLI, you can now run any Code Climate-compatible static analysis on your laptop – for free.
Let’s look at each of these in turn…
Open Source
We’re releasing the static analysis engines that power the new Code Climate Quality Platform, and going forward, all of our static analysis code will be published under Open Source licenses. Code Climate has always provided free analysis to Open Source projects, and this continues to deepen our commitment to, and participation in, the OSS community.
Code Climate has always stood on the shoulders of giants in depending on Open Source libraries for the bulk of our static analysis algorithms. We would not exist today if not for the great work of people like Ryan Davis (Flog, Flay) and Justin Collins (Brakeman) that demonstrated the value of static analysis and allowed us to quickly bring it to developers.
Open Source static analysis means you can dig in and understand exactly how your code is being evaluated. And customizing static analysis algorithms becomes as simple as clicking the “Fork” button on GitHub…
Extensible
With the release of our new Code Climate Engine Specification, anyone can write static analysis engines that run on our servers. Code Climate’s set of officially supported languages can be augmented with community supported static analysis engines so that you can get confidence in your code, regardless of your choice of technology. For years, our most common type of feature request has been, “Can you add support for X?”, where X is a programming language, version of a language, or sometimes a framework. We’ve always wanted Code Climate to work for all developers, but in the past we were limited by the effort required to add new languages.
We believe that you shouldn’t have to wait for a vendor to add support for the languages you love, so are finally removing ourselves as the bottleneck to new static analysis features. Anyone who is interested in using Code Climate with their favorite languages, frameworks and libraries is free to build an engine to do so. Results from engines retain all the benefits of the Code Climate product, including automatic analysis of every Pull Request, comparison views, ratings/GPAs, and notifications. Of course, there’s already a vibrant community of OSS static analysis tools, and we’re excited to see what people are able to build and integrate. It’s really astounding how simple it is to build a Code Climate engine, as we’ve watched developers build functioning analysis from scratch in a matter of a couple hours.
If you want to give it a try, join our new Developer Program and we’ll be there to guide you along the way.
Run Anywhere
In addition to the spec, we’re also releasing the Code Climate CLI, which makes it easy to get static analysis results (both from Code Climate’s official engines and community-supported engines) in one clear, unified report right on your laptop. When you’re ready, you can load your repository into codeclimate.com and we’ll automatically apply the exact same configuration you use locally to analyze every commit and Pull Request, making the results available to your entire team.
To make static analysis truly ubiquitous, we realized it was not enough to support a wide variety of tools, we need to make it trivial to run these tools anywhere the developer is working. You shouldn’t have to wait to push your source code to a remote server to get clear, actionable static analysis results. Now it’s possible to easily run the same static analysis we run on our servers on your command line.
New Static Analysis Engines
We’re fortunate to be partnering with creators of two prominent Open Source projects who understand the value of static analysis in ensuring healthy code, Tom Dale from Ember.js and Laurent Sansonetti from RubyMotion. Here’s what they have to say about the Code Climate Quality Platform:
“The Ember community takes good tooling seriously. I’m excited to partner with Code Climate and bring their service to our users because better static analysis means better Ember apps.”
– Tom Dale from Ember.js
“HipByte is excited to partner with CodeClimate to provide clear and reliable code reviews for RubyMotion projects. RubyMotion allows Ruby developers to write cross-platform apps for iOS and Android by leveraging the native platform APIs, and a tool for static analysis means fewer crashes and more reliable applications.”
– Laurent Sansonetti from RubyMotion
Accordingly, we’re releasing an Ember.js engine that brings the Ember Watson tool to all Code Climate users, and a set of custom checks for RubyMotion that will help ensure that your application code is reliable.
In addition, we’re proud to release eight new static analysis engines that you can start using with Code Climate today:
- Gofmt, Govet and Golint – The official style, bug and lint checkers from the Go team
- CoffeeLint – Style checking for the CoffeeScript dialect of JavaScript
- CSSLint – Style checking for all CSS stylesheets
- Rubocop – Style and quality checks for Ruby code (including support for RRuby 2.2+)
- ESLint – Linting and style checking for your modern EcmaScript/JavaScript code
- Bundler Audit – Find security vulnerabilities in your Ruby dependencies
- PHP CodeSniffer – Style checking for PHP
Healthy Code Ships Faster
In many ways, our new platform is a culmination of the experience we’ve gained over the past four years building and operating the most popular static analysis app. We’re excited to bring this to you, and look forward to continuing to bring you the best tools to ship better code, faster. If you want to try out the new Code Climate, download our CLI to get started.

In exciting programming language news (how often do you get to say that?) Apple recently released Swift, a compiled language meant to augment Objective-C for development on Desktop and Mobile iOS platforms. While Swift’s primary audience at this (very early) point is iOS developers, the language contains some interesting functionality for program design that will appeal to a wider audience, including Ruby, JavaScript, and PHP developers.
In this post I’ll take a look at three of the program design constructs that Swift provides: Classes, Structures, and Protocols. I’ll discuss how they can contribute to well-designed Object-Oriented (OO) programs in a way that might be interesting to dynamic language programmers, and show how aspects of their design reflect concerns of the platform for which they were developed.

Classes and Structures
The best source of information about Swift so far is The Swift Programming Language, a free e-book provided by Apple. It contains a first pass introduction to the language, a language reference, and a good deal of example code. After introducing the basic facilities of the language – its philosophy, the basic available types and data structures, control flow, closures, and so on – we get to the section on Classes and Structures.
“Classes and structures are general-purpose, flexible constructs that become the building blocks of your program’s code.” [1]
This sounds similar to the functionality of a Class or Module in Ruby. From this list of the features of Classes and Structures, we see even more similarities. Classes and Structures can both:
- Define properties to store values
- Define methods to provide functionality
- Define initializers to set up their initial state
- Be extended to expand their functionality beyond a default implementation
This means that Swift provides similar functionality to familiar OO Programming Languages. We can model problems using objects which can encapsulate data and functionality, and build complex relationships between these objects in a modular fashion. Curious readers might have the same reaction to this as I did – if it’s the case that both classes and structures can do the above, which is a reasonable set of functionality to expect from classes, why are there two constructs? What are the differences between them, and why does Swift as a programming language need both?
First, let’s take a look at what Classes can do that Structures cannot. Classes provide functionality for two crucial pieces of OO functionality that Ruby developers, for instance, tend to rely on somewhat heavily:
- Inheritance, where one class can inherit the characteristics of another
- Type casting, where you can check and interpret the type of a class instance at runtime
Additionally, classes provide the following facilities which are stated in terms familiar to those with experience managing resources and memory manually:
- Deinitializers, to enable an instance of a class to free up any resources it has assigned
- Reference counting, to allow for more than one reference to a class instance
Stated in other terms, inheritance, type casting, deinitializers, and reference counting make it possible to expressively create designs which employ the full compliment of OO techniques.
From my perspective, Classes and Structures have just the right amount of overlap in functionality, leaving enough room for developers to make reasoned decisions about which construct to employ according to the purpose it may be used for. The differences hinge on how instances of Classes and Structures are represented in memory after they are initialized – structure instances are always passed by value and class instances are always passed by reference. This distinction is something that dynamic language developers typically do not have to spend much time thinking about – on a mobile platform, however, this kind of thinking becomes very important.
Different memory semantics is not the only advantage of having these distinct types, however. Because structures are simpler than classes, and cannot be as heavily modified after declaration, they provide an opportunity to create value objects which represent pieces of data independent from their behavior. This is very useful.
While Classes and Structures cover much of the familiar ground with respect to OO functionality in Ruby or Python, there is one more construct that might not be so familiar that I’d like to point out before we draw any conclusions on Swift’s OO design capabilities.
Protocols
Protocols are an interesting addition to the already rich world of classes and structures. They provide a way to define behavior separately from the classes which implement them:
“A protocol defines a blueprint of methods, properties, and other requirements that suit a particular task or piece of functionality”
Similar constructs exist in Java, Go, and other languages, but many dynamic languages do not embrace this design style. Protocols embrace flexible design by encapsulating the necessary data and behavior for a domain idea outside the scope of a Class or Structure definition. This means that a concept can be represented separately from its implementation, allowing for more creative reuse, composition, and more.
To illustrate the usefulness of Protocols, consider the development of a small networked process to record some information from a system over time. You might want to have the system write to a Key-Value store, or to disk, or to STDOUT, depending on a variety of circumstances. In this case, you would simply define a Protocol:
protocol BackEnd { func get(Int) -> Int func set(Int) -> Bool }
This protocol requires that anything which implements them must contain at least two instance methods – get, which accepts an Integer and returns an Integer, and set, which accepts an Integer and returns a Boolean value. A class that implements this Protocol might look something like the following:
class RedisBackEnd : BackEnd { func get(id: Int) -> Int { // Get 'val' from Redis based on 'id' let val = getFromRedis(id) return val } func set(val: Int) -> Bool { // Store 'val' in Redis here let boolFromRedis = storeInRedis(val) return boolFromRedis } }
You could imagine similar classes for the other backends I mentioned above. This is a very convenient solution for swapping out backends when you need to run your process in different locations and under different circumstances – simply implement new ones as needed, and pass them in wherever a Backend is needed.
Defining a Protocol and implementing it is really the tip of the iceberg, however – things can get very subtle and complex. Protocols can be treated as types, and intricate hierarchies can be created with them. While it is interesting to look through the Swift book to see these examples, I don’t believe they are the real selling points of protocols. Used simply and in combination with classes and structures, protocols provide a missing piece of the design puzzle that often vexes programmers in dynamic languages.
Conclusion
Swift is a very interesting programming language that at first blush appears to have all of the necessary components to build expressive OO programs. In addition to classes, structures, and protocols, Ruby developers might also want to look into Extensions which offer mixin-like capabilities.
Whether you prefer inheritance, composition, or even a more esoteric SmallTalk style flavor of OO, it seems that Swift will be able to support you.
Works Cited
[1] Apple Inc. “The Swift Programming Language.” iBooks.

Service-Oriented Architecture has a well-deserved reputation amongst Ruby and Rails developers as a solid approach to easing painful growth by extracting concerns from large applications. These new, smaller services typically still use Rails or Sinatra, and use JSON to communicate over HTTP. Though JSON has many obvious advantages as a data interchange format – it is human readable, well understood, and typically performs well – it also has its issues.
Where browsers and JavaScript are not consuming the data directly – particularly in the case of internal services – it’s my opinion that structured formats, such as Google’s Protocol Buffers, are a better choice than JSON for encoding data. If you’ve never seen Protocol Buffers before, you can check out some more information here, but don’t worry – I’ll give you a brief introduction to using them in Ruby before listing the reasons why you should consider choosing Protocol Buffers over JSON for your next service.

A Brief Introduction to Protocol Buffers
First of all, what are Protocol Buffers? The docs say:
“Protocol Buffers are a way of encoding structured data in an efficient yet extensible format.”
Google developed Protocol Buffers for use in their internal services. It is a binary encoding format that allows you to specify a schema for your data using a specification language, like so:
message Person { required int32 id = 1; required string name = 2; optional string email = 3; }
You can package messages within namespaces or declare them at the top level as above. The snippet defines the schema for a Person data type that has three fields: id, name, and email. In addition to naming a field, you can provide a type that will determine how the data is encoded and sent over the wire – above we see an int32 type and a string type. Keywords for validation and structure are also provided (required and optional above), and fields are numbered, which aids in backward compatibility, which I’ll cover in more detail below.
The Protocol Buffers specification is implemented in various languages: Java, C, Go, etc. are all supported, and most modern languages have an implementation if you look around. Ruby is no exception and there are a few different Gems that can be used to encode and decode data using Protocol Buffers. What this means is that one spec can be used to transfer data between systems regardless of their implementation language.
For example, installing the ruby-protocol-buffers Ruby Gem installs a binary called ruby-protoc that can be used in combination with the main Protocol Buffers library (brew install protobuf on OSX) to automatically generate stub class files that are used to encode and decode your data for you. Running the binary against the proto file above yields the following Ruby class:
#!/usr/bin/env ruby # Generated by the protocol buffer compiler. DO NOT EDIT! require 'protocol_buffers' # forward declarations class Person < ::ProtocolBuffers::Message; end class Person < ::ProtocolBuffers::Message set_fully_qualified_name "Person" required :int32, :id, 1 required :string, :name, 2 optional :string, :email, 3 end
As you can see, by providing a schema, we now automatically get a class that can be used to encode and decode messages into Protocol Buffer format (inspect the code of the ProtocolBuffers::Message base class in the Gem for more details). Now that we’ve seen a bit of an overview, let’s dive in to the specifics a bit more as I try to convince you to consider taking a look at Protocol Buffers – here are five reasons to start.
Reason #1: Schemas Are Awesome
There is a certain painful irony to the fact that we carefully craft our data models inside our databases, maintain layers of code to keep these data models in check, and then allow all of that forethought to fly out the window when we want to send that data over the wire to another service. All too often we rely on inconsistent code at the boundaries between our systems that don’t enforce the structural components of our data that are so important. Encoding the semantics of your business objects once, in proto format, is enough to help ensure that the signal doesn’t get lost between applications, and that the boundaries you create enforce your business rules.
Reason #2: Backward Compatibility For Free
Numbered fields in proto definitions obviate the need for version checks which is one of the explicitly stated motivations for the design and implementation of Protocol Buffers. As the developer documentation states, the protocol was designed in part to avoid “ugly code” like this for checking protocol versions:
if (version == 3) { ... } else if (version > 4) { if (version == 5) { ... } ... }
With numbered fields, you never have to change the behavior of code going forward to maintain backward compatibility with older versions. As the documentation states, once Protocol Buffers were introduced:
“New fields could be easily introduced, and intermediate servers that didn’t need to inspect the data could simply parse it and pass through the data without needing to know about all the fields.”
Having deployed multiple JSON services that have suffered from problems relating to evolving schemas and backward compatibility, I am now a big believer in how numbered fields can prevent errors and make rolling out new features and services simpler.
Reason #3: Less Boilerplate Code
In addition to explicit version checks and the lack of backward compatibility, JSON endpoints in HTTP-based services typically rely on hand-written ad-hoc boilerplate code to handle the encoding and decoding of Ruby objects to and from JSON. Parser and Presenter classes often contain hidden business logic and expose the fragile nature of hand parsing each new data type when a stub class as generated by Protocol Buffers (that you generally never have to touch) can provide much of the same functionality without all of the headaches. As your schema evolves so too will your proto generated classes (once you regenerate them, admittedly), leaving more room for you to focus on the challenges of keeping your application going and building your product.
Reason #4: Validations and Extensibility
The required, optional, and repeated keywords in Protocol Buffers definitions are extremely powerful. They allow you to encode, at the schema level, the shape of your data structure, and the implementation details of how classes work in each language are handled for you. The Ruby protocol_buffers library will raise exceptions, for example, if you try to encode an object instance which does not have the required fields filled in. You can also always change a field from being required to being optional or vice-versa by simply rolling to a new numbered field for that value. Having this kind of flexibility encoded into the semantics of the serialization format is incredibly powerful.
Since you can also embed proto definitions inside others, you can also have generic Request and Response structures which allow for the transport of other data structures over the wire, creating an opportunity for truly flexible and safe data transfer between services. Database systems like Riak use protocol buffers to great effect – I recommend checking out their interface for some inspiration.
Reason #5: Easy Language Interoperability
Because Protocol Buffers are implemented in a variety of languages, they make interoperability between polyglot applications in your architecture that much simpler. If you’re introducing a new service with one in Java or Go, or even communicating with a backend written in Node, or Clojure, or Scala, you simply have to hand the proto file to the code generator written in the target language and you have some nice guarantees about the safety and interoperability between those architectures. The finer points of platform specific data types should be handled for you in the target language implementation, and you can get back to focusing on the hard parts of your problem instead of matching up fields and data types in your ad hoc JSON encoding and decoding schemes.
When Is JSON A Better Fit?
There do remain times when JSON is a better fit than something like Protocol Buffers, including situations where:
- You need or want data to be human readable
- Data from the service is directly consumed by a web browser
- Your server side application is written in JavaScript
- You aren’t prepared to tie the data model to a schema
- You don’t have the bandwidth to add another tool to your arsenal
- The operational burden of running a different kind of network service is too great
And probably lots more. In the end, as always, it’s very important to keep tradeoffs in mind and blindly choosing one technology over another won’t get you anywhere.
Conclusion
Protocol Buffers offer several compelling advantages over JSON for sending data over the wire between internal services. While not a wholesale replacement for JSON, especially for services which are directly consumed by a web browser, Protocol Buffers offers very real advantages not only in the ways outlined above, but also typically in terms of speed of encoding and decoding, size of the data on the wire, and more.