README.md
# plotvuer
[](https://badge.fury.io/js/%40abi-software%2Fplotvuer)
[](https://codeclimate.com/github/Tehsurfer/plotvuer/maintainability)
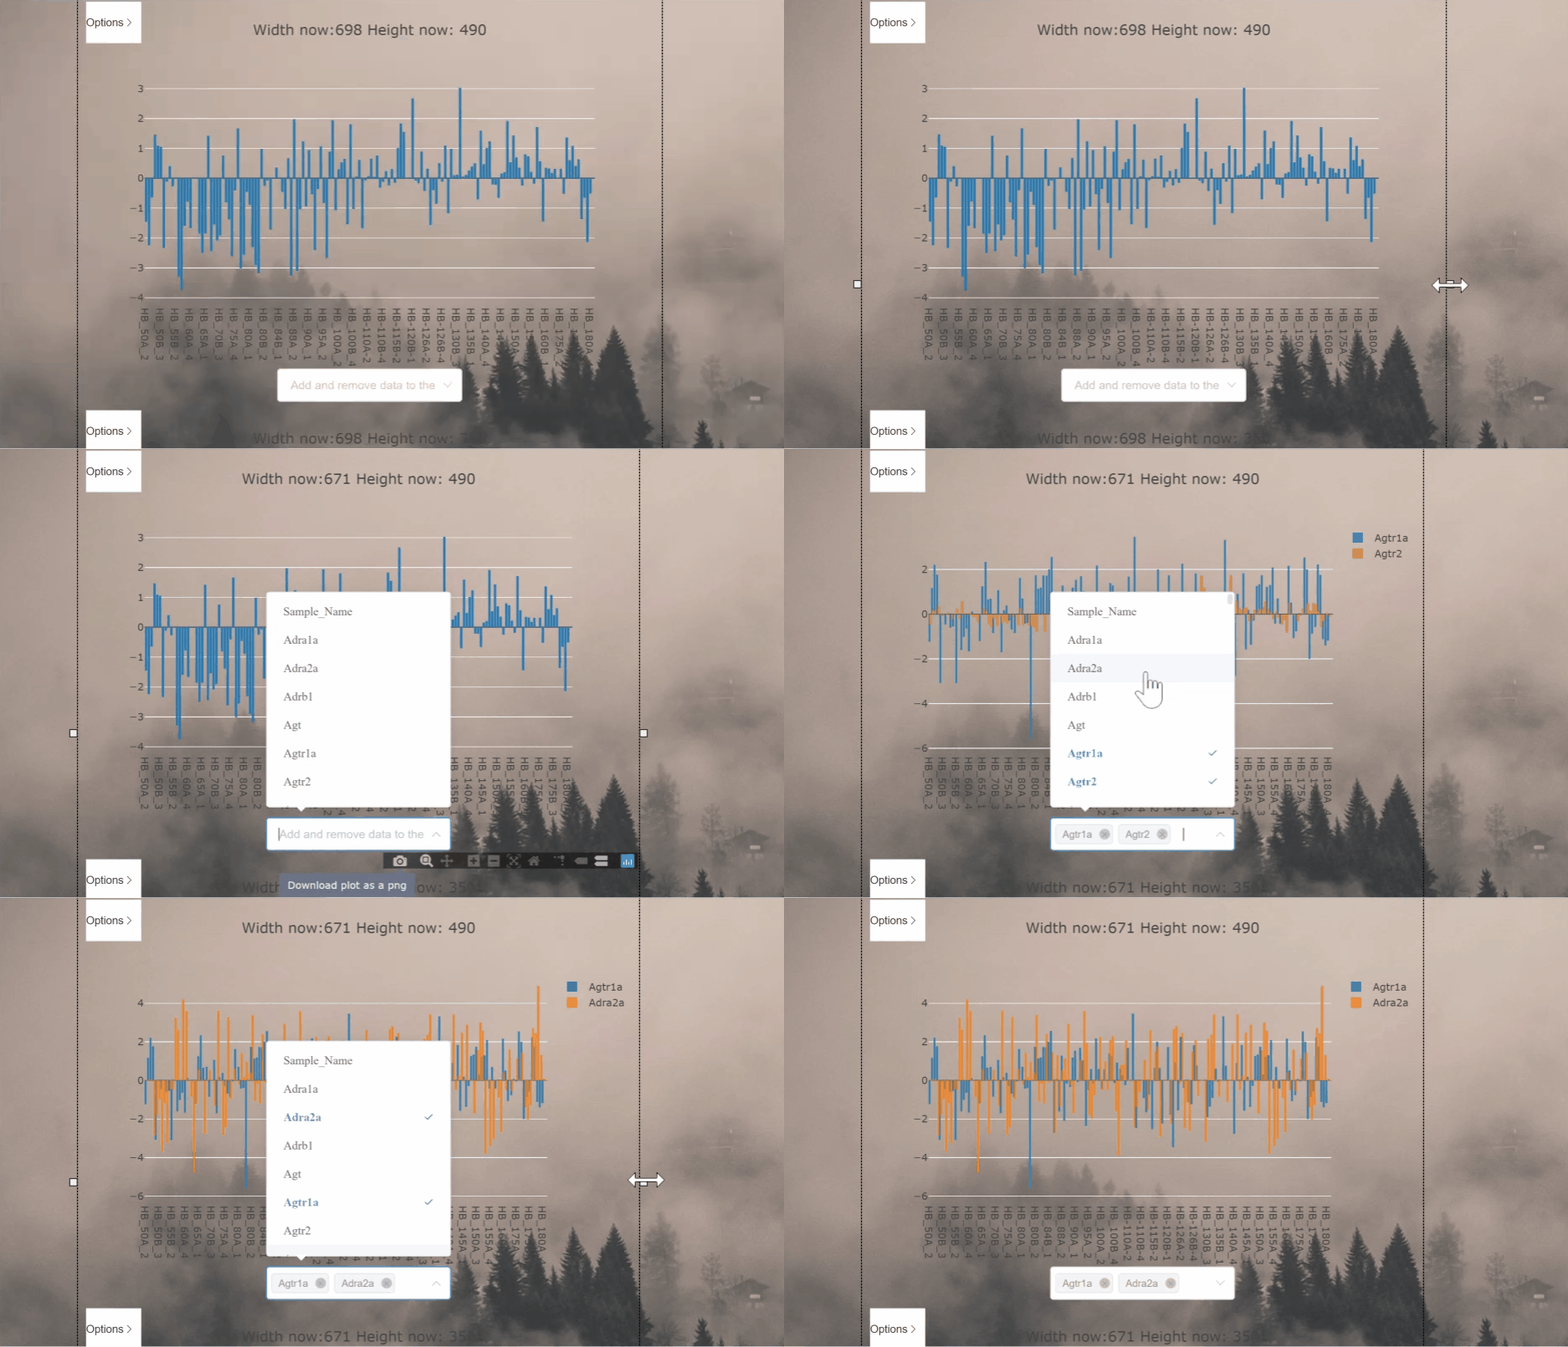
This project aims to process and display csv files as graphs in the vue framework
Demo the site functionality of this app [here](https://plotvuer-demo.herokuapp.com/)*.
*_Demo will take 30s to load while Heroku server boots_

**Don't feel like coding? See how to copy and paste plotvuer as an HTML widget [here](https://github.com/ABI-Software/plotvuer/blob/master/README.md#copy-and-paste-as-an-html-widget)**
## Project installation
```
npm i @abi-software/plotvuer
```
## Project setup
```
npm install
npm run serve
```
### Compiles and minifies for production
```
npm run build-bundle
```
## How to use
Include the package in your script.
```javascript
import { PlotVuer } from '@abi-software/plotvuer'
import '@abi-software/plotvuer/dist/plotvuer.css'
```
Local registration in vue component:
```javascript
export default {
...
components: {
PlotVuer,
}
...
}
```
The snippet above registers the Plotvuer component into the global scope.
You can now use the Plotvuer in your vue template as followed:
```html
<PlotVuer :url="csvfile.csv"></PlotVuer>
```
_Optional Parameters_:
1. Type of plot - Use 'scatter, 'heatmap', or 'barplot'.
2. Plot filters - Filters will preload the plot with the supplied data
```html
<PlotVuer :url="csvfile.csv" :plotType="'scatter'" :xAxisFilter="['step1', 'step2']"></PlotVuer>
```
`url` should be the variable/string containing the url of a csv file.
`plotType` is the type of plot we wish to see the data as one of: `'heatmap', 'scatter', 'barplot'`
`xAxisFilter` and `yAxisFilter` provide filters to load the plot with selected filters displayed.
## CSV file formatting
`plotvuer` will load and csv file that follow the form of headers on first row and coloumn and if data is time based, rows will be assumed to be time dependant.
### Example 1. Heatmap data
| | Gene 1 | Gene 2 |
| :------------ |:--------| ------|
| Sample 1 | -1.54 | -3.40 |
| Sample 2 | 0.68 | 1.22 |
| Sample 3 | 0.05 | 0.66 |
### Example 2. Timeseries data
| time (seconds)| Sweep 0_Membrane Potential (mV) |
| :------------ |:--------|
| 0 | -70.12939453 |
| 0.0002 | -70.12939453 |
| 0.0004 | -70.34301758 |
## Copy and paste as an HTML widget
Paste the following lines in the `<body>` of you HTML
```HTML
<!-- Modify the 'file' input to point to a csv file you wish to show -->
<plot-vuer-widget file="https://mapcore-bucket1.s3-us-west-2.amazonaws.com/ISAN/csv-data/use-case-4/RNA_Seq.csv"></plot-vuer-widget>
<!-- widget source css from cdn-->
<link href="https://cdn.jsdelivr.net/npm/@tehsurfer/plotvuer-widget/dist/plotVuer.css" rel="stylesheet">
<!-- widget source js from cdn -->
<script src="https://cdn.jsdelivr.net/npm/@tehsurfer/plotvuer-widget/dist/plotVuer.js"></script>
```
### Modifying input file for widget
Change this line to point at a csv file for display
```HTML
<!-- Modify the 'file' input to point to a csv file you wish to show -->
<plot-vuer-widget file="./path/to/file.csv"></plot-vuer-widget>
```