docs/README.md
# PM2 APM Architecture
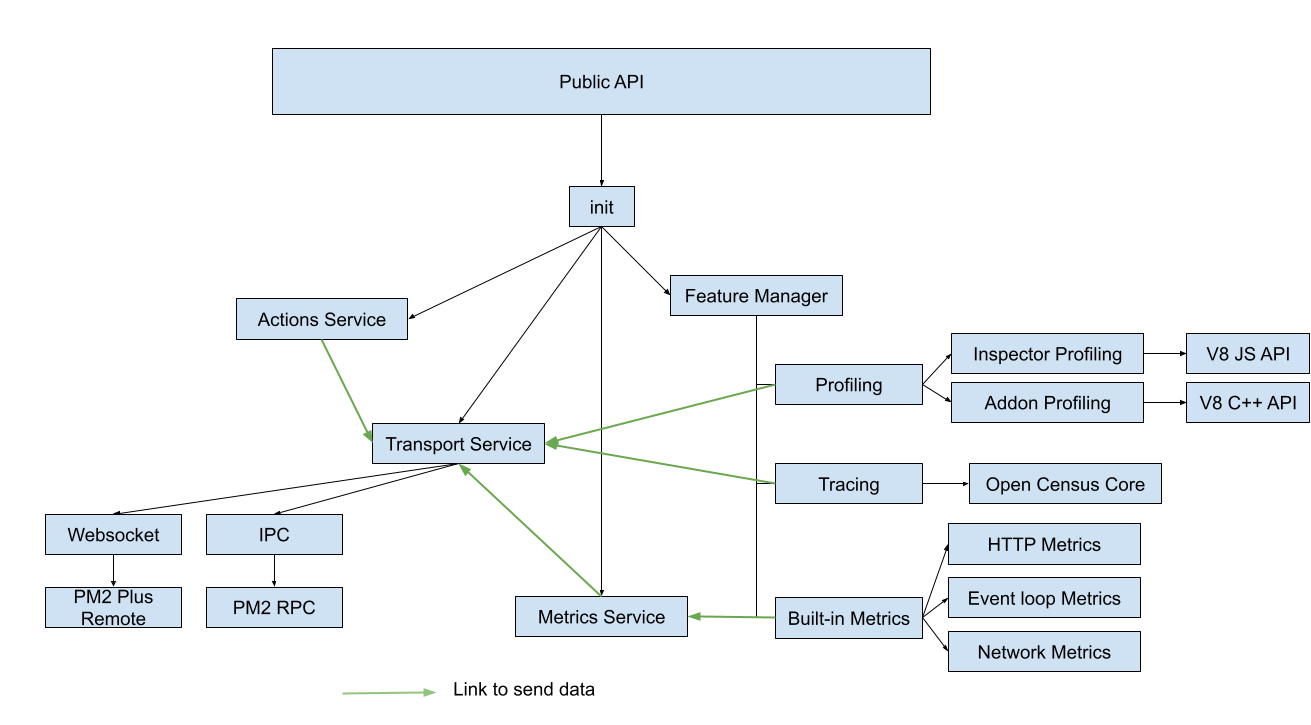
The APM has been architected for a maximum composability when developing different features, each component have exactly one job and they have access to different low level API (like sendin/receiving data) to be able to do it.
Here a simple (not exact) architecture diagram:
## Concept
### Manager
There are two "Manager" in the implementation:
- The Service Manager which statically store reference to all services so they are available by other component.
- The Feature Manager which handle the configuration and instanciation of each feature.
### Service
A service is an internal component designed to group a speficic logic and provide a simple API to do that logic.
They should not be accessible to user to allow us to change the low level API without breaking anything.
### Feature
Exaclty as it sound, a feature is a component that actually do something, for example:
- The tracing feature handle all the tracing infrastructure from the init to sending all trace data.
- The notify metrics provide an API to send error to the remote infrastructure
Each feature expose different methods and there are not exposed by default to the user.
### Public API
By public API we mean all the functions that a user can call when instanciating the APM.
Each function that need to be exposed is added into the main instance and then use the feature manager to call the actual method implmentation.
This design help maintaining backward compatibility at the user level and not in the logic implementation.
## Services
### Transport
The most important service is the Transport service which offer an interface to implement different type of transport. It also provide an API to create a transport instance.
##### IPC Transport
This is the default transport and it's based on IPC, a shared file descriptor used to transfer data to and from the PM2 daemon.
Every data is sent as specific packet to the PM2 RPC system that will then broadcast them to the agent.
See the agent: https://github.com/keymetrics/pm2-io-agent
##### Websocket Transport
The websocket transport is the new transporter used when we don't use the PM2 daemon and his agent to send data.
It use this agent: https://github.com/keymetrics/pm2-io-agent-node to handle the low level networking to our servers.
### Metrics
The metrics service expose method to register metrics that will be sent to the remote endpoint, it then handle:
- Fetching the value of the metrics every second, and sending them formatted to the transport service
### Actions
The action service, as the metric service, expose an API to register custom action. It handle the listening to the remote connection for new action request, call the actual user function and then send back the user data.
### Inspector
This service doesn't do much apart from offering a `inspector` session to every feature that need it. From Node 8 to node 10, there could be only one session in the whole process so this service is made to avoid having two session opened by different features.
### RuntimeStats
This service is simply a wrapper to the `@pm2/node-runtime-stats` module that allows to get low level metrics about the node runtime.
Since multiple metrics are using it, we made a service out of it so we only have one instance of it.
## Features
### Notify
The `notify` provides 3 API:
- `notifyError` to send custom error to the remote server
- `expressErrorHandler` which is a express middleware that catch error and send them
- `koaErrorHandler` same as express middleware but for koa
It also handle the `unhandledRejection` and `uncaughtException` error event to also send them. In the case of `uncaughtException`, it also `exit` the process.
### Profiling
The profiling feature provide a wrapper on top of two different profilers implementation:
- `inspector` based profiling, which is a built-in API for Node 8 to interact with v8 API
- `addon` based profiling which is seperate c++ addon that need to be installed, it's only here to support Node 6.
Both register customs actions with the `ActionService` to when a user can remotely start and stop profiles in their processes.
### Tracing
The tracing feature handle the `opencensus` agent which is in `src/census`, for more information about how they works, you should read about [Opencensus Node Agent](https://github.com/census-instrumentation/opencensus-node/)
We got our own plugins to be able to iterate faster on them and since the opencensus API isn't stable yet, do not break between minor bump of opencensus.
We implemented our own exporter that use the `TransportService` to send trace data to the remote server.
### Metrics
The Metrics service is implemented as a Manager because it only instanciate different metrics and don't do anything more.
Here the current list of metrics implemented:
- Event loop Metrics: when the `@pm2/node-runtime-stats` addon is there, it use it to get metrics directly from libuv otherwise it fallback on computing it with javascript.
- HTTP Metrics: When the `http` or `https` module is required, add custom listener for request and compute latency/volume for them.
- Network Metrics: Patch the `net.Socket` implementation to count how much bytes are sent/received from/to the network
- Runtime Metrics: Only available when the `@pm2/node-runtime-stats` is there, it add metrics about the V8 GC and Linux Kernel metrics
- V8: Fetch from built-in `v8` module some metrics about heap usage.