docs/observability-centralization-points/logs-centralization-points-with-systemd-journald/active-journal-source-without-encryption.md
# Active journal source without encryption
This page will guide you through creating an active journal source without the use of encryption.
Once you enable an active journal source on a server, `systemd-journal-gatewayd` will expose an REST API on TCP port 19531. This API can be used for querying the logs, exporting the logs, or monitoring new log entries, remotely.
> ⚠️ **IMPORTANT**<br/>
> These instructions will expose your logs to the network, without any encryption or authorization.<br/>
> DO NOT USE THIS ON NON-TRUSTED NETWORKS.
## Configuring an active journal source
On the server you want to expose their logs, install `systemd-journal-gateway`.
```bash
# change this according to your distro
sudo apt-get install systemd-journal-gateway
```
Optionally, if you want to change the port (the default is `19531`), edit `systemd-journal-gatewayd.socket`
```bash
# edit the socket file
sudo systemctl edit systemd-journal-gatewayd.socket
```
and add the following lines into the instructed place, and choose your desired port; save and exit.
```bash
[Socket]
ListenStream=<DESIRED_PORT>
```
Finally, enable it, so that it will start automatically upon receiving a connection:
```bash
# enable systemd-journal-remote
sudo systemctl daemon-reload
sudo systemctl enable --now systemd-journal-gatewayd.socket
```
## Using the active journal source
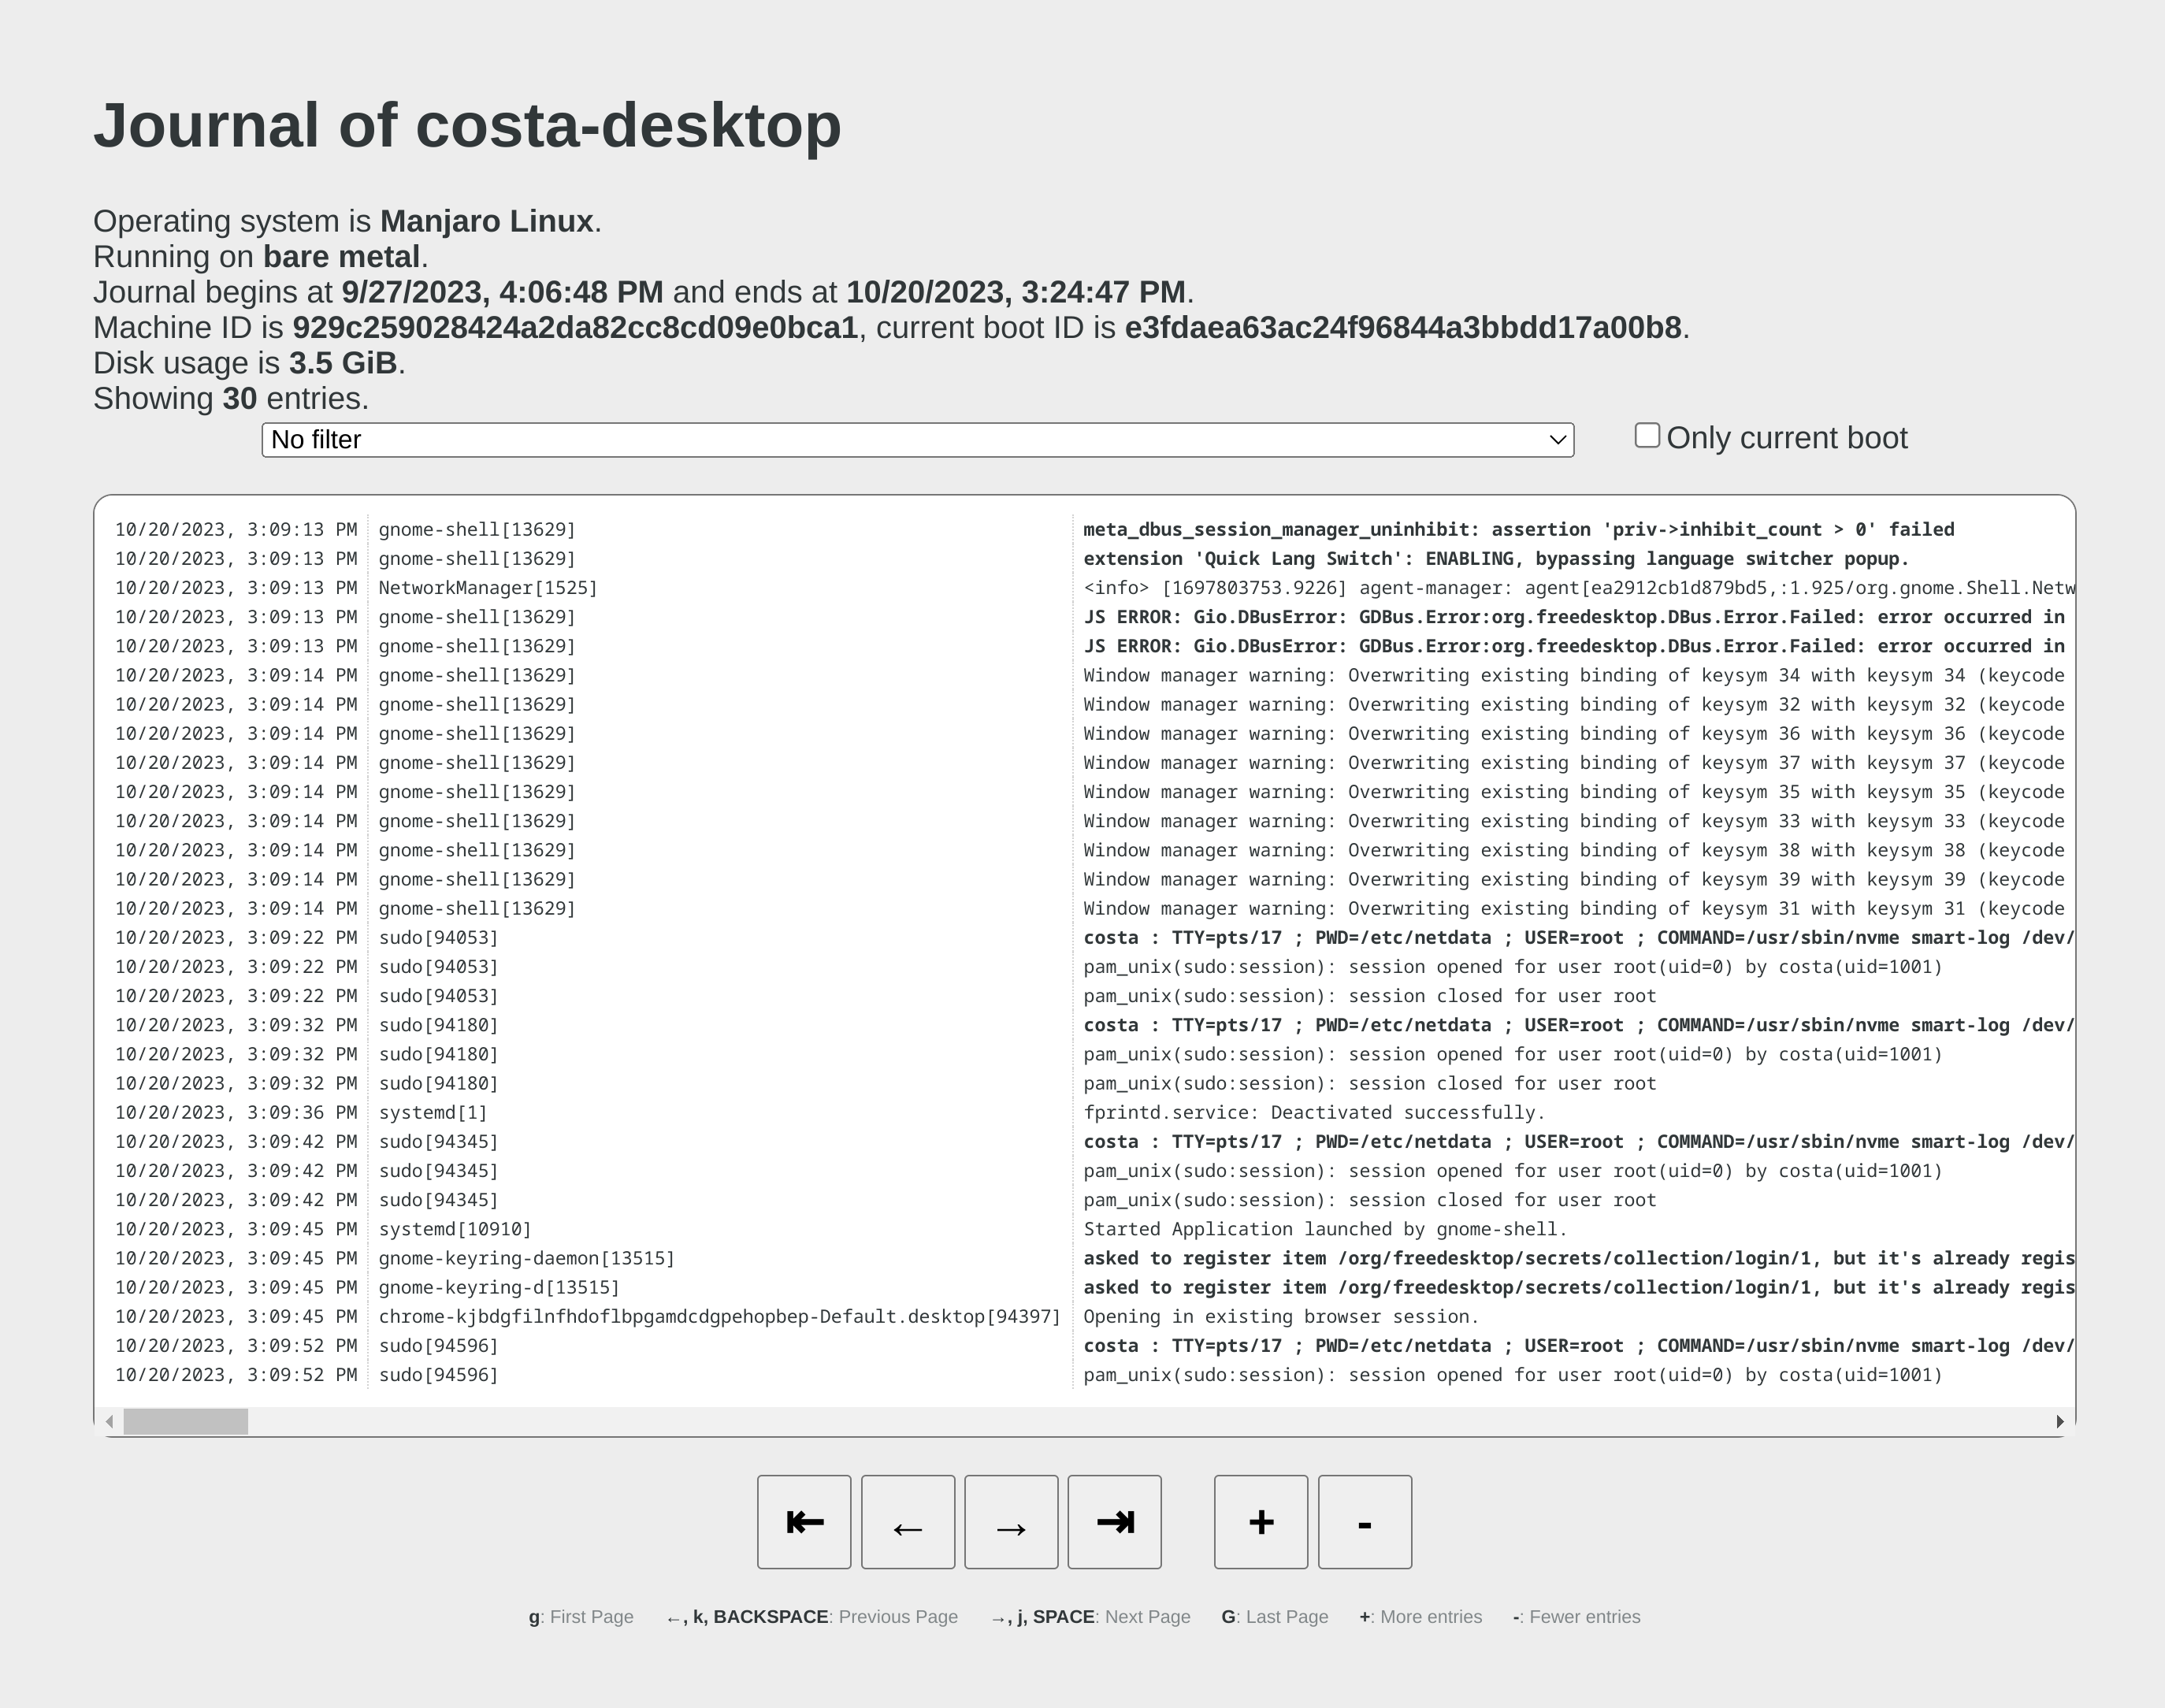
### Simple Logs Explorer
`systemd-journal-gateway` provides a simple HTML5 application to browse the logs.
To use it, open your web browser and navigate to:
```
http://server.ip:19531/browse
```
A simple page like this will be presented:
### Use it with `curl`
`man systemd-journal-gatewayd` documents the supported API methods and provides examples to query the API using `curl` commands.
### Copying the logs to a central journals server
`systemd-journal-remote` has the ability to query instances of `systemd-journal-gatewayd` to fetch their logs, so that the central server fetches the logs, instead of waiting for the individual servers to push their logs to it.
However, this kind of logs centralization has a key problem: **there is no guarantee that there will be no gaps in the logs replicated**. Theoretically, the REST API of `systemd-journal-gatewayd` supports querying past data, and `systemd-journal-remote` could keep track of the state of replication and automatically continue from the point it stopped last time. But it does not. So, currently the best logs centralization option is to use a **passive** centralization, where the clients push their logs to the server.
Given these limitations, if you still want to configure an **active** journals centralization, this is what you need to do:
On the centralization server install `systemd-journal-remote`:
```bash
# change this according to your distro
sudo apt-get install systemd-journal-remote
```
Then, copy `systemd-journal-remote.service` to configure it for querying the active source:
```bash
# replace "clientX" with the name of the active client node
sudo cp /lib/systemd/system/systemd-journal-remote.service /etc/systemd/system/systemd-journal-remote-clientX.service
# edit it to make sure it the ExecStart line is like this:
# ExecStart=/usr/lib/systemd/systemd-journal-remote --url http://clientX:19531/entries?follow
sudo nano /etc/systemd/system/systemd-journal-remote-clientX.service
# reload systemd
sudo systemctl daemon-reload
```
```bash
# enable systemd-journal-remote
sudo systemctl enable --now systemd-journal-remote-clientX.service
```
You can repeat this process to create as many `systemd-journal-remote` services, as the active source you have.
## Verify it works
To verify the central server is receiving logs, run this on the central server:
```bash
sudo ls -l /var/log/journal/remote/
```
You should see new files from the client's hostname or IP.
Also, any of the new service files (`systemctl status systemd-journal-clientX`) should show something like this:
```bash
● systemd-journal-clientX.service - Fetching systemd journal logs from 192.168.2.146
Loaded: loaded (/etc/systemd/system/systemd-journal-clientX.service; enabled; preset: disabled)
Drop-In: /usr/lib/systemd/system/service.d
└─10-timeout-abort.conf
Active: active (running) since Wed 2023-10-18 07:35:52 EEST; 23min ago
Main PID: 77959 (systemd-journal)
Tasks: 2 (limit: 6928)
Memory: 7.7M
CPU: 518ms
CGroup: /system.slice/systemd-journal-clientX.service
├─77959 /usr/lib/systemd/systemd-journal-remote --url "http://192.168.2.146:19531/entries?follow"
└─77962 curl "-HAccept: application/vnd.fdo.journal" --silent --show-error "http://192.168.2.146:19531/entries?follow"
Oct 18 07:35:52 systemd-journal-server systemd[1]: Started systemd-journal-clientX.service - Fetching systemd journal logs from 192.168.2.146.
Oct 18 07:35:52 systemd-journal-server systemd-journal-remote[77959]: Spawning curl http://192.168.2.146:19531/entries?follow...
```