
Code Climate

Code Climate, the enterprise-level Software Engineering Intelligence (SEI) solution, today welcomes Kathleen Rohrecker as Senior Vice President of Marketing.
Rohrecker is a marketing executive with a strong track record of increasing the value of growth-stage technology companies. Prior to joining Code Climate, Rohrecker was Senior Vice President of Marketing at application intelligence and automation provider NS1. Under her leadership, NS1’s brand valuation increased by over $300M. Prior to her tenure at NS1, Rohrecker served as CMO for Maxymizer and Revolution Analytics, positioning those companies for acquisition by Oracle and Microsoft respectively.
“Kathleen has a history of scaling the value, audience, and customer base of every company she works for,” says Bryan Helmkamp, Founder and CEO of Code Climate. “Our Software Engineering Intelligence platform has the power to transform the daily lives of software engineering leaders. We’re fortunate to have a communications leader with Kathleen’s talent and vision to help us tell that story.”
Rohrecker’s data-driven approach to marketing strategy is a natural fit for the data insights startup. As Senior Director of North American Marketing for Oracle, Rohrecker developed a financial model to measure the relative contribution and conversion metrics for all inbound, outbound, and pipeline acceleration marketing programs, supporting nearly 300 sellers. At Revolution Analytics, her go-to-market strategy for big data analytics solutions led to a 500% increase in average contract values in 18 months.
“Throughout my career, I’ve been privileged to help technology companies reach their full market potential, and I’m keenly aware of the power of data-driven insights to accelerate business outcomes,” says Rohrecker. “I look forward to elevating Code Climate among the engineering and business leaders who need it most.”
Rohrecker resides in the greater New York City Area. She holds an MBA from Hofstra University and a Bachelor’s degree in Economics from William & Mary.
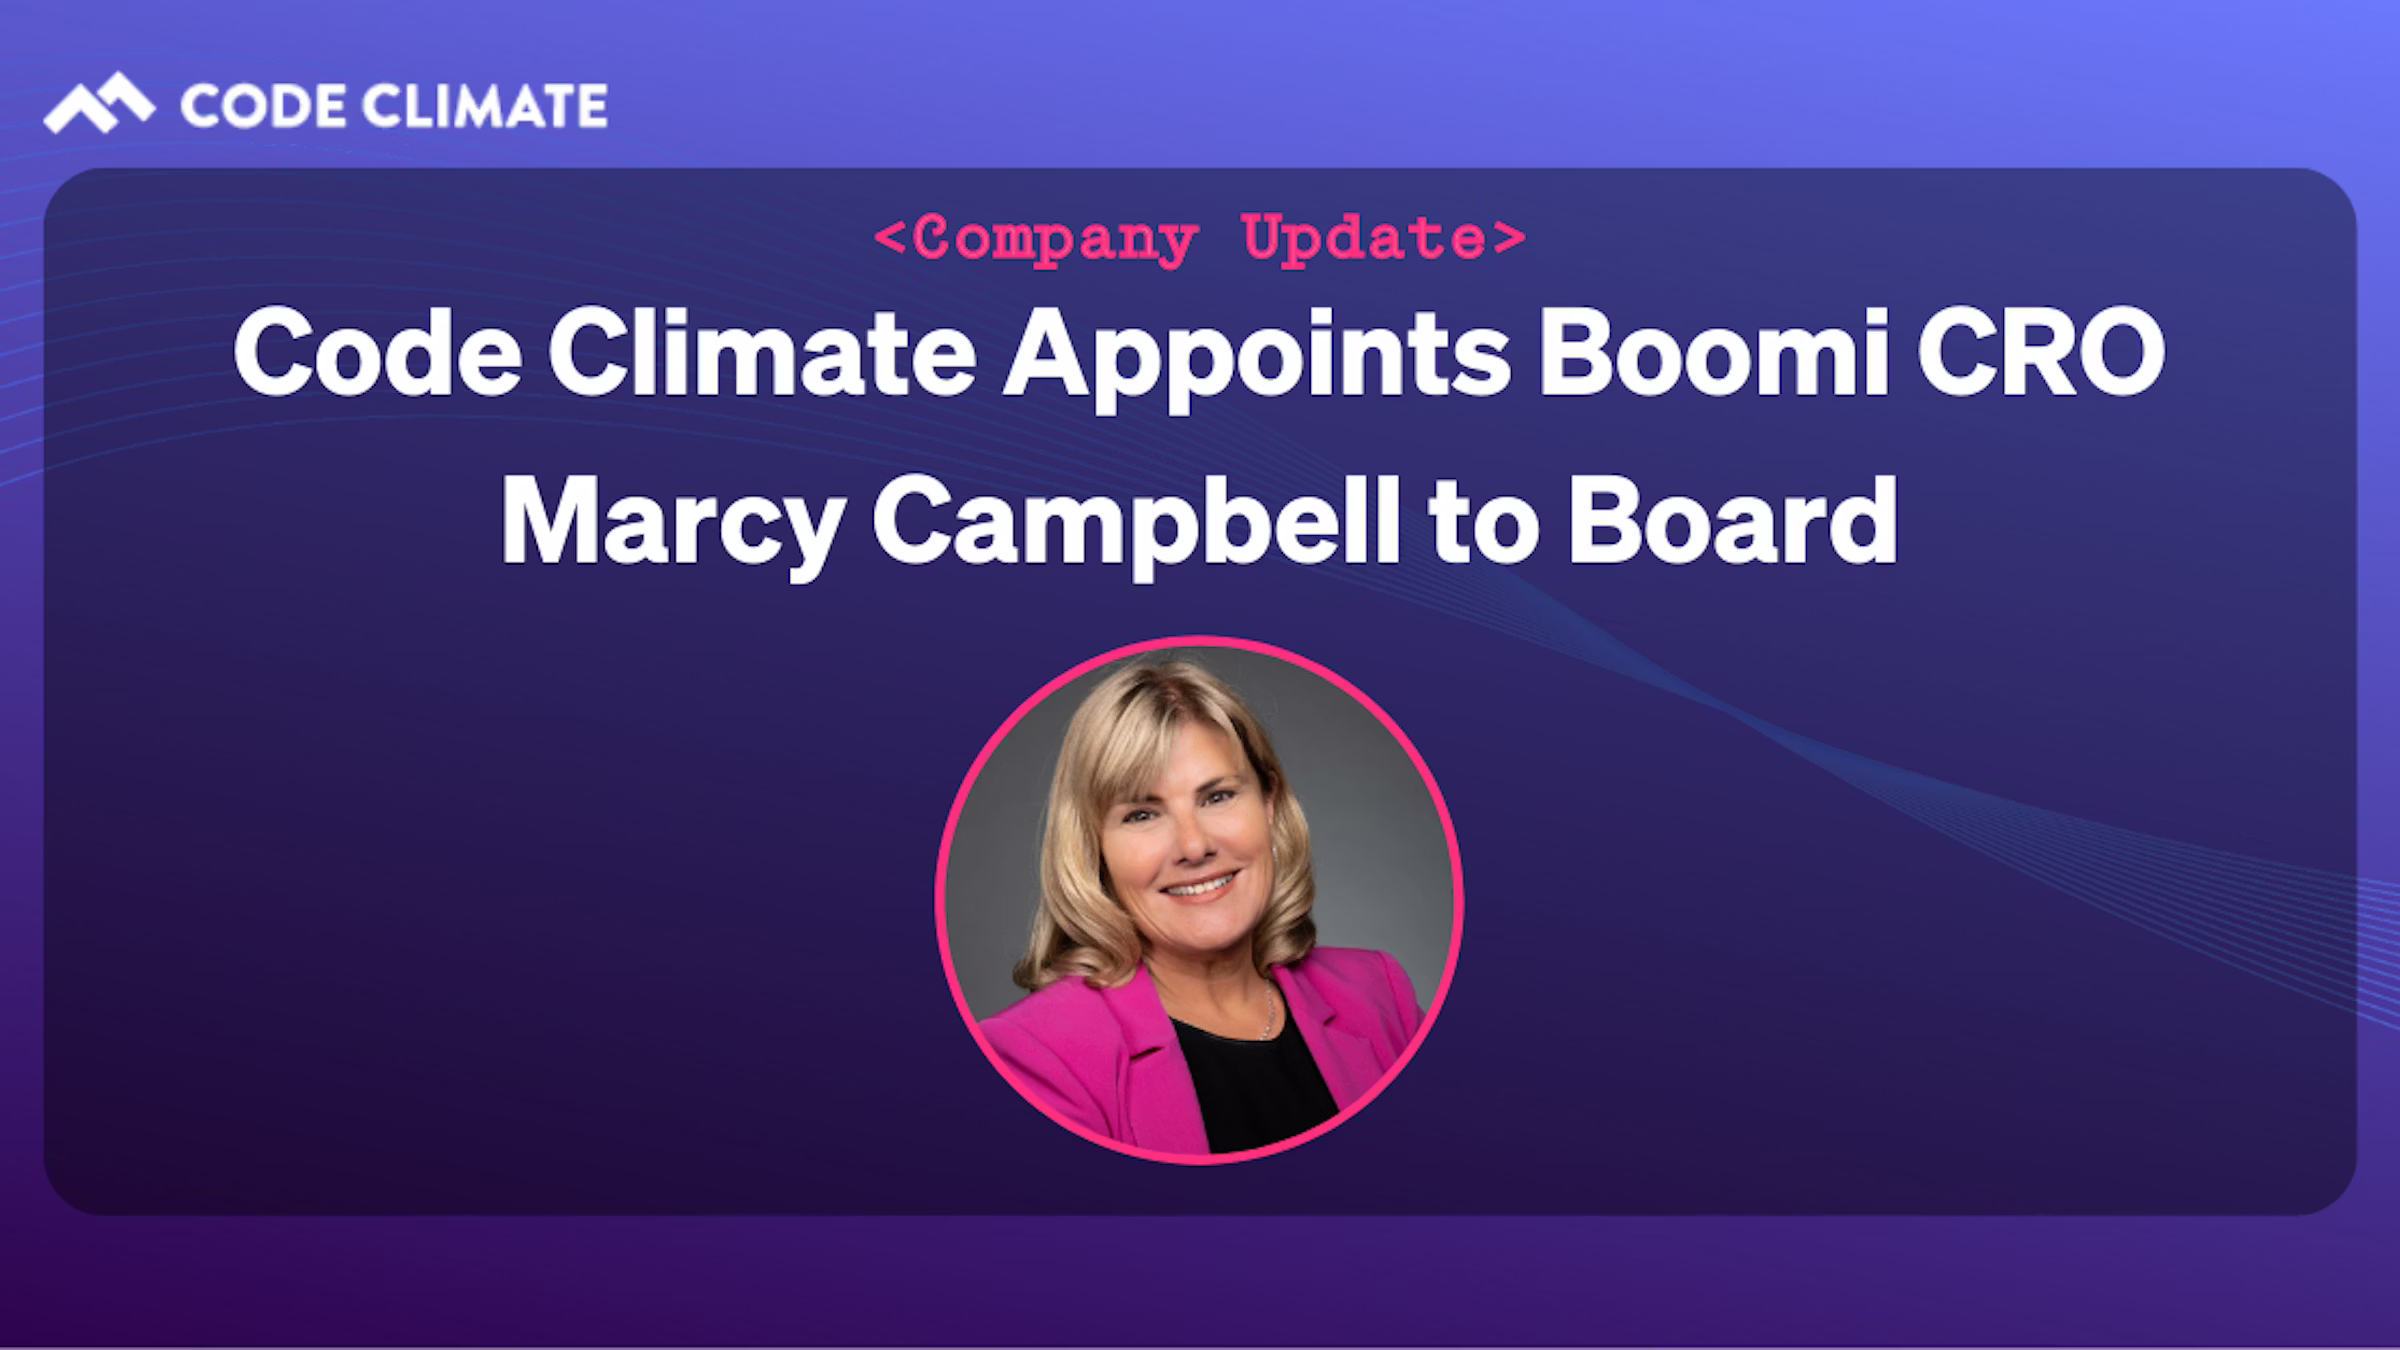
Code Climate, the enterprise-level Software Engineering Intelligence solution, today announces that Marcy Campbell, Chief Revenue Officer for Boomi, has been appointed to the Code Climate Board of Directors.
Campbell brings over 30 years of experience leading large-scale, go-to-market organizations for global companies ranging from Fortune 500 to venture-backed technology firms. Prior to recently joining Boomi, the intelligent connectivity and automation leader, she served as senior vice president at PayPal where she led global sales, professional services, and operations.
“Marcy has an incredible record of helping software providers grow from early startup stages into global operations, and she’s been a strong advocate for data-driven decision-making in organizational leadership,” says Bryan Helmkamp, co-founder and CEO of Code Climate. “Having known Marcy for over 15-years, I’m thrilled to add her expertise in DevOps and go-to-market strategy to our Board of Directors.”
“Having worked with many of the largest companies in the world, as well as cutting-edge brands, I have an experimental nature — I’m attracted to opportunities to work with companies that have a compelling vision and help them massively scale,” says Campbell. “I am honored to join Code Climate’s board and to support their mission of bringing transparency to software engineering.”
As CRO of Boomi, Campbell spearheads the category-leading, global software as a service (SaaS) company’s revenue-generating strategies with a focus on driving fast growth, while continuing to deliver value to its more than 20,000 customers globally. She also serves on the Board of Directors for marketing analytics company NextRoll, a machine learning marketing platform, and on the Board of Advisors for the Asian University for Women, as well as acts as a mentor for the Cherie Blair Foundation.
Campbell has been recognized as a Silicon Valley Business Journal Woman of Influence, a Top 100 Global Sales Leader by The Modern Sale, and as one of the Most Influential Women in Payments by PaymentsSource.com. She resides in the San Francisco Bay area, holds a degree from the University of Hartford, was a National Regent Scholar and most recently a Member of the Board of Regents.
Ensuring that working at Code Climate is a rewarding experience is something we take really seriously, so we’re incredibly honored to be recognized in the Built In 2022 Best Places to Work in NYC Awards. Just announced last week, Code Climate earned a spot on the 50 Best Small Companies to Work for in NYC.
This year’s Best Places to Work Awards highlight employers that have created cultures supporting employees wherever they work. Award eligibility is based on a company’s compensation benefits and culture programs, including diversity, equity, and inclusion.
“This year saw a record number of entrants — and the past two years fundamentally changed what tech professionals want from work,” says Sheridan Orr, Chief Marketing Officer, Built In, in a press release. “These honorees have risen to the challenge, evolving to deliver employee experiences that provide the meaning and purpose today’s tech professionals seek.”
Don’t just take Built In’s word for it though. Here’s what a few of our team members have to say about why they like working at Code Climate.
Emily Fueger, Senior Support Specialist: “Code Climate has done a great job prioritizing active team communication and empathy for what’s happening in the world around us today. I’ve often caught myself saying, ‘Wow, we are so lucky.’ Remote-first policies for meetings and generous leave for testing and time off aren’t just empty words. They reflect our default culture with respect for the people that work here. The culture is incredibly vibrant at Code Climate. The people I work with are incredibly curious, smart, funny, and talented (lots of musicians, DJ’s, and crafters). They’re people that I’d want to know even if I didn’t work with them.”
Josh Bender, SMB Account Executive: “Working at Code Climate is an amazing experience because everyone is working daily to grow the company. We all have a vision of educating the world on Engineering Intelligence and improving the efficiency of software development teams. It’s a rewarding pursuit, and I am excited to see this growth continue!”
Sherianne Bolling, Sr. Corporate Account Executive: “At Code Climate you’re surrounded by colleagues that are both driven and forward-thinking. We have a strong collaborative culture that encourages diversity of thought. I love being able to have my voice heard while contributing to an innovative and fast-moving company.”
Glenn Rothwell, Director of Sales Development: “I love working at Code Climate because of the culture, which I would describe as autonomy with accountability. I have the freedom to experiment and try new things with my team, and I appreciate how data-driven we are when assessing the results. Also, the various departments — such as sales, marketing, and product — work together very closely and are not siloed like I’ve experienced at other companies. Top this off with how genuinely enthusiastic the team is about our product and company direction, and you have a great recipe for success.”
Code Climate has been on a tear the past year, after closing a $50 million Series C round of funding, more than doubling our revenue, and significantly growing our team across the board. In many ways, this is just the start as we continue to aggressively recruit top talent to join our awesome team.
With this team growth as backdrop, our CEO, Bryan Helmkamp, has expressed a deep commitment to investing in the people and culture we need to fuel the next generation of Engineering Intelligence.
Learn more about our company culture, and check out the 30-plus open positions we have today.
We’re introducing a new look for our Velocity navigation! The platform is growing, and we’ve redesigned the navigation to make it even easier to use Velocity to find the answers you’re looking for.
Things look a bit different, but don’t worry, all your favorite reports are still there (plus more!) — they’re just organized in a new way, around what you’re trying to use Velocity for.
Velocity’s all-new navigation now lives at the top of the page, organized into the following three categories:
Align — Create transparency that ensures your technical teams are in sync with product and business initiatives. Here you can find reports aimed at helping executives align on business priorities and ensure optimal resource allocation across teams.
You’ll be able to understand how your team’s productivity changes over time and visualize key metrics to uncover trends.
Deliver — Innovate faster than your competition by bringing new products and features to market, faster. These reports are designed to help engineering leadership deliver high-quality code quickly and consistently.
You can easily see what your team is working on (such as what pull requests have been recently edited) and understand how Code Review and PR Resolution are impacting your team’s delivery time.
Improve — Build a culture of excellence through objective metrics. Here you can find reports designed to help leadership and team managers improve team processes and skills to create a high-performance culture.
You can track how your team is progressing towards their goals and performing over time to help identify the best practices that make sense in your organization.
This is a fresh take on the same insightful Velocity reports you’ve been using. We’ll be rolling this out to all of our users by the end of January. Please reach out to support if you have any questions!
Velocity Navigation is Just the Latest in a String of New Product Features for 2022
The new Velocity navigation is the latest of several new product features. We kicked off 2022 with three other highly-requested features: pair programming support, draft PR support, and updated email and Slack PR links. Read more about these new features in our blog announcement, or here’s a quick summary:
Pair Programming – Those engineering teams, including ours, that use pair programming sessions to help increase efficiency, minimize errors, and engender a culture of collaboration and knowledge-sharing on their teams, can now find co-authorship data included in key metrics and reports.
Draft PRs – Draft PR support allows developers to push their work without unintentionally signaling to a manager that the PR is ready to be formally reviewed and/or shipped. Organizations can now customize when Velocity considers a PR to be Ready for Review.
PR Links – The PR links in Velocity’s e-mail and Slack alerts now route directly to your VCS, rather than Velocity (as they did before). This way, any user with access to the PR — even those without a Velocity seat — can act on e-mail and Slack alerts.
We’ve got a ton of new and exciting features on tap for 2022. Stay tuned for more updates that help maximize the data-driven insights you get from Velocity’s Engineering Intelligence.
On behalf of the Code Climate team — Happy New Year! We’re excited to kick off 2022 by announcing three brand new and highly-requested features:
- Pair programming support
- Draft PR support
- Updated e-mail and Slack PR links
Pair Programming Support
Many engineering teams, including ours, use pair programming sessions to help increase efficiency and minimize errors, all while engendering a culture of collaboration and knowledge-sharing on their teams.
Pairing creates an opportunity for more junior members of the team to ask questions like, “Why do we do this like that?”, or for more senior programmers to describe different implementation approaches they’ve tried and how they’ve worked out in the past. These discussions help close the experience gap and often lead to a new consensus about the preferred way of doing things.
To this end, we’re excited to announce that one of our most highly requested Velocity features — pair programming support — is now live!
What Does Pair Programming Support Look Like in Velocity?
Pair programming support manifests in three main ways in the platform.
First of all, every metric in the application that takes commit activity into account will now reflect pair programming data. For example, if Hermione (author) and Snape (co-author) write 302 lines of code in a pairing session, both of their PR size metrics will reflect this change. Previously, only Hermione’s PR size metric would be affected.
Secondly, co-authorship is now accounted for in the Team and Developer360 Activity tabs. Before, a purple commit bubble would only show up on Hermione’s line (if she was the author) and not on Snape’s (the co-author), even if they had been coding together. Now, the commit bubbles will show up on both axes of activity. It’s important to note that once the PR is opened, however, only the author’s PR metrics will be affected by future changes.
Finally, for all Velocity customers with integrated Jira instances, pair programming data will display in the Workstreams report when users hover over any commit activity that was co-authored (see below).
Note: If you’re an existing Velocity customer who onboarded before November 2020, your rep will reach out within the next few weeks to let you know when this feature is available.
Draft PR Support
Draft PRs make it possible for a developer to push his or her work as soon as possible, without unintentionally signaling to a manager that their work is ready to be formally reviewed and/or shipped.
Ever since GitHub launched this functionality in early 2019, Draft PRs have become an integral part of many engineering organizations’ workflows and a highly-requested Velocity feature.
What Does Draft PR Support Look Like in Velocity?
Organizations can now customize when a PR should be considered Ready for Review. There are three options:
- When a Pull Request Review is first requested
- When a Pull Request is created
- When a Pull Request is no longer marked as a draft
Once you’ve configured what your organization defines as ‘Ready for Review,’ all relevant Velocity metrics (Time to First Review, Review Speed, Time to Merge) will reflect this change.
You can also start the clock for the Waiting for Review risk alert by heading toSettings > Data > PR Risks and selecting your preference from the same dropdown menu.
We hope this new functionality will make it possible for developers to adhere to CI/CD best practices without pinging their teammates prematurely.
Note: Draft PR functionality is only available for GitHub users.
Updated E-mail and Slack PR Links
Finally, we’ve updated the PR link settings in our e-mail and Slack alerts to route directly to your VCS and not to Velocity (as they did before).
This way, any user with access to the PR — even those without a Velocity seat — can act upon e-mail and Slack alerts.
Get Started
Velocity’s come a long way in a year, and we’re looking forward to delivering many more highly-requested features in 2022.
In the meantime, users can configure their Pair Programming and Draft PR Settings at the respective links, and as always, reach out to our support team if you have any questions.
Both Engineering Managers (EMs) and Tech Leads play an integral role in an engineering organization’s health, ensuring that ICs are working together productively and effectively to deliver software on time. With so many moving parts in the development pipeline, it can be hard for an EM to prioritize and determine where they’re needed the most. This challenge is compounded by the fact that data on their team’s progress is spread across disparate sources, and developers may be reluctant to surface issues or ask for help early enough to avoid blockages that derail sprints.
Enter Workstreams, a powerful new enhancement to Velocity that streamlines all the info EMs need to help them prepare for the day ahead.Empowering them to be more proactive leaders and fostering confidence in their strategies through reliable metrics, Workstreams helps EMs quickly assess their team’s progress and identify what items need attention first.
Phase 1: Spot Risks Immediately
Workstreams is an interactive dashboard that uses rich visualizations to help EMs quickly gain visibility into a project’s pipeline, highlighting the most at-risk units of work for easy prioritization. Workstreams answers the following questions:
- What work is at risk?
- Workstreams surfaces code and project risks, allowing EMs to immediately see what areas of work require prompt attention. Details pertaining to each PR are delineated in the Issue column, with each team member assigned their own unique avatar. This visual representation of work distribution makes it easy for an EM to identify which team members are assigned to the Issue and determine whether team members are spread too thin, allowing them to effectively redistribute workload so they can protect against burnout. This also makes it easy for an EM to quickly identify which PR or PRs are triggering the Risk Alerts, drill into the code for more information, and create a follow-up plan with the assigned engineer to address the problem.
- Are any engineers blocked or task switching?
- While a Jira issue may be labeled “In Progress,” this does not always mean the relevant code is actively being worked on. Workstreams provides clarity by placing Jira status in context with coding activity in a Commit timeline. You can see which issues are in progress and review Commit activity right next to them. If there is a gap in activity for several days, it may signify the engineer is stuck, blocked by another story, or is task switching. This helps EMs identify impediments that could potentially derail sprints and see which Issues are affected. This information can be used to open a constructive dialogue with an engineer in a 1 on 1 or during standup.
- What are the largest efforts to the codebase being made this week?
- While Lines of Code may be used to measure the potential effect on a codebase, it’s been proven to be a flawed metric. Updating 50 lines of boilerplate HTML has a much lower impact on the finished project than a 5 line logic change to a core library. Workstreams makes assessing impact easier by using data science to weigh the magnitude of code changes. A proprietary metric, Code Climate’s Impact factors in variables such as the location of edits, the type of code being written (new code vs. updating existing code), and the specific nature of the change (e.g., formatting changes are simpler than logical changes).
An Engineering Manager can use this data to get a sense of the effect of any unit of work. The Activity chart offers a visual representation of code Impact in the form of bubbles — smaller bubbles signify a smaller Impact, while larger bubbles signify a larger Impact. Hovering over a bubble displays the associated Commit, providing EMs with an immediate view of which Commits have the greatest impact on the codebase.
Phase 2: Lead Healthy Standups
An integral part of the Agile process, standups are meant to provide visibility into each team member’s progress and surface any issues that may need course correction. The reality is, they are often unengaging and unfocused, and some team members are hesitant to raise issues in a public forum. Workstreams provides the structure EMs need to keep standups focused and valuable. It is best used in one of three ways:
- Sort by People
- Instead of waiting for a team member to volunteer to speak next, EMs can save time and surface discussion points efficiently by pulling up an alphabetical list of team members on their screen to run standups in that order.
- Sort by Risk
- Standups are short and should prioritize conversations around identifying and mitigating risk. To make the most out of their standups, EMs can sort risks in the Risk column to show PR issues that have triggered a Risk Alert. This helps laser-focus discussion points while prompting team members to share collective knowledge for a successful triage.
- Sort by Effort
- The Effort column illustrates the cumulative impact of all PRs pertaining to an issue. This helps highlight large stories that can potentially affect many parts of the codebase. Sorting by Effort, EMs can review the issues with the greatest strategic impact first, ensure they are progressing as expected, and potentially use them as a coaching opportunity for newer engineers.
With Workstreams, engineering organizations can approach each day with a more complete understanding of the work that matters most to their current goals, and focus their efforts accordingly. It’s a powerful addition to Velocity, an already robust engineering intelligence platform designed to provide engineering leaders with the end-to-end visibility they need to ship code faster, maintain their competitive edge, and foster a culture of engineering excellence.
In our new series, Code Climate is speaking with customers who use Velocity, our Engineering Intelligence platform.
In this customer interview, we talked to Santiago García, CTO and Co-Founder at La Haus. Santiago shared how using Velocity metrics helped him gain visibility into La Haus’s engineering processes and drive improvements.
Hillary Nussbaum, Code Climate: Tell me a bit about La Haus and your role there.
Santiago García, Co-founder & CTO, La Haus: We are transforming the real estate market in Latin America. It’s a very informal market, it’s a very broken market. So what we are trying to do is to build something that takes everything and puts it together, to transform the industry with technology, data, and good service. As CTO, I was also the first programmer at La Haus. And I had to move through all levels and phases of the company as we grew.
What I’m doing now is, I’m managing the technology of the whole organization. This includes our tech vision, and how we are going to build a world-class engineering team in Latin America.
How big is the team now?
We have 40 engineers.
And at what point did you bring in Velocity and metrics? I imagine when you were a really small team, you didn’t need them yet. At what point did you start to feel like they would be useful?
One year after I started the company, I saw that I had to have accountability. But at that moment, I was not sure how to measure. I started exploring tools.
Then one year ago, when COVID started, we went remote. I have trust with my team and I don’t measure them by lines of code or hours in seats. But I felt we were slow. I didn’t know why. I didn’t know for sure. It was a feeling. You can’t make decisions with a feeling.
So that was when I really decided to look for something.
When you did find Velocity, what was the first thing you did?
I just started to look at how the teams were doing. I started to see a lot of metrics that were going down after we went remote. This was like the first finding for me, where I could see that we really were slowing down.
I had done a lot of reading about Lean Software Development, I read Accelerate. I did a lot of research, and then I saw all of these metrics in the tool. So I understood what Cycle Time was and why it was important. I saw we were increasing, and then I had to communicate that to my team.
Every week we have knowledge-sharing sessions. So, when I scheduled this session, I spoke about Velocity and Cycle Time — how you measure a process, not people. And how you improve a process.
I said to the team, I’m going to start measuring the team just to measure the process and improve it. I’m not measuring individuals. So that was very, very transparent. And everyone was very open and happy and they were all asking me for their metrics and I said, “I’m not going to open these now, let me improve the process first, and then we can start exploring your metrics.”
So, do you share metrics with everybody now, or not yet? Are you still in that working it out phase?
I share them within teams, but not between teams, because metrics change depending on the team’s priorities.
The Team Lead shares the metrics with the engineers. We use the tools for 1 on 1s, and for personal improvement. We review each person’s dashboard with them, but we’re not going to fire someone because their Commits are too large, with too many lines of code. We don’t set a goal without a reason, otherwise everyone is going to optimize to reach that goal, and that goal isn’t the important thing.
What we do, is we go through “Oh, it would be better if you deploy fewer lines of code. I’m not going to measure this, but when you deploy fewer lines of code in a Commit, it can move through the review process more quickly.” That’s good for the process, and it’s good for us.
So, which metrics do you look at? What’s most important to you as a CTO? Or does it depend on the team?
For me as a CTO, I have OKRs. So one objective is maximizing quality without losing velocity. And then we have key results there. One is Cycle Time. You are giving value to the business and you are giving value to the user when you deploy quickly. So we have a goal that is based on a benchmark you gave us, and it feels natural for us. It’s less than 24 hours. When you receive a story and you have everything well-defined, then you can, from your first Commit to the final merge or the deploy to production, keep things under 24 hours.
And we use that metric like a health metric. You start noticing a lot of things when you don’t have that metric going well. We realized that some of our teams with high Cycle Time didn’t have well-defined user stories, and were struggling with unclear requirements. So we started improving user stories, and everything for that team has improved.
Do you ever bring metrics to the Chief Product Officer (CPO) and say, this is what’s happening and this is why we need to change course? When you had the issue with user stories and product requirements being unclear, would you actually bring them the metric and say, this is what’s happening and this is why we need your help?
Yes, it happened that time. First, when I saw we were going slower, I asked my team what was happening. And I saw there that the meeting processes, the ceremonies, how we had that configured, wasn’t working. So I met with our CPO, and I asked him to help me to build a whole design, development, and delivery process.
And we created a new process, and after we created this new process, everything was starting to improve. And you could see the change from the first day we started using this process. The next day we were 20% better in the push metrics, impact metrics. And then after some time we were doubling the productivity we had before.
That’s awesome. What would you say for you has been the most important success you’ve had with Velocity?
It’s visibility. Visibility is very important because what you don’t measure you can’t improve. If you have visibility you can tell if your actions are working or not, and this helps you have a healthy process and to keep improving. For me, that’s actually delivering value, because you can improve your process and it makes you work faster at a higher quality, and that’s good for the business and it’s good for the customers.
Do you have any data on your biggest improvement? I know you said that you doubled productivity. Was there anything else, like, can you speak to how much faster your Cycle Time was, or anything like that?
We had a Cycle Time of 72 hours and we went to 30 hours. So that’s around a 200% improvement.
Would you recommend Velocity?
It’s very difficult to make decisions without knowing what is going to happen. And when you are not measuring something, you feel very insecure to make changes. With a tool you can go on and analyze and see, okay, this is why this is happening. And you can make better decisions. Even if you’re wrong and you make mistakes, you’ll have an easier time seeing what happened and how to fix it. That’s why you need metrics.
To find out how metrics can help your team boost their productivity, reach out to our Velocity product specialists.
The more engineers on your team, the harder it is to gain visibility. If you’re managing four people or more, you’re probably asking questions like:
- How do I supervise the work of all of these engineers?
- How do I make sure I’m adding value where needed?
You can leverage Velocity to address both of these concerns.
Get Immediate Visibility into Your Engineers’ Work
A quick scan of the Activity tab in the Team360 report will give you a sense of both what your team is working on right now and their general work habits.
Hover over a purple circle to see your team’s commits and understand what they’re working on without having to tap them on the shoulder.
Look for:
- Developers who haven’t committed code for a few days. They might be bottlenecked, especially if they’re new to the team.
- Developers whose commits don’t match your expectations for what the team is working on.
- Big commits and PRs (visualized by the largest shapes on the graph).
- Work that is distributed in a way that doesn’t match your expectations.
Use this concrete data as a jumping-off point for in-depth conversations with your team.
Identify High-Risk Pull Requests
Use the Pull Requests report to see PRs that may warrant your attention.
Most managers start by looking for open, high activity PRs. Activity is defined as PRs that are getting either a lot of commits or a lot of comments. To surface the oldest PRs, sort by age by clicking on the "Age" column within Pull Requests. Pay close attention to anything that’s been open for over 72 hours.
You might want to talk to someone like Harry Potter to see if there’s anything you can do to unblock him.
Understand Which Developers Might Need Help
There are a number of metrics that can help you find stuck engineers:
- Weekly Coding Days represents engineering capacity, or how much time per week developers are able to spend actually coding. When this metric dips, it’s an indicator that a team member might be (1) working in large chunks or (2) stuck on a feature or bug.
- PR Throughput & PRs Reviewed are output metrics. If these look unexpectedly low, it might be worth a quick conversation to understand what’s going on.
- Review Cycles & Rework are both proxies for churn. Review Cycles represent the number of times a Pull Request has gone back and forth between the author and reviewer. Rework is the percentage of lines of code that have been rewritten by the same developer within 3 weeks and is helpful for identifying churn earlier on in the development cycle.
Compare these metrics by team or by person in the Compare report to identify who is stuck.
Dive Deeper into Churn Metrics
High Review Cycles and high Rework represent waste in the development process and are therefore a great place to start optimizing.
A developer with high Review Cycles has been asked to go back and fix things in their PRs multiple times. If you see someone with higher than expected Review Cycles, you can investigate further by going into the Analytics tab.
Run a query for Review Cycles, grouped by contributor over the last week or two. Scroll to the bottom until you see the following bar graph visualization:
To understand what’s blocking specific engineers, like Hecate, you can click the arrow next to her Review Cycle count to drill down into specific PRs.
Sort the number of Review Cycles from high to low and look through the ones that have been open the longest. Anything above 1.5 Review Cycles may indicate a problem. In this case, the top two open PRs with 4 Review Cycles is a good place to start.
You can run this same process for Rework, which is another indicator of churn, but at the coding level. Note that the top quartile of engineering organizations keep their Rework to less than 4%.
Use Metrics to Enhance Visibility
Though metrics can’t tell managers everything they need to know, they can be a valuable tool for gaining insight into the work that’s happening on your team. With data like that found in Velocity, you can spot stuck work before it becomes a bottleneck, and make sure your team’s processes are effective.
If you’re not already using Velocity, speak to one of our specialists and find out how you can get a more complete picture of the work being done on your team.
Effective retrospectives are an important opportunity to provide guidance and invest in your team’s future. Though the discussions you have during retros will surface areas of friction or frustration, you may find that anecdotal evidence and gut feel don’t provide enough information. It can be hard to know how to help your team without a concrete means of gauging why developers are struggling (or succeeding).
Leverage data from a Software Engineering Intelligence platform likeVelocity, and you’ll be able to transform your retros into valuable opportunities for learning about team members and how they function within your engineering process. With this information, you’ll be able to run more effective retrospectives by offering relevant support, setting more specific goals, and ensuring your retro action items drive improvement.
Uncover Data-backed Insights
To get a sense for how your team is doing, use Velocity to determine if your engineers are trending up or down over time for the following PR-based metrics:
- Cycle Time, which indicates the time between when the first commit is authored and when a PR is merged. This metric can be used as your team’s speedometer. Aim for a Cycle Time of under 2 days.
- Time to Open, which is defined as the time between the earliest commit in a Pull Request and when the Pull Request is opened. Top-performing teams take less than half a day on average to open a PR.
- Review Cycles, or the number of times a Pull Request has gone back and forth between the author and reviewer. Note that keeping your average Review Cycles below 1.3 keeps your team in the top 50% of engineering organizations.
- Time to Merge, or the duration between when a Pull Request is opened and when it is merged.
Set Quantifiable Goals
To make your learning actionable, head to the Targets page, select your metric, and define a goal. In this case, we’ll aim to keep 90% of Code Reviews to one Cycle. When Review Cycles are high, it can mean one of three things:
- There are differing opinions about what “done” means.
- There’s misalignment around what kind of changes are expected to come out of the review process.
- There are conflicting ideas about how a solution should be implemented.
You can hover over the interactive column chart to see how often your team hit their goal. Selecting any week that didn’t meet an SLA will bring up a drill-down of all the underlying data points (commits, PRs, or reviews), so you can investigate the source of the issue.
In the above example, there are 12 PRs that you can dig into. Leverage this data to investigate places where your goals weren’t achieved and to offer guidance where necessary.
Data is Key to Driving Improvement with Effective Retrospectives
With the right data, you’ll be able to objectively assess your team’s progress and find concrete opportunities for advancement. Combine that with qualitative feedback from your team, and it’s possible to hold retros that effectively surface issues and point towards possible solutions.
Speak to one of our specialists about Velocity, and find out how data can help you drive progress on your engineering team.