Case Studies
EverQuote, Inc. operates a leading online insurance marketplace, connecting consumers with insurance providers. The company’s mission is to empower insurance shoppers to better protect life’s most important assets—their family, property, and future. EverQuote uses data and technology to make insurance simpler, more affordable, and personalized, ultimately reducing cost and risk. Based in Cambridge, MA, EverQuote is one of the fastest growing companies in the Boston area.
As the company scaled, they had a pressing need to analyze engineering team performance in relation to product development. With important questions around technical debt, PR speed, and potential bottlenecks, they began searching for the right solution to address their needs.
The Right Tool for the Job
To quantify their engineering team’s performance and gain actionable insights, EverQuote was in search of a powerful solution. They tested Jira first, but found it wasn’t able to clearly connect the data to their engineering work. Another software intelligence platform wasn’t able to provide the comprehensive and holistic metrics that they needed.
With important questions unanswered around how much technical debt was accruing and how fast PRs were moving, EverQuote’s leadership found themselves frustrated knowing that there were bottlenecks in their code review process but lacking visibility into where or how work was getting stuck.
Enter Code Climate Velocity.
Actionable Insights Drive Process Optimization
EverQuote began working with Code Climate and found immediate value in Velocity. Engineering leaders and managers were able to see the precise length of time that PRs were open, and how much time transpired before they were reviewed and eventually merged. Velocity also allowed them to directly link each PR back to the relevant Jira ticket in the same view, providing the team with a more complete picture of their work to ensure transparency and accurate prioritization. Additionally, thanks to the breadth of metrics offered by Velocity, they were able to dig into each phase of development to gain a more complete understanding of their Cycle Time – their engineering speed – which provided deeper insights.
One such insight occurred when taking a high-level look at Velocity’s Code Review module. Everquote leadership observed that several teams were approving over half of their PRs without comments. Upon further investigation, they uncovered that these teams were handling a large volume of mundane tasks that did not actually need review. With this information, EverQuote’s engineering leaders quickly worked with product managers to automate more basic configuration tasks and reserve engineers’ time for complex work.
Data Reveals Trends and Coachable Moments
In many cases, the insights uncovered by Velocity extended beyond process improvements and helped managers identify opportunities to coach their team. In one case, Code Review analysis revealed a developer that had the highest level of Review Influence on the team – their reviews were thorough and meaningful – surprisingly had the lowest Involvement metric, meaning they were involved with the smallest percentage of pull requests.
Armed with this data, the engineering manager sat down with this developer to learn that they were spending a significant chunk of their time in meetings, limiting their capacity to be involved in the code review process. The manager applied these learnings and helped block off daily time on the developer’s calendar for code reviews. Within a month, their Involvement dramatically increased, and with their contribution to code reviews, the team was able to move code more quickly through review, improving the team PR Cycle Time by several percentage points.
A Multitude of Metrics to Increase Effectiveness
With Velocity integrated into their organization, EverQuote had a wealth of valuable information, enabling them to quickly identify where gaps and bottlenecks existed and helping them to pinpoint the causes. “I love how I can mix and match a bunch of metrics together to look for correlations, make hypotheses about what’s happening with teams, and identify datasets that line up with those hypotheses to validate them,” explained Pheak Yi, Director of Engineering.
Velocity’s reliable, concrete data helps EverQuote understand issues, make recommendations to teams, and evaluate the effectiveness and impact of changes. Since implementing Velocity, EverQuote has improved many critical metrics, including:
- ↑ 18% PR Throughput per Contributor
- ↓ 42% Cycle Time
- ↑ 19% Commit Volume
- ↓ 44% Time to First Review
- ↓ 53% Time to Merge
To learn how Velocity can help you uncover insights to optimize your team’s performance, reach out to one of our product specialists.
On the quest to delight customers and deliver business value, LawnStarter is building a software engineering culture of continuous improvement.
The LawnStarter platform helps homeowners schedule outdoor services, from basic lawn care to landscaping, tree care, pest control, and more via their nationwide network of vetted professionals. The platform serves 120 markets in the United States. Having notched $27M in funding to date, the Austin-based startup, which recently acquired Lawn Love, is on a path of supercharged growth. Naturally, with growth comes challenges.
We sat down with LawnStarter’s VP of Engineering, Alberto Silveira, to chat about how they’re using Velocity to address some of the top challenges their engineering organization faces.
Building Both the Team and Culture of Continuous Improvement
In today’s race for tech talent, LawnStarter isn’t only concerned with hiring engineers as quickly as possible. They’re looking to do so while also improving code quality and team performance. With the engineering team set to grow by 50%-60% annually, Silveira needs deep visibility into engineering activities to help him identify opportunities to level up, which he’ll use to drive the culture toward continuous improvement.
Silveira is no stranger to the practices related to building high-performance teams. In fact, he’s written a book about it. In Building and Managing High Performance Distributed Teams, Silveira details a concept he calls “One Team, One Heart,” which he defines as “the synergy that comes from people feeling good about their place in a highly productive team.”
As he describes in the book: “We are one team, regardless how geographically far apart we are, no matter the person’s religion, skin color, nationality, gender orientation, or physical ability. If a person is a good fit, then the moment we connect as simply humans becomes the foundation of a high-performance team. This ability to connect as humans, to socially and emotionally fuel people’s individual desires to excel in their efforts – this is what I consider to be the true North Star of any business.”
With his compass set on that North Star, Silviera set out to identify measurement tools and metrics to start identifying tangible goals and measuring progress. His navigation led him to Velocity for Engineering Intelligence.
With full transparency into each team and individual’s work, Silveira can present detailed reports to executive stakeholders to demonstrate how building a culture of continuous improvement directly impacts business objectives and key results.
Helping Developers Improve with Data
With team success at the core of the business strategy, Silveira tapped Velocity to create a scorecard of engineering metrics that developers use to advance in their careers. Every engineer has full access to Velocity’s reports, dashboards, and modules to proactively monitor their progress within their teams and as individuals. Goals and engineering metrics correlating to the business “rocks” (OKRs) are proactively shared with LawnStarter’s executive leadership.
While the idea of a scorecard may ruffle some feathers among developers, here again, transparency is key – in both process and communications. Silveira stresses the importance of communicating the value and purpose of engineering metrics. As with any powerful tool, there’s a responsibility to ensure that it’s being used as intended. “If you don’t adopt the tool with the right mindset, people may not be seen through the correct lenses,” Silveira said.
The scorecard helps set clear expectations up front about how the team and individuals are improving. “By explaining each individual metric ahead of time, and how those metrics contribute to achieving major goals, people understand their roles more clearly and how they can improve by taking actions that will make all of us better at the end of the day – and it works.”
Key Metrics Help Focus Efforts
While the scorecard is updated as goals evolve, the most recent version tracks PR Throughput, Review Speed, Commit Volume, Weekly Coding Days, Time to Merge, and Unreviewed PRs. Cycle Time is also reported quarterly for the team. Silveira finds Velocity’s Compare module particularly useful to view all of these metrics in the same report by individual and team. That provides him visibility into what teams are working on and a means of visualizing patterns that indicate progress or potential areas for improvement.
LawnStarter chooses to focus on a few key metrics at one time, recognizing that it can be overwhelming to track too many metrics. Silveira adopted Velocity by first performing an analysis to determine the metrics most meaningful for LawnStarter to improve. He then presented these metrics to each team and individual, explaining how they can monitor their progress to hit milestones.
Data-Driven Insights Fuel the Culture of Continuous Improvement
One of the first goals established with Velocity was for each engineer to have at least 4 days a week writing code. Monitoring Velocity’s Weekly Coding Days metric helps the engineering leadership understand if engineers have the time necessary to focus on writing high quality code. As a result, leadership realized that engineers were spending too much time in meetings. By sharing these goals and observations, the teams were able to reorganize calendars, and eventually increase average Weekly Coding Days from 2 to a little over 4.
The insights from Weekly Coding Days also helped LawnStarter identify positions to fill and organizational improvements that allowed engineers to spend more time working in the code – aka, their happy place.
By analyzing PR Throughput, Silviera was able to identify imbalances on the team. For example, certain developers were frequently working outside of the main branch, tickets weren’t sliced evenly (pointing to a workload distribution issue), and there were domain knowledge gaps.
“Velocity helps me visualize engineering productivity data that leads me to identify opportunities to improve my teams and processes,” Silviera said. “It allows me to make data-driven decisions that give me the confidence I need to achieve business objectives more quickly and effectively.”
Another insight LawnStarter made with Velocity was that Commit Volume was low, with an average of 5 commits per week. Digging into the data more, they observed that Review Speed could be 30 hours at times, a result of large PRs. By sharing and setting goals around this data, they were able to increase Commit Volume and decrease Review Speed. This also proved to impact Defect Rate, demonstrating that the overall quality of the code was improved as a result.
With these insights and others from Velocity, LawnStarter was able to improve both Cycle Time and PR Throughput 38%, along with a 57% improvement in Time to First Review with nearly 100% of PRs being reviewed.
Silveira thinks about reviewing engineering metrics as similar to perusing the stock market: “You may not want to look at it every day. Instead, use the data to help you identify patterns that lead to improvements in your teams.”
Engaging Business Stakeholders
As an engineering leader, Silveira knows that when engineering work is sliced into small pieces, which he describes as “delightful pieces of carpaccio,” that work translates into delightful feature releases that customers love. When new features are released efficiently, the business as a whole benefits directly.
As the VP of Engineering, Silveira believes that an important part of his role is sharing Engineering Intelligence data and explaining why it’s important to both the executive team and the Board of Directors. A typical question that he fields from the board inquires about the percentage of investment that goes toward building new features, versus maintaining existing features through code maintenance. That data has a direct impact on financial planning, for example, with revenue recognition. Silveira uses this opportunity to explain how the business benefits when more time is invested in building the product (and building it well) – time spent on innovation – opposed to time spent on maintenance.
While he’s found that non-technical business stakeholders are interested in understanding engineering data, Silveira ensures that he’s always positioning them in relation to the company’s overarching objectives. With Engineering Intelligence data from Velocity, LawnStarter paints a picture of business success that stems from the hard work engineering teams perform every day when building a culture of continuous improvement.

In our new series, Code Climate is speaking with customers who use Velocity, our Engineering Intelligence platform.
In this customer interview, we talked to Santiago García, CTO and Co-Founder at La Haus. Santiago shared how using Velocity metrics helped him gain visibility into La Haus’s engineering processes and drive improvements.
Hillary Nussbaum, Code Climate: Tell me a bit about La Haus and your role there.
Santiago García, Co-founder & CTO, La Haus: We are transforming the real estate market in Latin America. It’s a very informal market, it’s a very broken market. So what we are trying to do is to build something that takes everything and puts it together, to transform the industry with technology, data, and good service. As CTO, I was also the first programmer at La Haus. And I had to move through all levels and phases of the company as we grew.
What I’m doing now is, I’m managing the technology of the whole organization. This includes our tech vision, and how we are going to build a world-class engineering team in Latin America.
How big is the team now?
We have 40 engineers.
And at what point did you bring in Velocity and metrics? I imagine when you were a really small team, you didn’t need them yet. At what point did you start to feel like they would be useful?
One year after I started the company, I saw that I had to have accountability. But at that moment, I was not sure how to measure. I started exploring tools.
Then one year ago, when COVID started, we went remote. I have trust with my team and I don’t measure them by lines of code or hours in seats. But I felt we were slow. I didn’t know why. I didn’t know for sure. It was a feeling. You can’t make decisions with a feeling.
So that was when I really decided to look for something.
When you did find Velocity, what was the first thing you did?
I just started to look at how the teams were doing. I started to see a lot of metrics that were going down after we went remote. This was like the first finding for me, where I could see that we really were slowing down.
I had done a lot of reading about Lean Software Development, I read Accelerate. I did a lot of research, and then I saw all of these metrics in the tool. So I understood what Cycle Time was and why it was important. I saw we were increasing, and then I had to communicate that to my team.
Every week we have knowledge-sharing sessions. So, when I scheduled this session, I spoke about Velocity and Cycle Time — how you measure a process, not people. And how you improve a process.
I said to the team, I’m going to start measuring the team just to measure the process and improve it. I’m not measuring individuals. So that was very, very transparent. And everyone was very open and happy and they were all asking me for their metrics and I said, “I’m not going to open these now, let me improve the process first, and then we can start exploring your metrics.”
So, do you share metrics with everybody now, or not yet? Are you still in that working it out phase?
I share them within teams, but not between teams, because metrics change depending on the team’s priorities.
The Team Lead shares the metrics with the engineers. We use the tools for 1 on 1s, and for personal improvement. We review each person’s dashboard with them, but we’re not going to fire someone because their Commits are too large, with too many lines of code. We don’t set a goal without a reason, otherwise everyone is going to optimize to reach that goal, and that goal isn’t the important thing.
What we do, is we go through “Oh, it would be better if you deploy fewer lines of code. I’m not going to measure this, but when you deploy fewer lines of code in a Commit, it can move through the review process more quickly.” That’s good for the process, and it’s good for us.
So, which metrics do you look at? What’s most important to you as a CTO? Or does it depend on the team?
For me as a CTO, I have OKRs. So one objective is maximizing quality without losing velocity. And then we have key results there. One is Cycle Time. You are giving value to the business and you are giving value to the user when you deploy quickly. So we have a goal that is based on a benchmark you gave us, and it feels natural for us. It’s less than 24 hours. When you receive a story and you have everything well-defined, then you can, from your first Commit to the final merge or the deploy to production, keep things under 24 hours.
And we use that metric like a health metric. You start noticing a lot of things when you don’t have that metric going well. We realized that some of our teams with high Cycle Time didn’t have well-defined user stories, and were struggling with unclear requirements. So we started improving user stories, and everything for that team has improved.
Do you ever bring metrics to the Chief Product Officer (CPO) and say, this is what’s happening and this is why we need to change course? When you had the issue with user stories and product requirements being unclear, would you actually bring them the metric and say, this is what’s happening and this is why we need your help?
Yes, it happened that time. First, when I saw we were going slower, I asked my team what was happening. And I saw there that the meeting processes, the ceremonies, how we had that configured, wasn’t working. So I met with our CPO, and I asked him to help me to build a whole design, development, and delivery process.
And we created a new process, and after we created this new process, everything was starting to improve. And you could see the change from the first day we started using this process. The next day we were 20% better in the push metrics, impact metrics. And then after some time we were doubling the productivity we had before.
That’s awesome. What would you say for you has been the most important success you’ve had with Velocity?
It’s visibility. Visibility is very important because what you don’t measure you can’t improve. If you have visibility you can tell if your actions are working or not, and this helps you have a healthy process and to keep improving. For me, that’s actually delivering value, because you can improve your process and it makes you work faster at a higher quality, and that’s good for the business and it’s good for the customers.
Do you have any data on your biggest improvement? I know you said that you doubled productivity. Was there anything else, like, can you speak to how much faster your Cycle Time was, or anything like that?
We had a Cycle Time of 72 hours and we went to 30 hours. So that’s around a 200% improvement.
Would you recommend Velocity?
It’s very difficult to make decisions without knowing what is going to happen. And when you are not measuring something, you feel very insecure to make changes. With a tool you can go on and analyze and see, okay, this is why this is happening. And you can make better decisions. Even if you’re wrong and you make mistakes, you’ll have an easier time seeing what happened and how to fix it. That’s why you need metrics.
To find out how metrics can help your team boost their productivity, reach out to our Velocity product specialists.
The following article is based on a talk Juan Pablo Buriticá, VP of Engineering at Splice, gave at our annual Engineering Leadership Conference and a subsequent interview. Watch the full talk here, and see the slides here.
“The most shocking thing is that software engineering is one of the least rigorous practices that exists,” says Splice’s VP of Engineering, Juan Pablo Buriticá. After graduating with a degree in Pharmaceutical Chemistry, he eventually taught himself to code and transitioned to a career in software. Juan Pablo was astonished to find software engineering to be a much more fragmented discipline. Few standards exist around even the most common software production methods, like Agile and Continuous Delivery.
When managing a small team, the lack of industry standards was rarely an issue for Juan Pablo. Whenever something felt inefficient, he’d get the whole engineering team in a room, identify the source of friction, adjust, and move on. After Juan Pablo scaled his team from 15 to 80 distributed developers, however, all their processes broke. “I had to go back and fix the mess I created by growing the team so fast,” said Juan Pablo.
But fixing them wasn’t so easy anymore. So, Juan Pablo turned to engineering measuring tools and the Scientific Method.
Experiment 1: Applying Metrics to Engineering
Forming a Hypothesis
Before experimenting to determine which actions would yield improvement, Juan Pablo and the rest of the management team agreed that they needed to determine what specific outcome they were optimizing for. The team agreed that everything felt slow— but a gut feeling wasn’t enough to start making changes in the team.
They wanted to:
- First, decide what they were working towards. They weren’t willing to settle for a vague anti-goal of “slowness”— they wanted a clear vision of what the team should look like.
- Second, decide how they would measure progress. Within the newly agreed-upon context and direction of the team, they wanted a system to measure how far away they were from their goals.
Thus, their hypothesis was: A Defined Direction + A Focus on Success Metrics = Increased Tempo.
The product and engineering leadership spent an offsite deliberating on what was next for Splice. They came up with the following vision for the organization: Shipping working code is one of the fastest, safest, and most effective ways to learn and to test new ideas. This meant that engineers were confident enough in their processes and tooling to take risks. And they also felt able to mitigate issues when invariable something did break.
To test how they were doing and how far they had to go, they leveraged engineering measuring tools to investigate three metrics: Time to Merge, Deploy Frequency, and End to End Test Coverage. Combined, the team believed optimizing for these metrics would give their team confidence in the stability and speed of their processes.
Conducting the Experiment
Juan Pablo and the leadership team communicated this new vision and supporting metrics to the team. They were careful to note that this was an experiment designed to help improve collaborative processes— not a change in response to performance issues.
These are the goals they communicated:
- Time to Merge: 100% of pull requests should be merged within 36 hours (or 3 days)
- Deploy Frequency: All product teams had to deploy once a day
- End to End Test Coverage: 100% of engineers had to write an end-to-end test in an improved testing environment
The specific targets they chose for each metric were a guess. “I picked 36 hours, because why not?” says Juan Pablo. The team was experimenting with metrics for the first time, so they had to start with a number. He predicted that enabling his team to track and measure these metrics alone would be enough to create change.
Analyzing the Results
After one quarter, Juan Pablo didn’t observe the results he anticipated.
Although one engineer did put in work to make staging less of a blocker to production, there were few other changes to how the team worked. Pull Requests were not being merged within 3 days, and product teams were not deploying once a day.
These metrics revealed that they hadn’t moved the needle, but didn’t reveal what to do about it.
Experiment 2: Applying Actionable* Metrics to Engineering
Forming a Hypothesis
Juan Pablo had a conviction that their direction was right, but he realized the metrics that they had chosen weren’t actionable. It wasn’t clear what could be done by any individual engineer or manager to improve how the process works. “I knew I needed better metrics and measurements,” Juan Pablo told us.
So he scoured the internet for all the reading material he could find. Two sources moved him toward finding more better measurements:
- State of DevOps reports, which regularly surveys 1,000s of engineers to identify positive work patterns and the best indicators of improvement.
- Accelerate, in which the authors of the DevOps reports distilled their findings after four years and identified four crucial metrics to measure and improve engineering tempo.
These resources were based on research that had been conducted over several years with scientific rigor— exactly what Juan Pablo was looking for.
One major pattern that the researchers promoted was to distinguish product design from product delivery. Juan Pablo had been thinking of all of product and engineering as a single entity— but the process could be separated into predictable and unpredictable portions of the workflow.
Product design and planning are, by nature, unpredictable. They often involve scoping work that has never been done before, so it often results in imprecise estimation of scope and effort. Delivery, on the other hand, can be made predictable. Engineers can ship changes incrementally, irrespective of the scope of the feature they’re working on.
Thus Juan Pablo’s new hypothesis was: Decoupling Engineering from Product + Actionable Deliverability Metrics = Increased Engineering Tempo. The metrics they chose were Cycle Time, Mean Time to Restore and Deploy Frequency.
With a new hypothesis and a “plan for the plan,” as Juan Pablo calls it, the engineering team was ready to try again.
Conducting the Experiment
Decoupling engineering from product would take some heavy lifting, so Juan Pablo put together a Production Engineering team. “Their job was to build the tooling, services, and expertise that enables teams to deliver and operate high quality, production-level software and services,” says Juan Pablo.
This team was responsible for owning improvement on key metrics:
- Cycle Time (commit to production), targeting less than one hour.
- Mean Time to Restore (MTTR), targeting less than one hour.
- Deploy Frequency, targeting more than once a day.
To be able to track Cycle Time and Deploy Frequency, Juan Pablo found an engineering analytics tool, Velocity. Out-of-the-box, it shows three years of historical data, so Juan Pablo could measure how scale impacted the team, and whether they were trending in the right direction.
To start trending in the right direction, they had to work towards giving engineering more ownership over product delivery. Decoupling meant a few major transitions:
- Engineers were responsible for deploying code, while product would decide when to release features to customers.
- Testing is shifted left and becomes integrated into the developers’ responsibilities. Developers, therefore, don’t have to wait for a QA team to ship changes.
- The department invests in more testing and monitoring tooling, so the team can ship with more confidence.
Over the next quarter, the Production Engineering team worked with the organization to bring down Cycle Time.
Analyzing the Results
At the end of that quarter, the results spoke for themselves. On his Velocity dashboard, Juan Pablo saw Cycle Time had decreased by 25%. Even more importantly, however, it had become consistent:
The team’s throughput had increased 3x without a significant change in headcount:
“We saw results—and we also finally had the language to talk about performance,” said Juan Pablo.
The actionable metrics Juan Pablo had discovered monitored within Velocity gave the whole team a means to communicate how far away they were from their goals. When an engineer was blocked for any reason, they could point to the effect it had on Cycle Time. This focus helped them solve the immediate problem of increasing tempo, but also equipped the team with the visibility to solve upcoming problems.
Building Scientific Rigor into Continuous Improvement
While the metrics and practices in Accelerate aren’t quite industry standards yet, the researchers have applied a level of scientific rigor that has yielded predictable results for organizations of all sizes. The DevOps report has shown that over the past 4 years, an increasing number of organizations are practicing Continuous Delivery. More of the industry is using engineering measuring tools to look at metrics like Cycle Time and Deploy frequency, and seeing tangible improvements in engineering speed.
Through these recent studies and his own research, Juan Pablo had the unbiased data to finally approach software engineering like a scientist.
Thanks to the hard work of the Splice engineering team and their investment in engineering measuring tools like Velocity, Juan Pablo told us: “We have created a culture of continuous systems and process improvement. We also have a language and a framework to measure this change.” Sign up for Velocity demo to see how your team can benefit from similar visibility.
“Effective engineering leadership is being outcome-oriented,” says Kickstarter’s Mark Wunsch.
When Mark first joined Kickstarter as VP of Engineering, one of his first decisions was to re-organize the engineering department, based on business-oriented objectives.
Each 3-7 person scrum team focused on a different “essence,” or a different customer-facing part of the product. This helped engineering understand their work from a business perspective. Mark tells us, “The objective is not to ask, ‘Is the code good?’ but to ask ‘Is Kickstarter good?’”
The engineers’ perspective, however, was difficult to communicate with leadership.
The engineers were constantly bogged down by problems that were invisible to non-technical colleagues, such as legacy code. Kickstarter has been around for about 10 years, so a big portion of the codebase was troublesome to work with. Mark told us, “To an engineer, it’s so obvious when a piece of code is brittle, but it’s really hard to advocate for putting engineering resources into solving technical debt.”
Mark decided to use metrics to further align engineering and leadership.
Diagnosing technical debt with data
Every developer knows that legacy code undoubtedly slows down engineering. But taking weeks away from shipping new features compromises how much new value the company is delivering to customers.
Before making a case for refactoring to leadership, Mark decided to do a deep dive into where technical debt was slowing down the team. He used engineering analytics tool Velocity to learn how each engineering team was working and where they might be getting stuck.
Mark started by looking at his team’s weekly throughput, as measured by merged pull requests. Whenever the throughput dipped significantly below their average, he’d know to investigate further.
Seeing a low Pull Requests/Merged at the end of the week can be a red flag a team was stuck.
Unlike subjective measures that are common on most engineering teams, like story points completed, Velocity metrics are represented by a concrete unit of work: the Pull Request. This enables Mark to objectively understand when a scrum team is really bogged down, compared to the last sprint or last month.
Once he spotted productivity anomalies, Mark would pull up a real-time report of his teams’ riskiest Pull Requests. Pull Requests that were open longer and had a lot of activity (comments and back-and-forths between author and reviewer) were at the top of the list.
An example of Velocity’s Work In Progress which shows the old and active PRs that may be holding up the team.
Because trickier parts of the applications tend to require more substantial changes, pull requests that are most “active” often point Mark to the most troublesome areas of the codebase.
After a few weeks of investigation, Mark was able to find concrete evidence for what his intuition was telling him. “The data showed that we were consistently slowed down because of legacy code,” said Mark.
Bringing transparency to engineering practices
During meetings with the executive team, Mark could now point to weeks with less output and prove that technical debt was impeding the engineering team from their primary business objective: continuously delivering new features.
To communicate how the team was doing, he’d present a Pull Request throughput chart with a trend line:
A Velocityreport showing Pull Requests Merged/Day, over the last 3 months.
This helped leadership visualize how much Kickstarter was growing in their engineering efficiency but also opportunities for further improvement.
Mark also shared Cycle Time (i.e., how quickly code goes from a developer’s laptop to being merged into master.)
A Velocity report that shows the fluctuation of Cycle time, over the last 3 months.
Cycle time was a great indicator of how much trouble it was to make a change to the codebase. High cycle time would often correspond to low output a day or two later, showing that some form of obstruction existed for a developer or team.
These two charts, along with Mark’s summary of his more technical findings, aligned all of leadership around scaling back on new features temporarily and dedicate more time to refactoring.
Bridging engineering and leadership
After spending time investigating what legacy code was slowing down the team, Mark was able to take a strategic approach to how they tackled technical debt.
Rather than jump on the opportunity to fix anything that looked broken, he could have teams focus on the biggest productivity blockers first. Engineers were happy because they had the time to rework the legacy code that was constantly slowing them down. Leadership was happy when they could see long-term improvements in engineering speed. Six months after refactoring, Kickstarter saw a 17% increase in Pull Requests merged and a 63% decrease in Cycle Time. It was a win-win-win.
Mark tells us, “Being able to talk about technical debt in the same way we talk about business metrics is incredibly powerful.”
If you want to learn exactly how much technical debt is slowing down your own engineering team, talk to one of our Velocity product specialists.
Thousands of happy customers validated our software– but dogfooding Velocity validated our values.
A couple of years ago, our engineering leaders were anecdote-driven, like just about everyone else in the industry. We knew how much progress an engineer had made on a new feature because we asked. We knew why we missed a deadline for launching a new feature because we discussed it in our retros.
But we couldn’t answer simple questions like:
- Is our efficiency increasing or decreasing over time?
- What work slows us down and where is the biggest opportunity to improve?
- Which developers on my team are stuck, right now?
Even on a small development team, the insights that we had into our own productivity were limited.
Last year, we launched Velocity, an engineering analytics tool designed to help teams big and small with exactly the issue that we, ourselves, experienced. In the process of iterating and improving the platform, our Engineering Manager, Ale Paredes dogfooded our app. She used each feature from Velocity as soon as it was built and has experienced the benefits ofdata-driven engineeringfirst-hand.
Armed with Velocity, she addressed burnout, improved remote collaboration, and helped restructure the engineering team. The result was an 83% increase in productivity, and a healthier, more engaged dev team.
Here’s what dogfooding Velocity has done for Code Climate.
We Ditched Flat and Near Doubled Our Efficiency
Flat structure doesn’t scale. There comes a point along every engineering team’s growth where the same set up that once built camaraderie and a shared purpose now fuels disengagement and a lack of focus.
Ale first started noticing that disengagement during daily standups. Some people were zoning out; others were on their phones. Almost no discussion was happening. It was 20 minutes of engineers taking turns speaking, one by one. When she brought this up in her 1:1s that week, she found that the team was in unanimous agreement: meetings were inefficient and taking up too much time.
Ale checked her hypothesis against the metrics by looking at Pushes per Day over the last 6 months.
Velocity gave her confirmation that the team’s efficiency had, in fact, been steadily decreasing over the past four months.
Ale took this insight back to the leadership team, and together, they decided it was time to ditch flat. Software development is inherently collaborative, and if engineers have too many co-workers to support, they can’t feel invested in one another’s work.
We decided to break up the ten-person team into groups of three or four engineers. We hypothesized that breaking up teams byBezo’s 2-pizza rulewould help individual engineers focus on less tracks of work. As a result, meetings would suck up less time and be more engaging, as smaller teams only hash out problems relevant to the few people involved.
When Ale implemented this change, the feedback was overwhelmingly positive. Engineers were doing more of what they liked (coding), and less of what they hated (meetings). Over the course of several months, the metrics corroborated what the team was feeling: we started moving much faster.
We went from an average of12 pushes/dayin November to an average of21 pushes/dayin January, an 83% increase.
We Coached Remote Team Members for Better Collaboration
Agile software development relies on strong communication, and, in many cases, frequent face time, so managing team members that are an ocean and three time zones away is nontrivial. It’s hard to perceive frustration through Slack. It’s hard to understand workload through Zoom.
Ale made a concerted effort to check in with remote team members and find out what’s going well and where they might be in need of coaching. But not everyone is an open book– many of her remote team members hesitated to bring up troublesome pull requests or bottlenecks during these meetings.
To find a starting point for these conversation, Ale started looking through a handful of contributor metrics on a weekly basis. She would pay particular attention at overall throughput (# of PRs merged), rework (how often developers work on their own recently merged code), and cycle time (how long it takes code to go from a developer’s laptop to being a merged PR).
By putting together a chart in Velocity, she started noticing a pattern. Remote developers had a significantly higher cycle time than HQ team members.
Before a 1:1 with Legolas Greenleaf, Ale dug deeper into Velocity to see where, exactly, in the PR process contributors were getting stuck.
Ale discovered that Legolas was spending a lot of his time working on code on his laptop before opening up a Pull Request and getting his work looked over.
The next time they sat down, Ale discussed the trend she noticed. The remote team member was able to speak more specifically about what has been slowing him down and what challenges he was facing. In their conversation, she guided Legolas towards learning how he could’ve better approached some of the last few PRs.
Together, they discovered the heart of the problem was that his PRs were too big. Splitting up projects into smaller pieces was a work habit that the HQ team had heard a ton, but the distance between Ale and the remote workers meant they weren’t aligned in terms of best practices. The data brought Ale’s attention to the problem, and gave her something objective to work off for her coaching sessions.
We Prevented Burnout in our Engineers
Meeting deadlines and building great products isn’t the only measure of a good team. We also want engineers to be engaged and not overworked, so that our pace is sustainable. Too often, however, burnout is impossible to sniff out until it’s too late.
Last December, the team was on a tear. We were shipping features every other day, we had redesigned most of the pages in the application, and everyone was stoked about all the cool new stuff we were building. Everything seemed great.
During her weekly check-ins, however, Ale started noticing a trend.
Engineers were excited about their work, but everyone seemed to be feeling a lot of pressure to get features shipped– even though we were ahead of schedule. One senior engineer mentioned that he barely had time for code reviews. Other team members started neglecting pair programming in favor of spending more time getting stuff out the door.
Ale used Velocity to take a look at what the team had on their plate:
She noticed that some developers had so much activity, it barely fit in their row. In a few cases, we were even pushing on weekends, which is highly unusual for our organization.
Looking through all the PRs and reviews the engineering team was churning out, Ale became suspicious that people were working overtime. She put together a report using Velocity’s Reports Builder to see how many pushes were made after 8pm each week:
During the last two weeks, the team had been working late hours more than they had in the previous three months combined. Ale brought this data to the leadership team and was able to successfully advocate scaling back work and giving the engineering team a well-deserved day off.
Now, Ale checks these dashboards regularly and sends out a monthly survey to check in on how work is distributed and how team members are feeling.
Measure and Mobilize
Metrics are not everything. Metrics didn’t help Ale notice that engineers were disengaged during meetings, or that remote team members weren’t voicing problems. Instead, metrics helped helped her check her intuition with more transparency into what’s going on. They also enabled Ale to verify that the changes she made generated an improvement in our productivity.
This gut-check was invaluable in helping us move faster and communicate better, both inside the engineering team and with the organization as a whole.
If you want to learn more on how Velocity can let you see deeper into your team’s work habits (and help you move at least 20% faster), sign up for a demohere.

We sat down with Jake Hiller, Head of Engineering at Codecademy, to find out how they use Code Climate’s automated code review tool, Quality, to maintain their quality standards while rapidly growing their engineering team.
INDUSTRY Education
EMPLOYEES 50+
DEVELOPERS 20+
LOCATION Manhattan, NY
LANGUAGES Ruby, JavaScript, SCSS
CUSTOMER Since May 2013
"Code Climate keeps our process for creating PRs really low-effort so we can quickly test ideas and ship sooner."
Why Code Climate Quality
Like many rapidly developing teams, Codecademy was running into growing pains for both engineering onboarding and code review. They had tried using local analysis tools but found them cumbersome to integrate as development environments varied across the team.
With an engineering workflow centered around pull request reviews, and a desire to reduce friction in committing and testing code, they needed a solution that would optimize their pull request review process and enable new team members to quickly become productive.
Codecademy had been using Quality for their Ruby stack since 2013. When Head of Engineering, Jake Hiller, joined in early 2015, he saw an opportunity to alleviate their code review and onboarding issues by rolling it out to the whole team.
“We wanted to avoid anything that blocks engineers from committing and testing code. Other solutions that use pre-commit hooks are invasive to both experimentation and the creative process. Code Climate’s flexibility helps us maintain rules that are tailored to our team and codebase, while offering standard maintainability measurements. Plus it enables us to defer checks until code is ready to be reviewed, so we can quickly test ideas and ship sooner.”
“Code Climate helps us transfer knowledge to new engineers – like our coding standards, why we’ve made decisions over time, and why we’ve chosen certain structures and patterns."
Increased speed and quality
Since rolling out to the whole team, Hiller says Codecademy has seen an improvement in the quality of their code reviews and the ease with which new team members get up to speed.
“Code Climate helps us transfer knowledge to new engineers – like our coding standards, why we’ve made decisions over time, and why we’ve chosen certain structures and patterns. New engineers can look through the Code Climate issues in their PR, ask questions, and propose changes and suggestions to the team.
“It’s also increased the speed and quality of our pull request reviews. We’ve been able to spend more time discussing the important functional aspects of our code, and less time debating smaller issues. There are a lot of issues that can’t be fixed with an auto formatter, which is where Code Climate will always be really helpful for our team.”
About Codecademy
Codecademy was founded in 2011 as an immersive online platform for learning to code in a fun, interactive, and accessible way. They’ve helped 45 million people learn how to code, covering a wide variety of programming languages, frameworks, and larger topics like Data Analysis and Web Development. Their recently released Pro and Pro Intensive products provide users with more hands on support and practice material to help them learn the skills they need to find jobs.

If you’ve spent any amount of time working with software professionally, chances are you’ve experienced the vicious cycle of development (if you haven’t, take a moment to count your blessings then read on for a cautionary tale):

High pressure situations place strain on developers, which leads to sloppy work, resulting in software being delivered late and broken – when it’s delivered at all.
Instead of being pressure-driven, as in the cycle pictured above, we’re aiming for a “virtuous cycle” which focuses on quality:
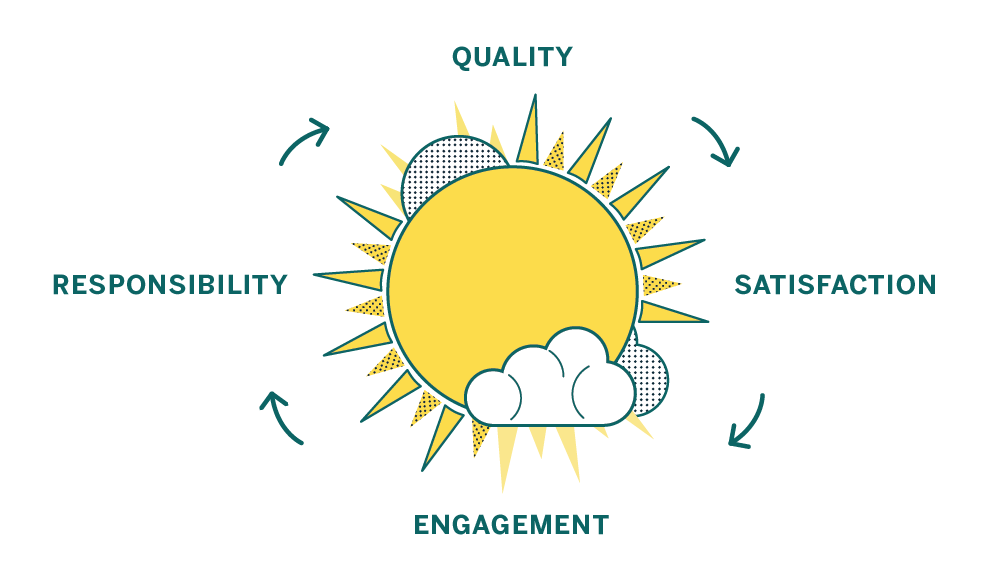
A focus on quality leaves individual contributors feeling satisfied, which makes them more engaged. That engagement leads to a sense of responsibility over the product and the code. A sense of responsibility and ownership leads to higher quality work, and the cycle starts over again.
Here at Code Climate we have experience as software engineers, engineering managers, product owners, and startup founders – and in all those roles we’ve seen evidence that a commitment to code quality has amazing benefits. Over time your codebase will become healthier, making it easier to change, more fun to work with, and your features will be easier to implement. As a result your code will be more reliable when it runs, bringing benefits to your business. Sounds good, right?
Unfortunately, breaking out of a vicious cycle is challenging because the cycle feeds on itself and doesn’t allow much time for the work needed to establish good practices. But while there is work involved, it’s definitely not impossible, and good tools and advice can help you beat the clock and replace your vicious cycle with a culture of code quality.
We’ve identified steps you can take to move toward a sustainable culture of code quality, no matter what kind of code you’re working with:
- Codify your best practices
- Automate, automate, automate
- Get the right info to the right people
- Measure your progress
- Encourage participation and ownership

Update: See our CEO and Co-Founder Bryan Helmkamp introducing the Code Climate Quality Platform!
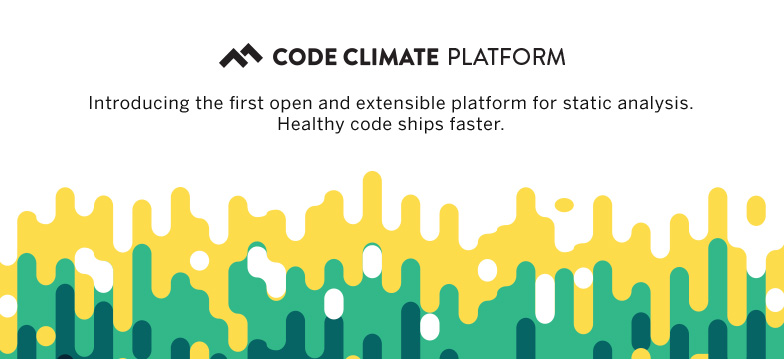
Today, we’re thrilled to launch the Code Climate Quality Platform − the first open, extensible platform for all types of static analysis.
We’ve come a long way since we started building a static analysis tool for Rubyists. Today, we’re fortunate enough to help 50,000 developers analyze about 700BN lines of code every weekday. As we’ve grown, we’ve seen that clear, actionable static analysis leads to healthier code and happier developers. Our new platform brings those benefits to every team, regardless of the technologies they use, so that they can focus on shipping quality software.
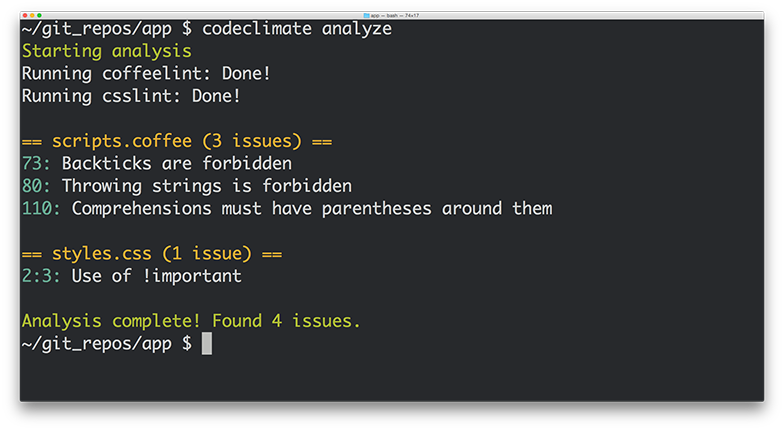
What does this mean exactly? First, we’re open sourcing our analysis tools, including the engines and algorithms we use to evaluate code. If you have a running Docker host, using Code Climate on your command line is as easy as:
boot2docker up && `boot2docker shellinit` brew tap codeclimate/formulae brew install codeclimate
We’re also enabling anyone to write static analysis engines that run on our servers by following a simple specification. No longer will you have to wait for us to provide support for your programming languages, frameworks and libraries of choice. Finally, using our new Code Climate CLI, you can now run any Code Climate-compatible static analysis on your laptop – for free.
Let’s look at each of these in turn…
Open Source
We’re releasing the static analysis engines that power the new Code Climate Quality Platform, and going forward, all of our static analysis code will be published under Open Source licenses. Code Climate has always provided free analysis to Open Source projects, and this continues to deepen our commitment to, and participation in, the OSS community.
Code Climate has always stood on the shoulders of giants in depending on Open Source libraries for the bulk of our static analysis algorithms. We would not exist today if not for the great work of people like Ryan Davis (Flog, Flay) and Justin Collins (Brakeman) that demonstrated the value of static analysis and allowed us to quickly bring it to developers.
Open Source static analysis means you can dig in and understand exactly how your code is being evaluated. And customizing static analysis algorithms becomes as simple as clicking the “Fork” button on GitHub…
Extensible
With the release of our new Code Climate Engine Specification, anyone can write static analysis engines that run on our servers. Code Climate’s set of officially supported languages can be augmented with community supported static analysis engines so that you can get confidence in your code, regardless of your choice of technology. For years, our most common type of feature request has been, “Can you add support for X?”, where X is a programming language, version of a language, or sometimes a framework. We’ve always wanted Code Climate to work for all developers, but in the past we were limited by the effort required to add new languages.
We believe that you shouldn’t have to wait for a vendor to add support for the languages you love, so are finally removing ourselves as the bottleneck to new static analysis features. Anyone who is interested in using Code Climate with their favorite languages, frameworks and libraries is free to build an engine to do so. Results from engines retain all the benefits of the Code Climate product, including automatic analysis of every Pull Request, comparison views, ratings/GPAs, and notifications. Of course, there’s already a vibrant community of OSS static analysis tools, and we’re excited to see what people are able to build and integrate. It’s really astounding how simple it is to build a Code Climate engine, as we’ve watched developers build functioning analysis from scratch in a matter of a couple hours.
If you want to give it a try, join our new Developer Program and we’ll be there to guide you along the way.
Run Anywhere
In addition to the spec, we’re also releasing the Code Climate CLI, which makes it easy to get static analysis results (both from Code Climate’s official engines and community-supported engines) in one clear, unified report right on your laptop. When you’re ready, you can load your repository into codeclimate.com and we’ll automatically apply the exact same configuration you use locally to analyze every commit and Pull Request, making the results available to your entire team.
To make static analysis truly ubiquitous, we realized it was not enough to support a wide variety of tools, we need to make it trivial to run these tools anywhere the developer is working. You shouldn’t have to wait to push your source code to a remote server to get clear, actionable static analysis results. Now it’s possible to easily run the same static analysis we run on our servers on your command line.
New Static Analysis Engines
We’re fortunate to be partnering with creators of two prominent Open Source projects who understand the value of static analysis in ensuring healthy code, Tom Dale from Ember.js and Laurent Sansonetti from RubyMotion. Here’s what they have to say about the Code Climate Quality Platform:
“The Ember community takes good tooling seriously. I’m excited to partner with Code Climate and bring their service to our users because better static analysis means better Ember apps.”
– Tom Dale from Ember.js
“HipByte is excited to partner with CodeClimate to provide clear and reliable code reviews for RubyMotion projects. RubyMotion allows Ruby developers to write cross-platform apps for iOS and Android by leveraging the native platform APIs, and a tool for static analysis means fewer crashes and more reliable applications.”
– Laurent Sansonetti from RubyMotion
Accordingly, we’re releasing an Ember.js engine that brings the Ember Watson tool to all Code Climate users, and a set of custom checks for RubyMotion that will help ensure that your application code is reliable.
In addition, we’re proud to release eight new static analysis engines that you can start using with Code Climate today:
- Gofmt, Govet and Golint – The official style, bug and lint checkers from the Go team
- CoffeeLint – Style checking for the CoffeeScript dialect of JavaScript
- CSSLint – Style checking for all CSS stylesheets
- Rubocop – Style and quality checks for Ruby code (including support for RRuby 2.2+)
- ESLint – Linting and style checking for your modern EcmaScript/JavaScript code
- Bundler Audit – Find security vulnerabilities in your Ruby dependencies
- PHP CodeSniffer – Style checking for PHP
Healthy Code Ships Faster
In many ways, our new platform is a culmination of the experience we’ve gained over the past four years building and operating the most popular static analysis app. We’re excited to bring this to you, and look forward to continuing to bring you the best tools to ship better code, faster. If you want to try out the new Code Climate, download our CLI to get started.