Company Updates

We’re proud to announce that as of August 31, 2020, Code Climate has reinforced its commitment to your security by becoming SOC 2 Type 1 compliant. Along with our existing security protocols, this new certification is representative of our ongoing efforts to ensure the safety of our customers’ data.
This dedication to security is critical to fulfilling our mission and empowering engineering organizations to achieve excellence with data-driven insights.
What is SOC 2 Compliance?
SOC 2, or Service Organization Controls 2, is an accreditation developed by the American Institute of CPAs (AICPA). To qualify for SOC 2, an organization must demonstrate that it has controls in place to ensure the security, availability, and processing integrity of users’ data. It’s a confirmation of an organization’s commitment to maintaining its customers’ privacy.
Type 1 certification requires the completion of a security audit by an independent, third-party accounting and auditing firm, and indicates that Code Climate currently has processes, procedures, and controls in place to ensure the security of our Engineering Intelligence System and safeguard our customers’ data. It also represents the start of a six-month review period, during which we’ll demonstrate our longterm ability to uphold these procedures, a prerequisite for achieving SOC 2 Type 2 certification.
Why SOC 2?
We value the trust our customers place in us and are committed to maintaining that trust by continually evaluating and improving upon our security protocols. SOC 2 is an opportunity to put those protocols to the test, and to demonstrate our ongoing dedication to data security.
Vendors and partners with compliance requirements are now able to request a copy of Code Climate’s SOC 2 Type 1 report as part of their compliance strategy.
Velocity now features a comprehensive view of developer work-in-progress, performance, and skill development — all in one place.
The information required to lead an engineering team is increasingly scattered.
To answer even simple questions like ‘How is my team performing?’ and ‘Is our current sprint on track?’ an engineering manager may need to check as many as ten different systems — version control, project management, feature flags, DevOps tools, and incident management, to name a few. Even so, this fragmented means of information seeking often doesn’t provide a clear answer.
What’s more, a lack of visibility upstream can lead to significant negative effects downstream, like:
- Broken sprints and missed milestones
- Burnt-out developers and high employee turnover
- Inability to actively manage developer performance and achieve excellence as a team
We believe that in order to create a culture that both motivates engineers and improves their ability to drive innovation, managers need a comprehensive picture of where their team members are succeeding and where they can improve.
Our mission at Code Climate is to empower leaders with tools to drive high-performance. Today, as the next step in this mission, we’re launching Velocity’s newest feature, Developer360, to enable managers to build elite organizations with data-driven insights.
Support engineering excellence with a comprehensive view of developer work, performance, and skills — all in one place.
What’s Developer360?
In order to empower their team to achieve excellence, every manager needs a quick way of knowing:
- What are engineers on my team working on? Is anyone stuck right now?
- How are junior team members developing their foundational skills? What challenges have they been facing?
- What’s in each developer’s technical toolbox? Are there any language gaps on my team?
Developer360 gives you instant visibility into your developer’s active work, improvements along key metrics, and skills.
Identify High-Risk Pull Requests
Frontline managers typically rely on stand-ups to check in on work-in-progress. But despite great intentions, even the best engineering teams don’t always bring up issues early.
The Snapshot report brings potential WIP issues to your attention before they derail one of your sprints.
The all-new Velocity Feed (far right) provides a chronological visualization of all an engineer’s recent work, including commits, requested changes, and opened or closed PRs.
With a scan of this report, you can start each day already aware of what’s been taking up a developer’s attention as well as what challenges they’ve been facing.
Scope the Opportunity for Improvement
The more time engineering managers spend providing engineers with proper guidance, the more they’re investing in their team’s future.
The Foundations tab is a source of quantitative data managers can bring to coaching sessions. At a glance, a manager can see each contributor’s average over a given time period, how they’ve trended over that period, and their percentile performance.
Dig into a capacity metric like Impact, which measures the magnitude of changes to the codebase over a period of time. This metric can help you uncover high performers who may deserve recognition, or serve as an early warning sign that this team member may be in need of some coaching.
Incorporate this data into 1:1s and performance conversations to check your biases, come to a shared understanding of where strengths and weaknesses lie, and set quantitative, actionable goals.
Support Your Engineers’ Professional Growth
Part of an engineering manager’s job is knowing what coding languages each developer has been working in so that they can distribute upcoming work, track migrations, and support professional development.
The Skills tab provides a visual summary of a developer’s technical toolbox, so that managers can come to planning and coaching sessions already aware of what skills each engineer has mastered (and what they’re still learning).
Get a sense of an engineer’s language gaps, and work with them to improve their expertise.
Data-Driven Coaching for High-Performance Teams
Engineering is only as strong as its contributors, and as such, building a culture of excellence starts on the individual level. Establishing a complete and shared understanding of how contributors are performing on a micro level will allow you to level-up the way your team is working on a macro level.
When developers are empowered to perform at their best, the entire organization benefits:
- Product is happy when changes can be deployed at a predictable pace.
- Sales can more effectively drive revenue with new features to show prospects.
- Stakeholders see value delivered to customers more frequently.
We’re excited to build on top of Developer360 in our mission to provide engineering leaders with the visibility required to level up their teams. This is just the start of our undertaking to establish Velocity as the single source of truth for software engineering.
Sign up for Velocity to drive high-performance on your team with a 360° view into developer work.
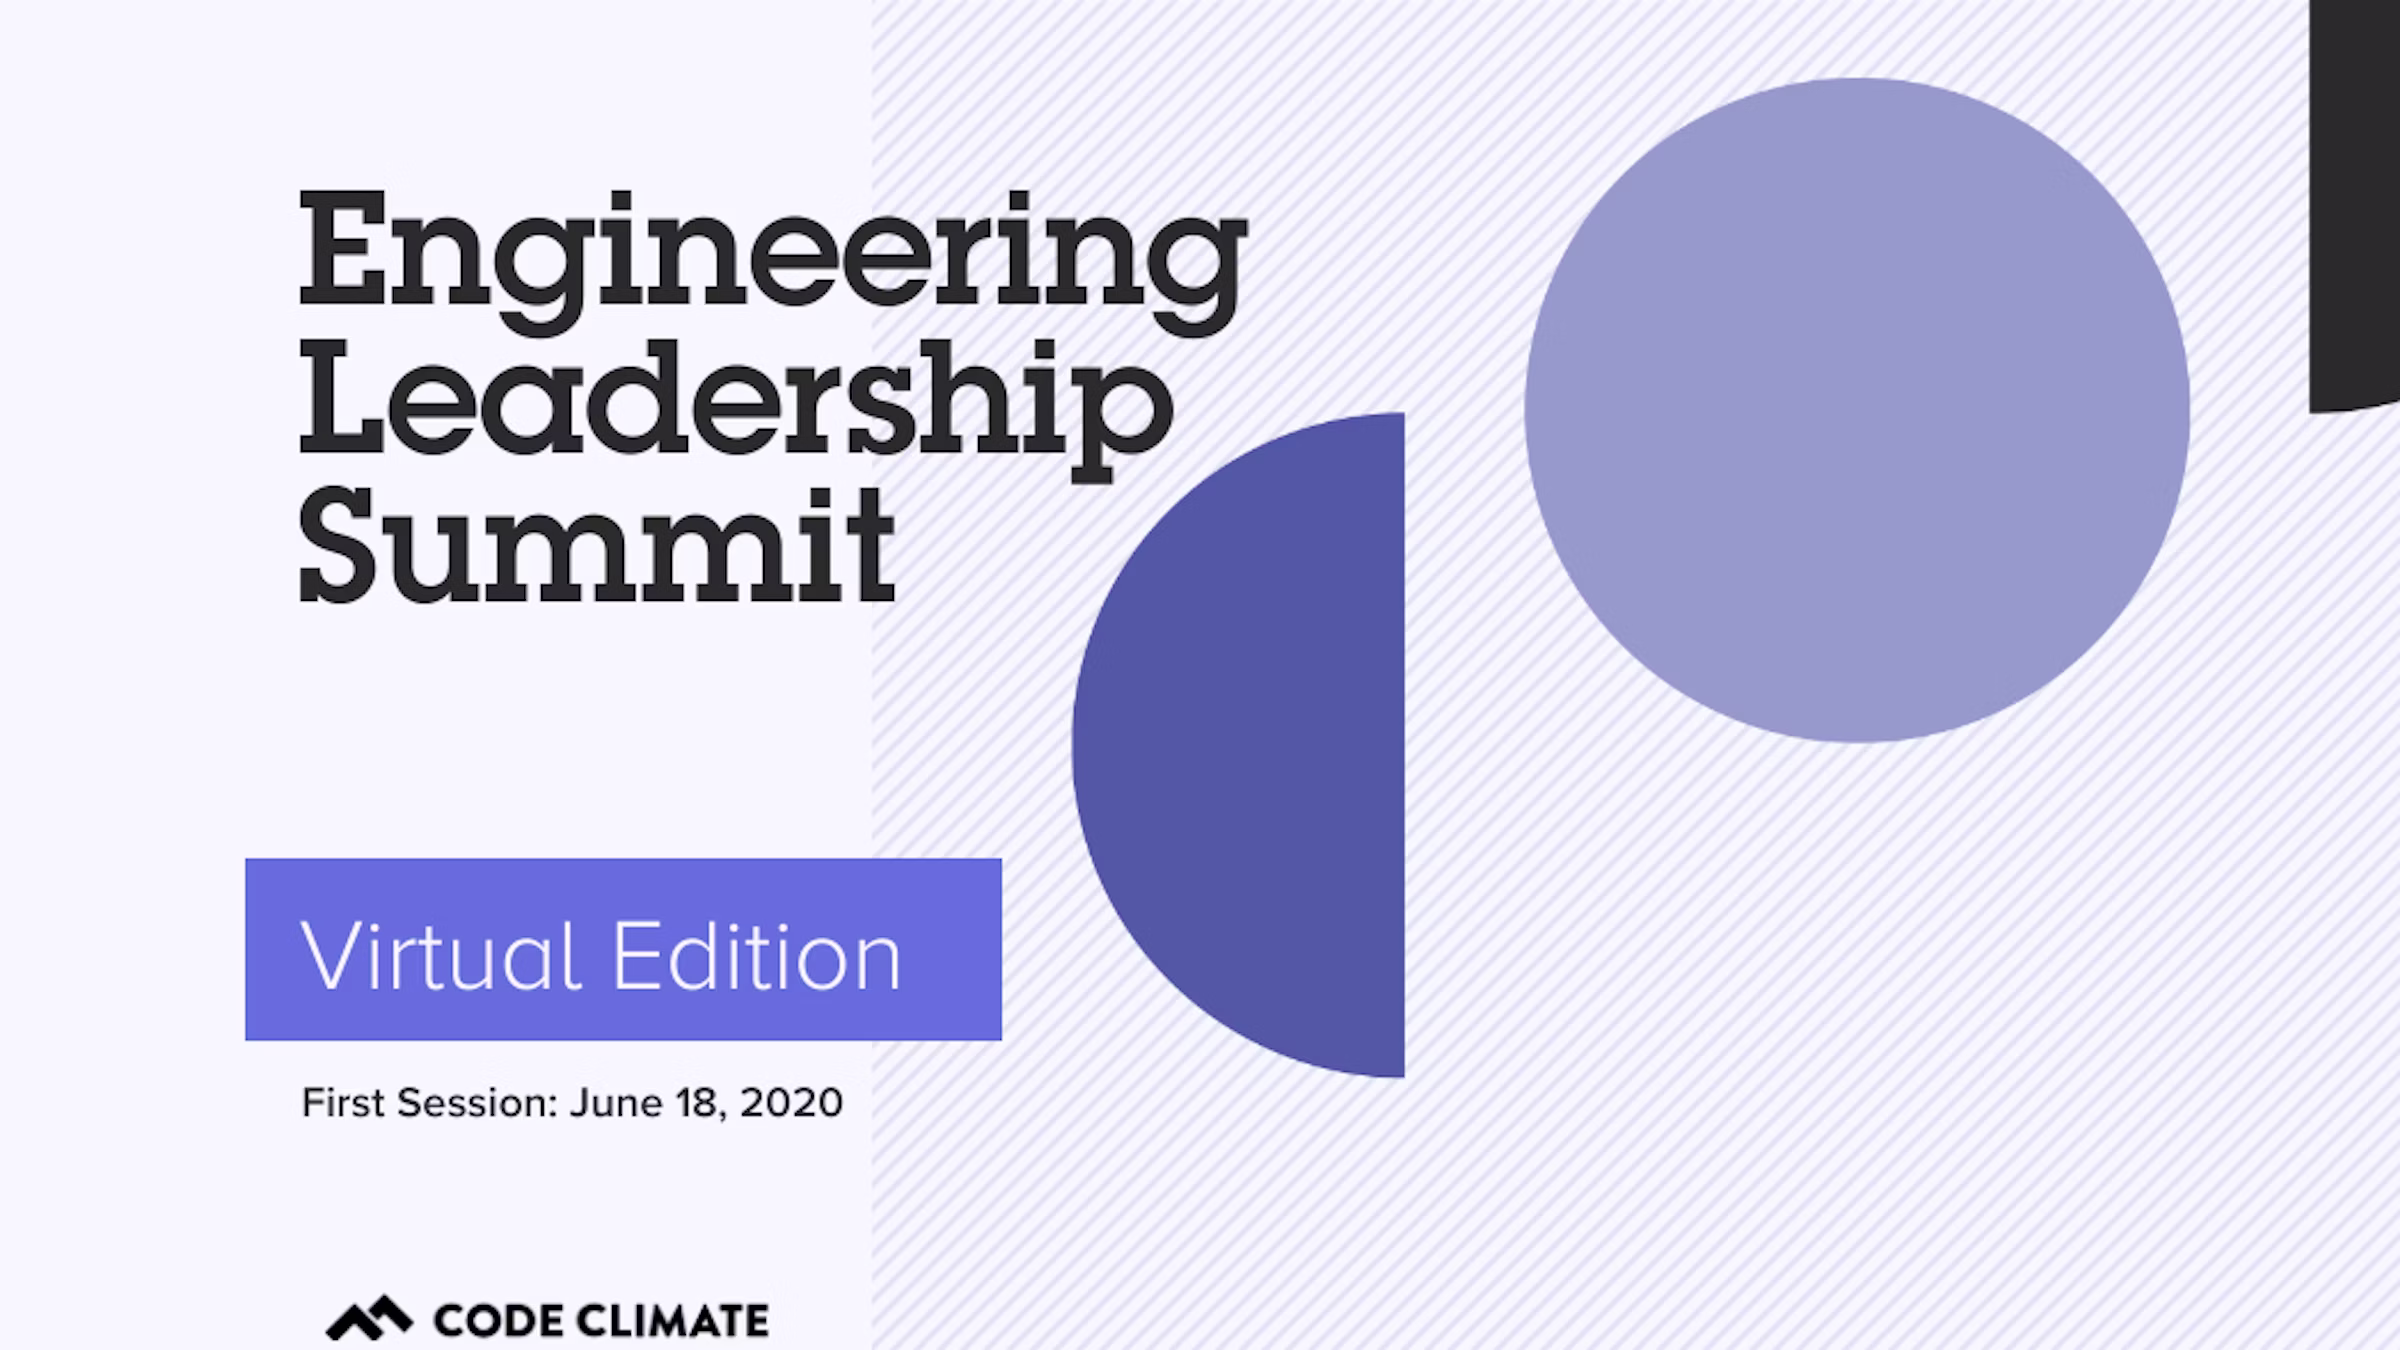
In light of current global circumstances, our annual one-day conference for engineering leaders is going virtual, with a new, more interactive format. Over the course of six weeks, we’ll be hosting a series of remote fireside chats with senior engineering leaders from a range of industries. Each session will be followed by a Q&A with our guest, as well as a topical discussion moderated by our sponsor, LaunchDarkly.
The series kicks off on June 18th with our first session. From there, we’ll present a new chat every week, featuring leaders from Buffer, Netflix, Stripe, and more. Conversations will focus on ways to succeed in senior leadership by driving high performance in your organization. Topics include driving continuous improvement, upleveling managers with data, fostering a culture of diversity and inclusion, and maintaining engineering tempo at scale.
Follow us on Twitter and LinkedIn to learn more about our featured guests.
The Engineering Leadership Summit: Virtual Edition is sponsored by LaunchDarkly, the feature management platform developers and operations teams use to eliminate risk from their software development cycles.
As the COVID-19 (coronavirus) outbreak has evolved rapidly, we want to take a moment to share updates with our customers about the precautions we’re taking to keep our services up and running, while ensuring the safety of our team.
Our leadership team is carefully monitoring and assessing the situation and we do not foresee a major impact to the delivery of our services due to COVID-19. We’re following the advice of the World Health Organization, the Centers for Disease Control, and other local authorities to be prepared to mitigate any potential disruptions to our business if necessary.
Our team
First and foremost, the safety and health of all Code Climate employees and the broader community is something we take very seriously. To that end, we have been taking proactive measures to help reduce the spread of the virus by following the advice of medical experts and the authorities:
- Remote work – Our team has been telecommuting since March 10th and this policy will continue until at least April 20th. We’re ensuring that all employees have the tools and equipment to perform their responsibilities securely from home.
- Travel – We’ve restricted all domestic and international business travel except for trips that are strictly necessary.
Our customers
We have plans and processes in place to ensure we can maintain business functions and our services are available.
- Security and reliability – Our systems were designed and built with disaster recovery in mind. Our infrastructure and data are spread across three AWS availability zones. In addition to that, we have automated backup processes for all data stores that contain customer data. Read more about our approach in our Security page. A real-time view of our uptime and availability is tracked on status.codeclimate.com.
- Support – Our team continues to remain available to address all your commercial and support needs. If you have any questions, please feel free to contact info@codeclimate.com.
We will be providing additional updates as the situation evolves. If we can support you or your team in any way, please don’t hesitate to let us know.
Introducing the first open platform for software engineering data
The data necessary to understand the entire software delivery process is increasingly fragmented. To ship a single feature, a team may take advantage of 10+ tools, from project management, to version control, CI/CD, feature flags and more.
At Code Climate, we’ve learned that combining data from different sources enables higher-level insights. For example, PagerDuty can tell you how often your developers are getting woken up—but it can’t tell you the impact on innovation. Adding Jira data enables you to understand the delays those incidents have on feature initiatives.
To unlock the full value from these data sources, we need:
- A standard language for understanding DevOps concepts
- A simple way to connect to the wide array of engineering tools
And that’s exactly what we’re excited to be announcing today.
We’re launching the Code Climate Engineering Data Platform with:
- A standard Data Schema, representing 50+ common software development units, like epics, pull requests, builds, incidents and more
- An open Connector specification for integrating with DevOps tools
- A SDK (and scaffolding template) to enable anyone to rapidly build new Connectors
Each Connector requests data from a DevOps tool’s API and outputs a set of records conforming to the data schema. Here’s how it works:
To kick things off, we’re open sourcing Connector reference implementation for PagerDuty, CircleCI and Codecov, all written in Node.js.
We believe that the future of DevOps data is open, and today, we’re taking the first step towards making this vision a reality.
The Code Climate Community
We created the first extensible ecosystem for code quality four years ago. There are now 50+ static analysis and test coverage tools available, developed by thousands of community contributors, benefiting millions of engineers. Companies like GitLab have used it as the foundation for their code quality solutions.
With the new Engineering Data Platform, we’re helping the broader software development community build the first open standards for all engineering and DevOps data. We’d love your feedback or contributions on everything we are announcing today (it’s all in draft form!).
Here’s how you can get involved:
- Explore our Data Schema and Specification docs on GitHub
- Join the conversation on Slack with hundreds of community contributors
- Subscribe to our Developer Program mailing list to stay up-to-date
We look forward to building the next generation of Velocity and Quality features using this new, open standard. We’re also excited to see how others will take advantage of the Code Climate Engineering Data Platform to build products and tools we haven’t even thought of yet.
“I tried everything in the industry: planning vs. execution, burndown charts, story points, time estimation. Finally, this product opened my mind. ” –Boaz Katz, CTO at Bizzabo
When welaunched Velocityabout a year ago, we were driven by our theory that the happiest engineers work on the most productive teams and vice versa. Our analytics tool gave managers an understanding of engineering speed and exactly when slowdowns occur.
After getting the product into the hands of thousands of early users, we were thrilled to discover that customers wanted ways to apply their new insights. They had the visibility to see when something went wrong, but not yet the diagnostic tools to determine the best remedy.
We also uncovered a wide range of priorities and needs across engineering teams. Data that was insightful to a large team was less valuable to a small team. Metrics that revealed coaching opportunities to managers of engineers were less useful to managers of managers. We knew early on that we had to build flexibility into the heart of Velocity.
One year and hundreds of meaningful conversations later, we’ve completely revamped the product.
Today, we’re proud to introduce Velocity 2.0, the most powerful Engineering Intelligence platform ever built.The all-new platform empowers any development team to eliminate bottlenecks and make lasting improvements to their team’s productivity.
Here’s how it works.
Actionability with deeper insights and concrete goals
Velocity 2.0 gives users the ability to drill down to the individual unit of work or habit that makes up a trend. This enables engineering teams to understand the underlying drivers of their productivity, so they can work together to improve the speed of innovation and the quality of software delivered.
With Velocity 2.0, engineering leaders can empower the entire engineering organization to participate in a culture of continuous improvement:
- Engineering Executivescan gauge engineering speed over months or quarters but also slice and dice that same data however they’d like. They can see ROI across various initiatives such as restructuring teams or investing in new technologies.
- Engineering Managershave the visibility to see slowdowns and drill down into precisely why engineers are stuck. This helps them keep current sprints on track, and work with engineers to create optimizations that prevent future bottlenecks.
- Individual Developerswill now have concrete success metrics to track their individual and team progress. This allows them to grow as engineers while supporting team and org objectives.
After engineering teams uncover opportunities for improvement, they can quickly translate them to action by setting measurable Targets within the application. They can then visualize and track progress to hit all their continuous improvement goals.
The industry’s first Targets feature lets you and each team member check in on your goal and how much progress you’ve made as a team.
Flexibility for teams to track what matters most
No two engineering teams are alike.
Some teams are heads-down, trying to ship as many features a possible before a target date, while others are trying to buckle down and prepare for scale. All-remote engineering teams require more communication and check-ins than teams in open offices. Velocity 2.0 is the only engineering analytics platform flexible enough to accommodate any software engineering team.
While Velocity 2.0 works right out of the box, it’s fully configurable. Users have the power to turn on and off whatever reports they care about and set their own definitions of success. Teams can customize:
- Metrics:Any metrics that aren’t currently a focus for your team, you can simply turn off. If your team prefers to not measure activity metrics, like commits or pushes, turn those off to focus more on metrics that represent value delivered, like pull requests merged or deploy volume.
- Algorithms:Build your own health checks based on the metrics you care about most. If “healthy” means a team that pushes small commits, gets through the review process quickly and deploys weekly, then Velocity 2.0 will adjust alerts based on those parameters.
- Thresholds:Mark anything you consider a red flag for the org, a team or an individual, and Velocity will highlight anything that might merit your attention, such as a large pull request, an overburdened developer, or a troublesome code review.
- Reports and Dashboards:Ask any questions that aren’t answered out of the box within the Reports Builder, then save within your own custom designed dashboards.
- Permissions:Some teams prefer to keep reports on a need-to-know basis only, based on role or user. This is particularly useful in cases where new team members are still working on their engineering chops. Set limited permissions so only you and the team member knows how a metric is trending.
Velocity 2.0 allows you to gauge success by your own organization’s definition, not our’s.
The new completely programmable Health Check report enables you to see at a glance how your team is doing this iteration compared to the previous three.
The future of engineering analytics
Velocity 2.0 is just the next step on our mission to create a more data-driven engineering world. With more visibility and the tools to take action, every software engineering team can boost their speed innovation, which, in turn, allows us as an industry, to overcome some of our biggest challenges, faster.
We’re incredibly grateful to our early users whose feedback was integral to the development of Velocity 2.0. Here’s what some of them had to say about it:
“Velocity’s Reports Builder has helped our team gain new insights into any potential bottlenecks in our sprints allowing us to definitively track our team progress, accelerate code reviews, pull data to match insights in retros and one-on-ones, and ultimately ship value to our customers significantly faster.” – Jacob Boudreau, CTO at Stord
“Thanks to Velocity, we’ve been able to actually get to a point where we’re doing atomic commits, everyone is committing more frequently, and reviews are easier.” – Chelsea Worrel, Software Engineer at Tangoe
“I’ve never seen anything quite like Velocity.” –Josh Castagno, Engineering Manager at Springbuk
Velocity 2.0 is most powerful when you can see it with your own data. Request a demo here.
Thousands of happy customers validated our software– but dogfooding Velocity validated our values.
A couple of years ago, our engineering leaders were anecdote-driven, like just about everyone else in the industry. We knew how much progress an engineer had made on a new feature because we asked. We knew why we missed a deadline for launching a new feature because we discussed it in our retros.
But we couldn’t answer simple questions like:
- Is our efficiency increasing or decreasing over time?
- What work slows us down and where is the biggest opportunity to improve?
- Which developers on my team are stuck, right now?
Even on a small development team, the insights that we had into our own productivity were limited.
Last year, we launched Velocity, an engineering analytics tool designed to help teams big and small with exactly the issue that we, ourselves, experienced. In the process of iterating and improving the platform, our Engineering Manager, Ale Paredes dogfooded our app. She used each feature from Velocity as soon as it was built and has experienced the benefits ofdata-driven engineeringfirst-hand.
Armed with Velocity, she addressed burnout, improved remote collaboration, and helped restructure the engineering team. The result was an 83% increase in productivity, and a healthier, more engaged dev team.
Here’s what dogfooding Velocity has done for Code Climate.
We Ditched Flat and Near Doubled Our Efficiency
Flat structure doesn’t scale. There comes a point along every engineering team’s growth where the same set up that once built camaraderie and a shared purpose now fuels disengagement and a lack of focus.
Ale first started noticing that disengagement during daily standups. Some people were zoning out; others were on their phones. Almost no discussion was happening. It was 20 minutes of engineers taking turns speaking, one by one. When she brought this up in her 1:1s that week, she found that the team was in unanimous agreement: meetings were inefficient and taking up too much time.
Ale checked her hypothesis against the metrics by looking at Pushes per Day over the last 6 months.
Velocity gave her confirmation that the team’s efficiency had, in fact, been steadily decreasing over the past four months.
Ale took this insight back to the leadership team, and together, they decided it was time to ditch flat. Software development is inherently collaborative, and if engineers have too many co-workers to support, they can’t feel invested in one another’s work.
We decided to break up the ten-person team into groups of three or four engineers. We hypothesized that breaking up teams byBezo’s 2-pizza rulewould help individual engineers focus on less tracks of work. As a result, meetings would suck up less time and be more engaging, as smaller teams only hash out problems relevant to the few people involved.
When Ale implemented this change, the feedback was overwhelmingly positive. Engineers were doing more of what they liked (coding), and less of what they hated (meetings). Over the course of several months, the metrics corroborated what the team was feeling: we started moving much faster.
We went from an average of12 pushes/dayin November to an average of21 pushes/dayin January, an 83% increase.
We Coached Remote Team Members for Better Collaboration
Agile software development relies on strong communication, and, in many cases, frequent face time, so managing team members that are an ocean and three time zones away is nontrivial. It’s hard to perceive frustration through Slack. It’s hard to understand workload through Zoom.
Ale made a concerted effort to check in with remote team members and find out what’s going well and where they might be in need of coaching. But not everyone is an open book– many of her remote team members hesitated to bring up troublesome pull requests or bottlenecks during these meetings.
To find a starting point for these conversation, Ale started looking through a handful of contributor metrics on a weekly basis. She would pay particular attention at overall throughput (# of PRs merged), rework (how often developers work on their own recently merged code), and cycle time (how long it takes code to go from a developer’s laptop to being a merged PR).
By putting together a chart in Velocity, she started noticing a pattern. Remote developers had a significantly higher cycle time than HQ team members.
Before a 1:1 with Legolas Greenleaf, Ale dug deeper into Velocity to see where, exactly, in the PR process contributors were getting stuck.
Ale discovered that Legolas was spending a lot of his time working on code on his laptop before opening up a Pull Request and getting his work looked over.
The next time they sat down, Ale discussed the trend she noticed. The remote team member was able to speak more specifically about what has been slowing him down and what challenges he was facing. In their conversation, she guided Legolas towards learning how he could’ve better approached some of the last few PRs.
Together, they discovered the heart of the problem was that his PRs were too big. Splitting up projects into smaller pieces was a work habit that the HQ team had heard a ton, but the distance between Ale and the remote workers meant they weren’t aligned in terms of best practices. The data brought Ale’s attention to the problem, and gave her something objective to work off for her coaching sessions.
We Prevented Burnout in our Engineers
Meeting deadlines and building great products isn’t the only measure of a good team. We also want engineers to be engaged and not overworked, so that our pace is sustainable. Too often, however, burnout is impossible to sniff out until it’s too late.
Last December, the team was on a tear. We were shipping features every other day, we had redesigned most of the pages in the application, and everyone was stoked about all the cool new stuff we were building. Everything seemed great.
During her weekly check-ins, however, Ale started noticing a trend.
Engineers were excited about their work, but everyone seemed to be feeling a lot of pressure to get features shipped– even though we were ahead of schedule. One senior engineer mentioned that he barely had time for code reviews. Other team members started neglecting pair programming in favor of spending more time getting stuff out the door.
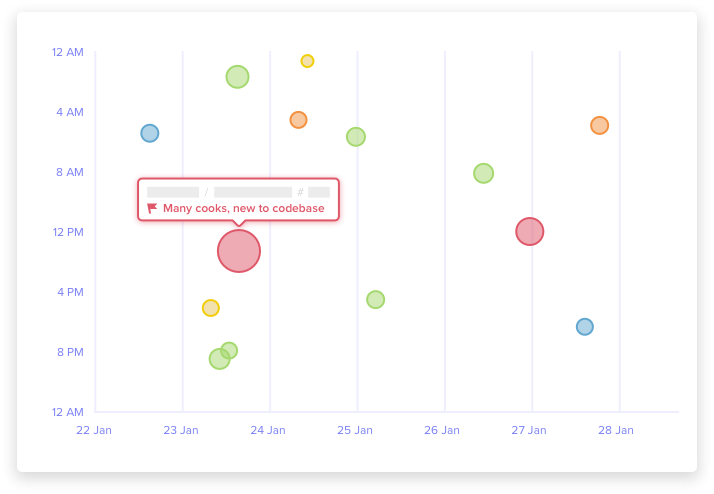
Ale used Velocity to take a look at what the team had on their plate:
She noticed that some developers had so much activity, it barely fit in their row. In a few cases, we were even pushing on weekends, which is highly unusual for our organization.
Looking through all the PRs and reviews the engineering team was churning out, Ale became suspicious that people were working overtime. She put together a report using Velocity’s Reports Builder to see how many pushes were made after 8pm each week:
During the last two weeks, the team had been working late hours more than they had in the previous three months combined. Ale brought this data to the leadership team and was able to successfully advocate scaling back work and giving the engineering team a well-deserved day off.
Now, Ale checks these dashboards regularly and sends out a monthly survey to check in on how work is distributed and how team members are feeling.
Measure and Mobilize
Metrics are not everything. Metrics didn’t help Ale notice that engineers were disengaged during meetings, or that remote team members weren’t voicing problems. Instead, metrics helped helped her check her intuition with more transparency into what’s going on. They also enabled Ale to verify that the changes she made generated an improvement in our productivity.
This gut-check was invaluable in helping us move faster and communicate better, both inside the engineering team and with the organization as a whole.
If you want to learn more on how Velocity can let you see deeper into your team’s work habits (and help you move at least 20% faster), sign up for a demohere.
With new team insights, industry benchmarks, and more
Our mission at Code Climate is to help engineering organizations improve their processes, teams and code. We see a future where everyone from individual developers up to the CTO has access to a full picture of their engineering work in the form of clear, timely and actionable quantitative data.
In February, we opened our Velocity public beta. Over the past five months, we’ve spoken with hundreds of engineering leaders, processed a nearly-overwhelming amount of product feedback, and added dozens of top-requested features.
We’ve been floored by the excitement from engineering leaders:
“If you haven’t tried @codeclimate’s new Velocity product, and you’re interested in non-vanity measurements of productivity, and a baseline from which to measure process improvements, try it now. It’s very exciting.” – Avi Flombaum, Dean and Chief Product Officer, Flatiron School
“Velocity is quickly becoming one of my favorite tools for engineering management.” – Tomas Becklin, VP of Engineering, DroneBase
Today, Velocity is launching out of beta, and we’re ready to help your engineering organization turn on the lights.
Click here to book a Velocity demo today.
Everyone who books a demo before Thursday, July 26th will receive our introductory launch pricing of 20% off for life. This is a one-time offer that we won’t be repeating anytime soon.
Still on the fence? Keep reading.
Most engineering decisions are anecdote-driven
Today, engineering organizations are often forced to make decisions based solely on anecdotes, gut feel and incomplete information. We understand that qualitative information is highly valuable – there’s no substitute for experience and intuition. However,the lack of quantitative data within engineering processes is a missed opportunity, especially given how data has transformed DevOps.
Historically, engineering organizations looking to incorporate data into their processes have faced two problems.
First, unless they’re working within a behemoth like Google, there simply aren’t enough developer resources to spare to invest in such efforts. This is the problem of “The Cobbler’s children having no shoes,” as analytics has transformed so many departments like sales, marketing, and finance.
Second, even if metrics were available, they would be hard to interpret. After all, if someone told you that your team averages 1.9 review cycles per pull request, is that the best as you could reasonably aim for or an opportunity for improvement?
Get data-driven with Velocity
Velocity helps you unlock the full potential of your engineering organization with data-driven insights to manage risks, eliminate bottlenecks, and drive continuous improvement.
It’s built on one simple notion:The happiest developers work on the most productive teams, and vice versa.Applying these practices, which we call Data-Driven Engineering, puts you in the position to achieve both.
Velocity gives you:
- Custom dashboards and trends– engineering metrics with full historical trends
- Team insights– actionable data to level up your engineering teams
- Industry benchmarks– high impact opportunities for improvement by comparing your metrics against other engineering teams
- Real-time risk alerts– identify and resolve risks before they become problems.
As a software company ourselves, we’re committed to improving the process of engineering, for everyone involved: developers, product managers, executives, and more. Velocity is a core part of our foundation to pursue this goal. If you’re excited about this prospect as well, check out Velocity today:
Click here to book a Velocity demo today.
It takes 10 minutes to set up by connecting to your GitHub (or GitHub Enterprise) account, and soon you’ll have dozens of reports (with full historical data) to easily identify risks and opportunities.
Onward, to a data-driven future!
-Bryan, Noah and the entire Code Climate team
Data-driven insights to boost your engineering capacity
Today we’re sharing something big: Code Climate Velocity, our first new product since 2011, is launching in open beta.
Velocity helps organizations increase their engineering capacity by identifying bottlenecks, improving day-to-day developer experience, and coaching teams with data-driven insights, not just anecdotes.
Velocity helps you answer questions like:
- Which pull requests are high risk and why? (Find out right away, not days later.)
- How does my team’s KPIs compare to industry averages? Where’s our biggest opportunity to improve?
- Are our engineering process changes making a difference? (Looking at both quantity and quality of output.)
- Where do our developers get held up? Do they spend more time waiting on code review or CI results?
Why launch a new product?
Velocity goes hand-in-hand with our code quality product to help us deliver on our ultimate mission: Superpowers for Engineering Teams. One of our early users noted:
““With Velocity, I’m able to take engineering conversations that previously hinged on gut feel and enrich them with concrete and quantifiable evidence. Now, when decisions are made, we can track their impact on the team based on agreed upon metrics.” – Andrew Fader, VP Engineering, Publicis
Get started today
We’d love to help you level up your engineering organization. Request a demo here.