Company Updates

Code Climate, the enterprise-level Software Engineering Intelligence (SEI) solution, today welcomes Kathleen Rohrecker as Senior Vice President of Marketing.
Rohrecker is a marketing executive with a strong track record of increasing the value of growth-stage technology companies. Prior to joining Code Climate, Rohrecker was Senior Vice President of Marketing at application intelligence and automation provider NS1. Under her leadership, NS1’s brand valuation increased by over $300M. Prior to her tenure at NS1, Rohrecker served as CMO for Maxymizer and Revolution Analytics, positioning those companies for acquisition by Oracle and Microsoft respectively.
“Kathleen has a history of scaling the value, audience, and customer base of every company she works for,” says Bryan Helmkamp, Founder and CEO of Code Climate. “Our Software Engineering Intelligence platform has the power to transform the daily lives of software engineering leaders. We’re fortunate to have a communications leader with Kathleen’s talent and vision to help us tell that story.”
Rohrecker’s data-driven approach to marketing strategy is a natural fit for the data insights startup. As Senior Director of North American Marketing for Oracle, Rohrecker developed a financial model to measure the relative contribution and conversion metrics for all inbound, outbound, and pipeline acceleration marketing programs, supporting nearly 300 sellers. At Revolution Analytics, her go-to-market strategy for big data analytics solutions led to a 500% increase in average contract values in 18 months.
“Throughout my career, I’ve been privileged to help technology companies reach their full market potential, and I’m keenly aware of the power of data-driven insights to accelerate business outcomes,” says Rohrecker. “I look forward to elevating Code Climate among the engineering and business leaders who need it most.”
Rohrecker resides in the greater New York City Area. She holds an MBA from Hofstra University and a Bachelor’s degree in Economics from William & Mary.
Code Climate, the enterprise-level Software Engineering Intelligence solution, today announces that Marcy Campbell, Chief Revenue Officer for Boomi, has been appointed to the Code Climate Board of Directors.
Campbell brings over 30 years of experience leading large-scale, go-to-market organizations for global companies ranging from Fortune 500 to venture-backed technology firms. Prior to recently joining Boomi, the intelligent connectivity and automation leader, she served as senior vice president at PayPal where she led global sales, professional services, and operations.
“Marcy has an incredible record of helping software providers grow from early startup stages into global operations, and she’s been a strong advocate for data-driven decision-making in organizational leadership,” says Bryan Helmkamp, co-founder and CEO of Code Climate. “Having known Marcy for over 15-years, I’m thrilled to add her expertise in DevOps and go-to-market strategy to our Board of Directors.”
“Having worked with many of the largest companies in the world, as well as cutting-edge brands, I have an experimental nature — I’m attracted to opportunities to work with companies that have a compelling vision and help them massively scale,” says Campbell. “I am honored to join Code Climate’s board and to support their mission of bringing transparency to software engineering.”
As CRO of Boomi, Campbell spearheads the category-leading, global software as a service (SaaS) company’s revenue-generating strategies with a focus on driving fast growth, while continuing to deliver value to its more than 20,000 customers globally. She also serves on the Board of Directors for marketing analytics company NextRoll, a machine learning marketing platform, and on the Board of Advisors for the Asian University for Women, as well as acts as a mentor for the Cherie Blair Foundation.
Campbell has been recognized as a Silicon Valley Business Journal Woman of Influence, a Top 100 Global Sales Leader by The Modern Sale, and as one of the Most Influential Women in Payments by PaymentsSource.com. She resides in the San Francisco Bay area, holds a degree from the University of Hartford, was a National Regent Scholar and most recently a Member of the Board of Regents.
Ensuring that working at Code Climate is a rewarding experience is something we take really seriously, so we’re incredibly honored to be recognized in the Built In 2022 Best Places to Work in NYC Awards. Just announced last week, Code Climate earned a spot on the 50 Best Small Companies to Work for in NYC.
This year’s Best Places to Work Awards highlight employers that have created cultures supporting employees wherever they work. Award eligibility is based on a company’s compensation benefits and culture programs, including diversity, equity, and inclusion.
“This year saw a record number of entrants — and the past two years fundamentally changed what tech professionals want from work,” says Sheridan Orr, Chief Marketing Officer, Built In, in a press release. “These honorees have risen to the challenge, evolving to deliver employee experiences that provide the meaning and purpose today’s tech professionals seek.”
Don’t just take Built In’s word for it though. Here’s what a few of our team members have to say about why they like working at Code Climate.
Emily Fueger, Senior Support Specialist: “Code Climate has done a great job prioritizing active team communication and empathy for what’s happening in the world around us today. I’ve often caught myself saying, ‘Wow, we are so lucky.’ Remote-first policies for meetings and generous leave for testing and time off aren’t just empty words. They reflect our default culture with respect for the people that work here. The culture is incredibly vibrant at Code Climate. The people I work with are incredibly curious, smart, funny, and talented (lots of musicians, DJ’s, and crafters). They’re people that I’d want to know even if I didn’t work with them.”
Josh Bender, SMB Account Executive: “Working at Code Climate is an amazing experience because everyone is working daily to grow the company. We all have a vision of educating the world on Engineering Intelligence and improving the efficiency of software development teams. It’s a rewarding pursuit, and I am excited to see this growth continue!”
Sherianne Bolling, Sr. Corporate Account Executive: “At Code Climate you’re surrounded by colleagues that are both driven and forward-thinking. We have a strong collaborative culture that encourages diversity of thought. I love being able to have my voice heard while contributing to an innovative and fast-moving company.”
Glenn Rothwell, Director of Sales Development: “I love working at Code Climate because of the culture, which I would describe as autonomy with accountability. I have the freedom to experiment and try new things with my team, and I appreciate how data-driven we are when assessing the results. Also, the various departments — such as sales, marketing, and product — work together very closely and are not siloed like I’ve experienced at other companies. Top this off with how genuinely enthusiastic the team is about our product and company direction, and you have a great recipe for success.”
Code Climate has been on a tear the past year, after closing a $50 million Series C round of funding, more than doubling our revenue, and significantly growing our team across the board. In many ways, this is just the start as we continue to aggressively recruit top talent to join our awesome team.
With this team growth as backdrop, our CEO, Bryan Helmkamp, has expressed a deep commitment to investing in the people and culture we need to fuel the next generation of Engineering Intelligence.
Learn more about our company culture, and check out the 30-plus open positions we have today.
We’re introducing a new look for our Velocity navigation! The platform is growing, and we’ve redesigned the navigation to make it even easier to use Velocity to find the answers you’re looking for.
Things look a bit different, but don’t worry, all your favorite reports are still there (plus more!) — they’re just organized in a new way, around what you’re trying to use Velocity for.
Velocity’s all-new navigation now lives at the top of the page, organized into the following three categories:
Align — Create transparency that ensures your technical teams are in sync with product and business initiatives. Here you can find reports aimed at helping executives align on business priorities and ensure optimal resource allocation across teams.
You’ll be able to understand how your team’s productivity changes over time and visualize key metrics to uncover trends.
Deliver — Innovate faster than your competition by bringing new products and features to market, faster. These reports are designed to help engineering leadership deliver high-quality code quickly and consistently.
You can easily see what your team is working on (such as what pull requests have been recently edited) and understand how Code Review and PR Resolution are impacting your team’s delivery time.
Improve — Build a culture of excellence through objective metrics. Here you can find reports designed to help leadership and team managers improve team processes and skills to create a high-performance culture.
You can track how your team is progressing towards their goals and performing over time to help identify the best practices that make sense in your organization.
This is a fresh take on the same insightful Velocity reports you’ve been using. We’ll be rolling this out to all of our users by the end of January. Please reach out to support if you have any questions!
Velocity Navigation is Just the Latest in a String of New Product Features for 2022
The new Velocity navigation is the latest of several new product features. We kicked off 2022 with three other highly-requested features: pair programming support, draft PR support, and updated email and Slack PR links. Read more about these new features in our blog announcement, or here’s a quick summary:
Pair Programming – Those engineering teams, including ours, that use pair programming sessions to help increase efficiency, minimize errors, and engender a culture of collaboration and knowledge-sharing on their teams, can now find co-authorship data included in key metrics and reports.
Draft PRs – Draft PR support allows developers to push their work without unintentionally signaling to a manager that the PR is ready to be formally reviewed and/or shipped. Organizations can now customize when Velocity considers a PR to be Ready for Review.
PR Links – The PR links in Velocity’s e-mail and Slack alerts now route directly to your VCS, rather than Velocity (as they did before). This way, any user with access to the PR — even those without a Velocity seat — can act on e-mail and Slack alerts.
We’ve got a ton of new and exciting features on tap for 2022. Stay tuned for more updates that help maximize the data-driven insights you get from Velocity’s Engineering Intelligence.
On behalf of the Code Climate team — Happy New Year! We’re excited to kick off 2022 by announcing three brand new and highly-requested features:
- Pair programming support
- Draft PR support
- Updated e-mail and Slack PR links
Pair Programming Support
Many engineering teams, including ours, use pair programming sessions to help increase efficiency and minimize errors, all while engendering a culture of collaboration and knowledge-sharing on their teams.
Pairing creates an opportunity for more junior members of the team to ask questions like, “Why do we do this like that?”, or for more senior programmers to describe different implementation approaches they’ve tried and how they’ve worked out in the past. These discussions help close the experience gap and often lead to a new consensus about the preferred way of doing things.
To this end, we’re excited to announce that one of our most highly requested Velocity features — pair programming support — is now live!
What Does Pair Programming Support Look Like in Velocity?
Pair programming support manifests in three main ways in the platform.
First of all, every metric in the application that takes commit activity into account will now reflect pair programming data. For example, if Hermione (author) and Snape (co-author) write 302 lines of code in a pairing session, both of their PR size metrics will reflect this change. Previously, only Hermione’s PR size metric would be affected.
Secondly, co-authorship is now accounted for in the Team and Developer360 Activity tabs. Before, a purple commit bubble would only show up on Hermione’s line (if she was the author) and not on Snape’s (the co-author), even if they had been coding together. Now, the commit bubbles will show up on both axes of activity. It’s important to note that once the PR is opened, however, only the author’s PR metrics will be affected by future changes.
Finally, for all Velocity customers with integrated Jira instances, pair programming data will display in the Workstreams report when users hover over any commit activity that was co-authored (see below).
Note: If you’re an existing Velocity customer who onboarded before November 2020, your rep will reach out within the next few weeks to let you know when this feature is available.
Draft PR Support
Draft PRs make it possible for a developer to push his or her work as soon as possible, without unintentionally signaling to a manager that their work is ready to be formally reviewed and/or shipped.
Ever since GitHub launched this functionality in early 2019, Draft PRs have become an integral part of many engineering organizations’ workflows and a highly-requested Velocity feature.
What Does Draft PR Support Look Like in Velocity?
Organizations can now customize when a PR should be considered Ready for Review. There are three options:
- When a Pull Request Review is first requested
- When a Pull Request is created
- When a Pull Request is no longer marked as a draft
Once you’ve configured what your organization defines as ‘Ready for Review,’ all relevant Velocity metrics (Time to First Review, Review Speed, Time to Merge) will reflect this change.
You can also start the clock for the Waiting for Review risk alert by heading toSettings > Data > PR Risks and selecting your preference from the same dropdown menu.
We hope this new functionality will make it possible for developers to adhere to CI/CD best practices without pinging their teammates prematurely.
Note: Draft PR functionality is only available for GitHub users.
Updated E-mail and Slack PR Links
Finally, we’ve updated the PR link settings in our e-mail and Slack alerts to route directly to your VCS and not to Velocity (as they did before).
This way, any user with access to the PR — even those without a Velocity seat — can act upon e-mail and Slack alerts.
Get Started
Velocity’s come a long way in a year, and we’re looking forward to delivering many more highly-requested features in 2022.
In the meantime, users can configure their Pair Programming and Draft PR Settings at the respective links, and as always, reach out to our support team if you have any questions.

We are excited to share news today that we have two new tech industry experts joining our executive leadership team. This continues the incredible momentum we’ve experienced this year after closing our Series C round of funding in August, more than doubling our revenue, and significantly growing our team across the board.
Check out the full details in the Press Release:
Following Series C funding, this expansion of a highly accomplished group of leaders underpins a period of transformative growth.
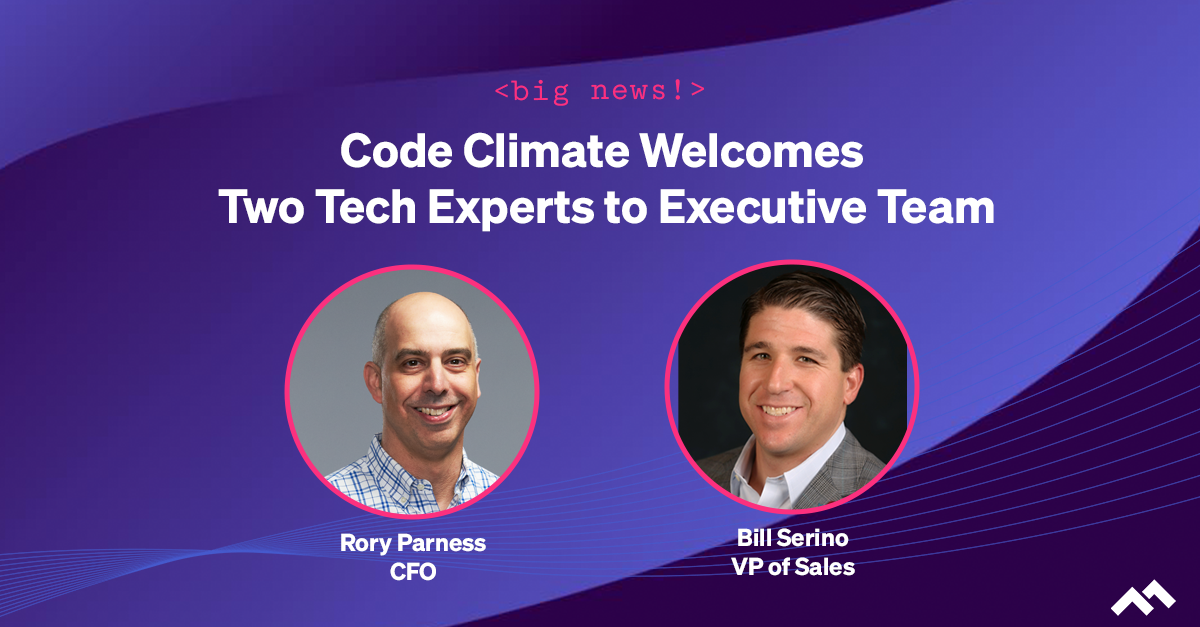
Code Climate, the leader in Engineering Intelligence, today announced two key strategic hires, naming Rory Parness as CFO and Bill Serino as VP of Sales. These tech industry veterans join Code Climate as the company gains momentum on the heels of a successful Series C round of funding closed in August.
Parness and Serino are the latest additions to a seasoned executive leadership team brought on in 2021. Code Climate has experienced significant expansion over the past year, with revenue up more than 100 percent and headcount nearly doubling.
Parness joins Code Climate from Foursquare, where he served as CFO, leading the finance and operations teams for nearly a decade. Prior to Foursquare, he was the CFO of several companies in the technology, healthcare, and music industries. Over his 30-year career, Parness has helped scale companies to over $500 million in revenue and orchestrate a multi-billion dollar exit. He has also served as an advisor for several tech startups.
Serino brings a wealth of leadership experience to the Code Climate team, most recently from Harbr Data, an enterprise data exchange platform, where he was Global Head of Sales. Serino has extensive experience driving sales growth in multiple verticals in the Fortune 500, having held strategic sales roles at EMC and Oracle, and helping lead a successful IPO for Pivotal Software.
“As we continue to scale rapidly for a phenomenal period of growth, I’m super excited to welcome Rory and Bill as the latest members of our leadership team,” says Bryan Helmkamp, Code Climate co-founder and CEO. “The enterprise-grade level of experience that they each bring to Code Climate will help propel us to the next level and strengthen our position as the leading Engineering Intelligence company.”
This hypergrowth comes at a time when business and technology leaders must align on a more data-driven approach to decision making. Code Climate is deeply committed to investing in passionate people and innovative solutions to further its mission to build trust with transparency and fuel the next generation of software engineering excellence.
Both Engineering Managers (EMs) and Tech Leads play an integral role in an engineering organization’s health, ensuring that ICs are working together productively and effectively to deliver software on time. With so many moving parts in the development pipeline, it can be hard for an EM to prioritize and determine where they’re needed the most. This challenge is compounded by the fact that data on their team’s progress is spread across disparate sources, and developers may be reluctant to surface issues or ask for help early enough to avoid blockages that derail sprints.
Enter Workstreams, a powerful new enhancement to Velocity that streamlines all the info EMs need to help them prepare for the day ahead.Empowering them to be more proactive leaders and fostering confidence in their strategies through reliable metrics, Workstreams helps EMs quickly assess their team’s progress and identify what items need attention first.
Phase 1: Spot Risks Immediately
Workstreams is an interactive dashboard that uses rich visualizations to help EMs quickly gain visibility into a project’s pipeline, highlighting the most at-risk units of work for easy prioritization. Workstreams answers the following questions:
- What work is at risk?
- Workstreams surfaces code and project risks, allowing EMs to immediately see what areas of work require prompt attention. Details pertaining to each PR are delineated in the Issue column, with each team member assigned their own unique avatar. This visual representation of work distribution makes it easy for an EM to identify which team members are assigned to the Issue and determine whether team members are spread too thin, allowing them to effectively redistribute workload so they can protect against burnout. This also makes it easy for an EM to quickly identify which PR or PRs are triggering the Risk Alerts, drill into the code for more information, and create a follow-up plan with the assigned engineer to address the problem.
- Are any engineers blocked or task switching?
- While a Jira issue may be labeled “In Progress,” this does not always mean the relevant code is actively being worked on. Workstreams provides clarity by placing Jira status in context with coding activity in a Commit timeline. You can see which issues are in progress and review Commit activity right next to them. If there is a gap in activity for several days, it may signify the engineer is stuck, blocked by another story, or is task switching. This helps EMs identify impediments that could potentially derail sprints and see which Issues are affected. This information can be used to open a constructive dialogue with an engineer in a 1 on 1 or during standup.
- What are the largest efforts to the codebase being made this week?
- While Lines of Code may be used to measure the potential effect on a codebase, it’s been proven to be a flawed metric. Updating 50 lines of boilerplate HTML has a much lower impact on the finished project than a 5 line logic change to a core library. Workstreams makes assessing impact easier by using data science to weigh the magnitude of code changes. A proprietary metric, Code Climate’s Impact factors in variables such as the location of edits, the type of code being written (new code vs. updating existing code), and the specific nature of the change (e.g., formatting changes are simpler than logical changes).
An Engineering Manager can use this data to get a sense of the effect of any unit of work. The Activity chart offers a visual representation of code Impact in the form of bubbles — smaller bubbles signify a smaller Impact, while larger bubbles signify a larger Impact. Hovering over a bubble displays the associated Commit, providing EMs with an immediate view of which Commits have the greatest impact on the codebase.
Phase 2: Lead Healthy Standups
An integral part of the Agile process, standups are meant to provide visibility into each team member’s progress and surface any issues that may need course correction. The reality is, they are often unengaging and unfocused, and some team members are hesitant to raise issues in a public forum. Workstreams provides the structure EMs need to keep standups focused and valuable. It is best used in one of three ways:
- Sort by People
- Instead of waiting for a team member to volunteer to speak next, EMs can save time and surface discussion points efficiently by pulling up an alphabetical list of team members on their screen to run standups in that order.
- Sort by Risk
- Standups are short and should prioritize conversations around identifying and mitigating risk. To make the most out of their standups, EMs can sort risks in the Risk column to show PR issues that have triggered a Risk Alert. This helps laser-focus discussion points while prompting team members to share collective knowledge for a successful triage.
- Sort by Effort
- The Effort column illustrates the cumulative impact of all PRs pertaining to an issue. This helps highlight large stories that can potentially affect many parts of the codebase. Sorting by Effort, EMs can review the issues with the greatest strategic impact first, ensure they are progressing as expected, and potentially use them as a coaching opportunity for newer engineers.
With Workstreams, engineering organizations can approach each day with a more complete understanding of the work that matters most to their current goals, and focus their efforts accordingly. It’s a powerful addition to Velocity, an already robust engineering intelligence platform designed to provide engineering leaders with the end-to-end visibility they need to ship code faster, maintain their competitive edge, and foster a culture of engineering excellence.
Led by PSG, the investment is aimed at furthering Code Climate’s mission to help engineering leaders align initiatives with strategic priorities, accelerate software delivery, and drive continuous improvement.
Code Climate, a leading Software Engineering Intelligence (SEI) platform, announced today that it has raised $50M in Series C funding. The round was led by PSG and joined by previous investors Union Square Ventures, Foundry Group, Lerer Hippeau Ventures, and NextView Ventures, bringing Code Climate’s total funding to $66M.
Founded in New York City in 2011, Code Climate’s Engineering Intelligence products are trusted by over 1,000 companies from start-ups to enterprises. Their flagship product, Velocity, empowers companies like Faire, Instacart, and Forbes to improve the efficiency of their engineering and product organizations at scale. By transforming data from DevOps and project management tools like Jira into valuable insights, Velocity reduces cycle time and enables teams to ship software faster.
“We’re excited to partner with PSG and build upon our leadership as a Software Engineering Intelligence platform,” said Bryan Helmkamp, CEO & Co-Founder of Code Climate. “This investment will help us further our vision of helping engineering and business executives align engineering initiatives with business priorities, deliver high quality code quickly and consistently, and improve teams’ processes and skills to create a high performing culture.”
Over the past year, Code Climate has experienced continued strong growth, more than doubled its headcount, and brought on an experienced executive leadership team.
“We think Code Climate is well positioned to capitalize on companies’ growing need to gain visibility into their engineering organizations,” said Rich Zajeski, Vice President at PSG. “We believe Code Climate has built a leading platform and team that can address this market need. The value proposition of Code Climate has enormous potential, helping companies maximize their strategic investments in software engineering to bring innovative products to market faster, more consistently, and more efficiently. We are thrilled to have the opportunity to partner with Bryan and the rest of the Code Climate team in their next phase of growth.”
The funding will help Code Climate advance its product vision, extend its sales reach, and scale customer success – furthering its mission of helping engineering align activities with strategic priorities, deliver high quality software, and improve team performance.
Velocity or GitPrime? Read a head-to-head analysis to decide which is best for your team.
In competitive markets, the viability of a business depends on engineering performance. In their 2020 study of 400+ enterprises across 12 industries, McKinsey concluded that engineering departments performing in the top quartile of the Developer Velocity Index (DVI) “outperform others in the market by four to five times.”
Historically, however, engineering has been a black box. The average company invests millions of dollars a year into the department, but most have no way of assessing the returns.
This is why many market-leading organizations, like Kickstarter, Gusto and VMWare, are starting to adopt Engineering Intelligence to get visibility into their software development workflows. Doing so has enabled them to effectively improve performance, boost Time to Market, and out-innovate competitors.
The two most popular engineering analytics platforms, Velocity and GitPrime (recently acquired by Pluralsight Flow), both offer transparency into engineering performance and process efficiency but differ in their approaches.
To help you make a decision about which approach to engineering metrics works best for your team, we put together a thorough head-to-head comparison of Velocity and GitPrime. Read the post through, or click on a link to skip to the section that’s most important to you.
Setting Up
Coaching
Tracking Progress
Goal Setting
Scope of Visibility
Surfacing Issues
Customization
Cost
Setting Up
Tl;dr: The setup process can be just as fast for both, GitPrime and Velocity, so you can be up and running as soon as your data imports.
First, you’ll want to know the time and effort it takes to get set up, so you can have an accurate expectation of how soon you’ll be up and running. Both analytics tools recognize the friction involved with process changes, so they’ve done their best to streamline this experience.
Velocity
Start setting up Velocity by first signing in with your GitHub or Bitbucket account. Once you’re in, you’ll be prompted to add your repositories, so you can start seeing your engineering data in the app.
GitPrime
GitPrime has a similar setup process. You start by creating a new GitPrime account and then setting up integrations with whichever Git or product management tools you might be using.
GitPrime supports more version control systems than Velocity, and each has a slightly different workflow. You can import repos accessible over HTTPS or SSH from any server, or use OAuth to connect to your GitHub, GitLab, or Bitbucket organization.
From there, you’ll also have to organize your data. You won’t be able to assign repos to applications, but you organize them by tag. Contributors can similarly be hidden from reports, merged or assigned to teams.
Coaching
Tl;dr: Velocity has a more robust set of coaching features than GitPrime. Whereas GitPrime offers a few metrics per developer, Velocity offers a 360 degree view that covers the day-to-day, week-to-week improvement, and long-term development.
A top priority that we often hear from organizations looking to invest in engineering analytics is the need to improve team and individual performance.
Velocity’s 360 reports combine all coaching features in one comprehensive report that provides a complete picture of developers’ and teams’ work habits. GitPrime reduces developer performance to a few key metrics, and offers more prescriptive guidelines.
Velocity
Velocity’s Developer360 report gives managers instant visibility into your developer’s active work, improvements along key metrics, and skills.
The report includes four tabs:
- Snapshot shows what a developer is working on right now and the impact of that work. A manager can leverage this data to spot bottlenecks before they have significant, negative downstream effects.
- Activity provides a visual summary of what an engineer has been working on over the past month. Many managers scan this report to see how an individual’s workload has changed over time and to ensure that work distribution matches their expectations.
- Foundations depict how a member of your team is trending according to every critical Velocity metric. Incorporate this data into 1:1s and/or performance conversations to check your biases, come to a shared understanding of where strengths and weaknesses lie, and set quantitative, actionable goals.
- Skills displayswhat coding languages a developer has been working with. This data can be helpful to glance over before a coaching session, so you can get a sense for an engineer’s language gaps and work with them to improve their expertise.
Velocity’s Developer360 report focuses on objective metrics and does not presume what they may indicate. We recommend Velocity for teams who are looking to avoid reductive metrics.
GitPrime
GitPrime has two main reports for coaching developers:
- The Player Card, which is limited to performance along three key categories: the core metrics included in the Code, Review, and Submit Fundamentals. At a glance, a manager can see a contributor’s percentile performance, a work log of what an engineer has been working on, as well as how collaborative engineers are in the review process. This report can be used to inform 1:1s or quarterly reviews.
- Snapshot, a report which plots contributors on a quadrant, based on their average throughput and churn. This report shows how the contributor compares to other engineers org-wide and offers feedback suggestions, based on where the engineer falls on the graph
GitPrime’s coaching reports are a fit for leaders who desire suggestions towards specific action based on how a given contributor is performing relative to their peers. For those who prefer GitPrime’s more prescriptive approach to coaching, however, we recommend keeping in mind that metrics don’t always paint a full picture.
For example, if you look at PR Throughput on this graph, you’ll see how many changes a given developer has shipped in contrast to his or her team members. But a data point on the top right of the graph doesn’t include the context that many of the deploys were relatively small in impact.
Tracking Progress
Tl;dr: Both tools provide at-a-glance dashboards that let you see trends over weeks, months or quarters. Velocity provides more PR-related metrics and has a real-time view into how you’re doing this sprint. These metrics allow you to evaluate progress across projects, sprints, and cohorts, making it possible to implement high-level process changes that can fundamentally improve the way your team works. GitPrime has more contributor-based metrics, which make it more difficult to help your entire team improve together.
The same insights that previously required hours of digging through repos and countless 1:1s are available at-a-glance in both analytics tools. But each application tracks “progress” slightly differently. Where Velocity makes it easy to track process-level metrics like Push Volume and compare progress across teams and time periods, GitPrime prioritizes reports that track metrics by individual contributor.
Velocity
Velocity has two main features that allow for progress tracking:
- Overview: This is the home dashboard, and it offers a summary of the progress your team has made over time, based on metrics like Impact, PRs Merged, or Push Volume. By pulling these together in one place, the Overview provides an at-a-glance look at the way your team’s progress is trending across a variety of metrics, so you can dig deeper into the ones that are most aligned with your goals.
- Analytics: Every team works differently, which is why the Analytics feature is designed to give you the data you need most. Managers can create customized reports, slicing and dicing 50+ metrics available within the app to understand how various development behaviors have changed over time on an org, team, or individual level.
Velocity makes it easier to do things like identify and learn from your highest-performing teams, or track the success of particular initiatives. For example, you might track new developers’ Deploy Volume to evaluate how they’re progressing with onboarding based on how much of their work is making it into the codebase. And if our standard reports don’t include the insights you need, you can use our customizable Analytics report to dig even deeper into your data.
Velocity’s progress tracking reports are most suitable for managers who interpret metrics as insights about the work, not the person.
GitPrime
GitPrime has its own report for progress tracking:
- Project Timeline: This dashboard is similar to Velocity’s Overview dashboard, reporting work progress over time in terms of Impact, Commit Volume, Impact, and Velocity. The subtle difference is that instead of including a PR-related metrics, like Velocity’s PRs Merged, they look at Velocity, which they measure by number of valuable commits per person.
GitPrime’s Project Timeline report best complements a management style that prioritizes tracking contributor performance over PR- and process-related metrics.
Goal Setting
Tl;dr: Both applications include robust goal-setting features. The approaches differ in the types of goal-setting capabilities provided.
The goal of adopting an Engineering Intelligence tool is to use the greater visibility found in metrics to drive positive change in your organization.
Both Velocity and GitPrime include target-setting reports, but whereas Velocity tracks progress in terms of success rates, GitPrime tracks averages in their goal-setting system.
Since high-performance in engineering is critical to business success, you can use Velocity’s Targets feature to measure, improve, and communicate progress using objective metrics that support departmental initiatives. This report serves as concrete data to inform any OKR or KPI-related conversation, while the ability to drill-down into outliers enables team members to diagnose why targets aren’t met.
Velocity
Within Velocity’s Targets feature, executives, leaders, and front-line managers can build a dashboard of reports that visualize progress toward goals in terms of success rates or averages.
- Targets: Velocity has a first-class, highly structured goal-setting system that goes beyond simple averages, with percentile-based OKR-style goals. To meet this type of goal, a target percent of data points must be above or below an agreed-upon benchmark. For example: Keep 95% of Pull Requests under 250 lines of code.
When setting a goal, many leaders find that tracking averages over time doesn’t properly represent the progress that’s being made toward that goal.
If you’re tracking PR size, for example, a single, long-running PR might obscure the dozens of PRs that moved quickly through the pipeline. If you’re tracking Review Speed, a single neglected review inaccurately suggests inefficiencies in the review process.
Thus, Velocity’s Targets report is tailored to engineering leaders who acknowledge anomalies and believe that it’s acceptable for a few data points to be outside an expected target.
GitPrime
Instead of success rates, GitPrime tracks averages in their goal-setting systems.
- Fundamentals: The core of GitPrime’s product are four fundamental metrics that they assert are signals of productivity: Active Days, Commits per Day, Impact and Efficiency. They offer dashboards that show the 30-day average, industry benchmarks, and custom targets you can set.
GitPrime’s Fundamentals report is most compatible with managers who prefer the more common approach of tracking averages. However, it is important to note that if you have an outlier in your data — maybe one particularly complicated PR required a lot of back and forth in Code Review — that outlier will throw off your average. This can make it difficult to see the overall trend, and inaccurately suggest inefficiencies.
Scope of Visibility
Tl;dr: If you want to evaluate your process from end-to-end, you’re better off going with Velocity, which was built specifically for CD. Conversely, GitPrime was built for coding efficiency with an emphasis on Code Review and doesn’t include data from before a PR is opened and when it is merged.
While most of the industry is actively adopting Continuous Delivery, few have set up any way to measure their progress.
To optimize or adopt CD processes, organizations need a complete, end-to-end picture of their engineering processes. Concrete metrics, such as those found within Velocity and GitPrime, are a prerequisite for ensuring success in this transition.
Velocity
Velocity is the only application in its category to shine a light on the entire software development process. Key metrics you need when measuring CD include: Cycle Time, Deploy Volume, Time to Open, Time to Review, and Time to Merge, the majority of which are not available in GitPrime.
Our objective is to eventually incorporate data from every important tool that an engineer touches.
Teams looking to optimize each part of their software delivery pipeline, not just Code Review, are better off going with Velocity.
GitPrime
GitPrime was originally built to improve coding efficiency and has since built Code Review features as an add-on. This leaves important parts of the software delivery processes obscure–such as what happens before a PR is opened or after it is merged.
Teams focused exclusively on optimizing their Code Review processes will benefit more from the granularity found in GitPrime’s Review Workflow report.
Surfacing Issues
Tl;dr: Velocity, with PR-related metrics at the core of the product, does a better job drawing attention (inside and outside of the app) to actual artifacts of work that could be stuck or problematic. GitPrime, with mostly people-focused metrics, draws attention to contributors who could be stuck or problematic.
Engineering is expected to continuously deliver business value to your organization, but a single bottleneck can hold up the entire team during any given sprint. The larger your team gets, the harder it becomes for you to discern what work is stuck in the pipeline and why.
Velocity and GitPrime take different approaches to identifying outliers or irregular work patterns.
Velocity
Velocity employs a variety of visualizations to help you find the root cause of any issue that might slow down your team:
- Activity: This report displays the number and size of commits, merge commits, and PRs on a developer-by-developer or team-by-team basis over time. Scanning this page will enable you to see whether what developers are working on meets your expectations.
- Pull Requests: This view keeps the WIP/contributor on top, but also shows you how far along each PR is from being merged. You can see at-a-glance which PRs are at-risk and who’s working on them. Click on an item to navigate to the original Pull Request in GitHub.
Your team is also able to spot issues outside the application through daily standup reports, available via email or Slack. Velocity, thus, isn’t an analytics tool for top-down management but for leaders wishing to keep the whole team on track.
GitPrime
GitPrime’s core product ties each issue to a contributor, which gives managers an easy way to determine who to go to when something goes wrong on a particular week or month. Only in the collaboration reports, available in higher tiers, is there insight into problematic work products, such as PRs.
Here’s where you’d look to find inefficiencies, bottlenecks, and stuck engineers:
- Work Log: The work log is the application’s homepage. Similar to Velocity’s Activity Log, this page displays different types of work that a contributor produces. In addition to commits, merges, and PRs, they also display ticket comments, since GitPrime also offers an integration with JIRA.
- Snapshot: This feature is basically an automated performance review of each contributor. It gives a summary of how their performance stacks up against their team members’, and plots them on a matrix that shows the speed (measured by Impact) and the quality (measured by Churn) of their work. A further breakdown can be seen below.
- Spot Check: This feature displays how contributor performance has increased or decreased as compared to the last week or last month. At-a-glance you can quickly spot abnormalities and know who to approach for more information.
We recommend GitPrime for managers who prefer visibility into low-performance developers over visibility into stuck work.
Customization
Tl;dr: Velocity includes customizable reports that allow you ask questions of your data to derive more meaningful insights. GitPrime does not have custom reporting, but they do offer an API.
If you have unique requirements or track a unique metric, you might require a more flexible platform. Here’s how your two options compare.
Velocity
Velocity has an entire feature set dedicated to making the product more flexible for teams who work off the beaten path:
- Analytics Report: Velocity exposes all of your Pull Request, Code Review and commits data for you to create custom reports. You simply pick your data set, determine how you want it summarized (by average, sum, etc.), and then how you’d like it displayed. You can choose from 9 different views, including line graphs, bar graphs, and area graphs.
- Reports and Metric Permissions:Not all teams find the same analytics valuable, so Velocity gives users the ability to turn on and off whatever metrics or full features that they’d like. You can also control whether each metric can be segmented by team or individual, or only available at the organization level.
- Contributor-wide, team-wide, or org-wide targets: Once you’re familiar with how your team performs week to week or month to month, you can set targets to push your team to improve along whatever criteria you’re prioritizing. You can attach tags and metadata to these targets, and they’ll be sent out to your team on a weekly basis.
Velocity is the best option for engineering organizations who’d like the flexibility to build any charts that aren’t already available out-of-the-box.
GitPrime
GitPrime does not have custom reporting, but they do offer an API in their Enterprise package for customers who have the resources to build out their own reports.
There is also portion of the application where users can set simple targets for the entire organization, teams, and contributors.
GitPrime is a good fit for customers who have the resources to build out their own reports.
Cost
Tl;dr: While pricing of the two products is competitive, GitPrime restricts more features in their lower tiers. Velocity offers more capabilities for less, and the flexibility of their platform allows for customizability irrespective of cost.
The two products do not differ much in terms of pricing, so if you’re operating within significant budget constraints, a built-it-yourself solution is probably most feasible. Otherwise, both products tier slightly differently, so make sure you’re getting the core features that are most important to your team.
Velocity
Velocity has four pricing packages based on team size, including a free option for teams of 10 or fewer. For teams of 10+, pricing starts at $449/seat per year. Each tier includes access to all metrics and reports (including the flexible Analytics report) and gives teams access to unlimited historical data.
The small and medium tiers are limited in number of repos (50 and 100, respectively), while the largest priced tier is not. The team reporting function, which lets you see metrics summarized on a team-by-team basis, is not available until the largest tier.
GitPrime
GitPrime has a more complex pricing system. They have 3 tiers with different features, and a sliding pricing scale, based on how many engineers are in your organization. Their pricing starts at $499, but they limit a lot of their features in the lower tiers.
The lowest tier does not include their “code review collaboration insights.” They also restrict the historical data they make available– 12 months for the first tier and 36 months for the second tier.
Different Strokes for Different Management Folks
Engineering excellence drives business performance. The teams that are excelling in the space are the ones that have the vernacular to talk about developer performance and the tools to improve it.
To this end, Velocity data serves three primary purposes. It’s used to:
- Help improve team and developer performance,
- Drive continuous improvement across engineering processes, and
- Communicate engineering’s progress both within the department and to others in the organization.
Most importantly, Velocity has a few more tools to put your learnings into action. You can set up Slack and email alerts for irregular activity and you have a first-class targets system to encourage your team to improve.
Conversely, GitPrime’s main focus is individual performance, importing data from Git, which means their tool primarily works off of source-code level data, not collaborative work data.
GitPrime equips a manager to keep closer track of their engineers, so they have a clear idea of the strongest and weakest performers of the team. This approach is for hands-on managers who still want an active role in how their direct reports work.