Leadership

Businesses want high quality codebases and developers want to write high quality code – but what does that really mean? How can you tell if your code is high quality?
Search for a single definition of software quality and you’ll see that it is open to considerable, and sometimes heated, debate. Aside from matters of taste, this is because code quality can’t be defined by a single attribute, but rather through a combination of traits. So how do you identify them?
Over the years, as we’ve talked with customers about what they’re trying to achieve with a code quality solution, the same eight traits keep coming up:
☐ Clear
Can the code be read, understood, and maintained over time, by someone who isn’t the code’s original author. Martin Fowler, an authority on code quality, stated this well: “Any fool can write code that a computer can understand. Good programmers write code that humans can understand.”1
☐ Simple
Elegant code that does exactly what is needed and nothing more, sometimes described as “the simplest thing that could possibly work”.
☐ Well-tested
Code is written to achieve a purpose, and testing – either with unit tests or integration tests or both – is the best way to determine if it achieves that purpose and works with the rest of a codebase. Of course, just having lots of tests doesn’t mean code is “well-tested”. The tests themselves must be concise, readable, and comprehensive.
☐ Bug-free
A raincoat that doesn’t keep out water isn’t high quality. For the same reason, the presence of bugs preventing desired behavior is a common marker of low-quality code.
☐ Refactored
Refactored code is code that is not just written once and committed, but iterated on to match best practices and the team’s conventions.
☐ Documented
As with clarity, documentation – inside the code or external – is highly regarded because it supports long-term maintainability.
☐ Extensible
In a business environment, codebases are constantly evolving to meet new requirements. Code that is extensible is prized for its ability to enable developers to rapidly add new features without having to spend a lot of time on maintenance.
☐ Performant
For businesses delivering a service where speed is paramount – say, e-commerce platforms – code is unlikely to be considered high quality unless it’s performant.
Any combination of these can make for great quality code depending on what’s important to your business. The difficulty is deciding what that is as a team.
Perhaps initial time to market is your core business priority – if so, you may not be as concerned about test coverage, and that’s okay.
The important thing is to make sure that everyone contributing to your codebase is on the same page, and the goals for your business and your code are aligned. If not, you risk moving in different directions and not achieving either.
Next time we’ll take a look at how to choose the right complexity metric for your team.

Formal code review is a recognized best practice within the software industry, for good reason, including:
- Providing newer developers an opportunity to receive feedback, ask for help, and make sure they’re on the right track
- Allowing experienced developers to keep an eye on code as it’s added to the codebase, and ensure it meets their organization’s standards
- Preserving and transferring institutional domain knowledge
That said, code review also has its issues. It can be cumbersome to perform, challenging to arrange, and difficult to standardize. We certainly found it to be a headache — and we love reviewing code! That’s why we built Code Climate: to automate as much of the review process as we can, in a way that seamlessly integrates with our pull request workflow.
Why build an automated code review process around pull requests? Because they make your life easier. A page with a URL that encompasses the code changes and the technical product discussions around a feature makes the intangible more tangible. It surfaces discussion that can otherwise be hard to access. It archives conversation and can serve as a valuable reference for new team members getting up to speed on how work gets done at your shop.
Previous solutions for this workflow problem would have your artifacts scattered all over the place — code changes in your version control system, comments in an issue tracker, and, of course, tons of email. Pull requests corral everything, and this improved locality is hugely convenient. They also allow you to attach media, engage in illustrative conversation, and signal that you simply like what you see. All of this enhances the code review process by helping to flesh out the impersonal nature of online, asynchronous communication. Plus, every developer knows what a pull request is and how they work.
Our pull request integration automatically scans your PRs for code quality and security issues. After you open a PR, Code Climate will update its status in GitHub, as seen in the screenshot below. Our status update provides a direct link back to the relevant branch comparison page, giving you a detailed analysis of how the PR branch compares to your default branch.
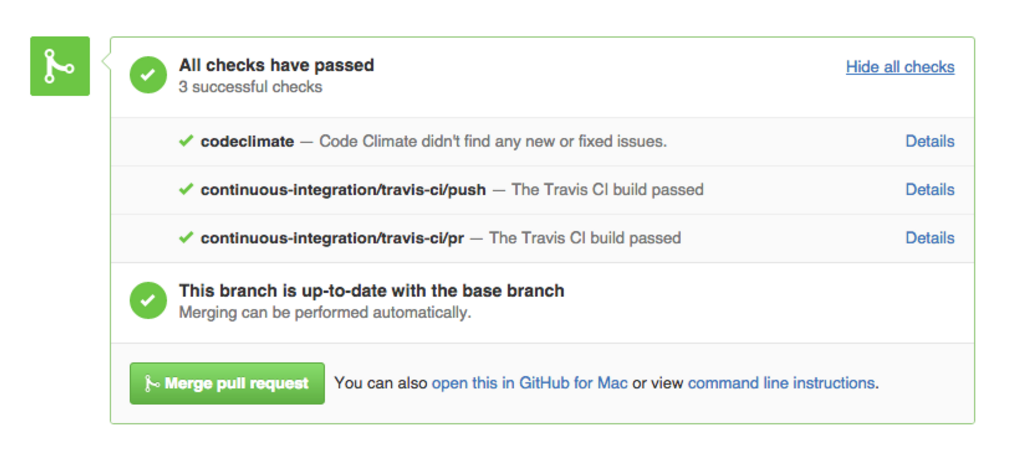
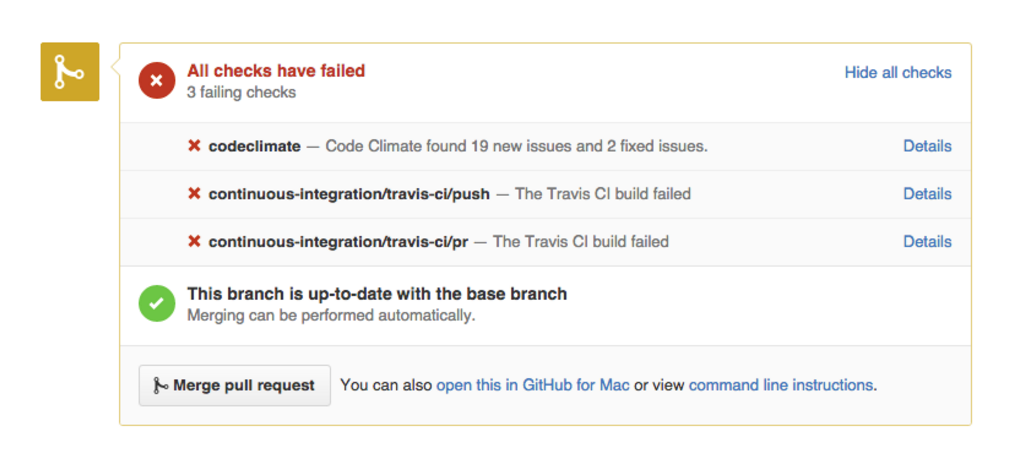
Code Climate automatically checks for consistent style, eliminating the need for developers to review this manually. In fact, your team standards will be enforced on every commit — your pull request will be marked “failed” if any new checks are found — ensuring consistency across your codebase.
Having an automated tool deliver information about code quality issues has benefits beyond time-saving. Everyone gets the same treatment from an automated analysis, and that’s a good thing for your team’s morale and for your code, with the kind of feedback that’s dismissed as “nitpicking” when provided by a team member generally well-received when delivered by a “bot”.
Combining the power of automated code review with a GitHub based pull request workflow works. When all communication is centralized, and developers aren’t sidetracked by tasks or feedback that can be automated easily, friction is reduced, confidence increases, and your output improves. Try it with your team — we think you’ll like it!

Software teams trying to improve the health of their codebase are often hindered by a lack of refactoring experience. Combine this with a mix of experience levels (both with the code and the domain), and differing style preferences, and it’s easy to understand how even well-intentioned teams find it hard to effect positive change.
There are a variety of techniques to help in these cases, but our favourite is “Mob Refactoring”. It’s a variant of Mob Programming, which is pair programming with more than two people and only one computer. This may sound like complete chaos — and we certainly don’t recommend working like this all the time — but it can be a very effective approach for leveling up the refactoring abilities of the team and establishing shared conventions for style and structure of code.
Here’s how it works:
1) Assemble the team for an hour around a computer and a projector. We recommend ordering food and eating lunch together — your long-term code quality goals will only be helped if there’s a positive association between refactoring and delicious food.
2) Bring an area of the codebase that’s in need of refactoring. Have one person drive the computer, while the rest of the team navigates.
3) Attempt to collaboratively refactor the code as much as possible within the hour.
4) Don’t expect to produce production-ready code during these sessions. The value of the exercise is in the conversations that take place, not the resulting commits.
5) Stick to your one hour timbebox and, when you’re done, throw out the changes. Under no circumstances try to finish the refactoring after the session — it’s an easy way to get lost in the weeds.
Do this a few times, and rotate the area of focus and the lead each week. Start with a controller, then work on a model, or perhaps a troublesome view. Give each member of the team a chance to select the code to be refactored and drive the session. Even the least experienced member of your team can pick a good project — and they’ll probably learn more by working on a problem that is on the top of their mind.
Mob Refactoring sessions provide the opportunity for less experienced members of the team to ask questions like, “Why do we do this like that?”, or for more senior programmers to describe different implementation approaches that have been tried, and how they’ve worked out in the past. These discussions help close the experience gap and often lead to a new consensus about the preferred way of doing things.
If you have a team that wants to get better at refactoring, but experience and differing style patterns are a challenge, give Mob Refactoring a try. It requires little preparation, and only an hour of investment, but the impact can be massive.

Developers have access to a variety of tools to help ensure that the code they produce doesn’t break, works as intended, and is easy to understand. Among them are tools that use static analysis.
Static analysis is a technique used to discover issues in your code without actually running it.
Finding issues with your code before it runs is a good thing because it means that you can address issues before they hit production, before they bother users, or before they are costly in any way. Because so much research attention has been paid to static analysis over the years, it’s possible to find all kinds of interesting problems in code without executing it — it really seems like magic!
Let’s start with a small example of the kind of simple things that static analysis can uncover that can save you actual time during development, and prevent real bugs and maintainability issues. Check out this snippet of JavaScript code:
function main(a,b){ return a == null; }
An experienced JavaScript developer looking at this code can probably note a couple of things right off the bat:
- The ‘b’ variable is unused in the function
- The function name ‘main’ is not descriptive of its functionality
- You should use
===, not==when comparing tonull
While a less seasoned developer might miss #3 or disagree with #2, at least two of these, #1 and #3, can be automatically detected by static analysis. That’s right — instead of a developer having to context switch and review simple things, you can have it done automatically. And as the old saying goes (okay, it’s not an old saying, we just made it up):
When in doubt, automate.
So what kinds of issues can static analysis find? Let’s take a look:
- Quality issues themselves come in a variety of flavors. You can discuss quality in terms of code clarity, bug risk, and complexity, to name a few. Different issues require different means of detection, but many quality issues boil down to analysis that understands the conventions of the programming language under scrutiny. Tools developed within programming language communities tend to enforce the idioms of that community, which can be a very helpful thing in static analysis.
- Security is important to most users of static analysis, and a wide range of issues can be detected. Simple security checks can take the form of making sure that your dependencies are up-to-date or enforcing the deprecation of unsafe functions or APIs. Sophisticated security checks can do what is called data flow analysis, where the paths of data that come from “outside” of the system are extrapolated using complex algorithms.
- Style issues in code are often trivial to detect, but implementing and maintaining consistent style guidelines is a key component of an effective code review process and a maintainable codebase. Simply taking discussions about style off the table can work wonders for a team that tends to quarrel endlessly over the nitpicking style issues that, in the long run, can be automated away.
Between quality, security, and style, static analysis is a serious power-up for your development workflow. So how do you get in on this?
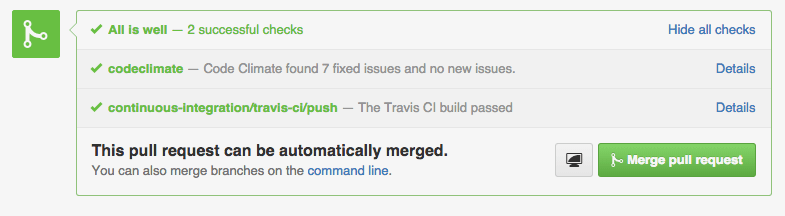
The most useful places to get static analysis results are on your developer’s machines, and again in your team’s pull requests. Fortunately, Code Climate does both.
With our command line tool, you can run a variety of static analysis tools at once to enforce your team’s standards and also look for subtle bugs, complexity issues, duplication, and more. As everyone on your team has access to these tools locally, they can make sure that they aren’t introducing new issues when they push code, improving the quality of commits.
After you push, analysis is run on the Code Climate server and the results pushed directly to your pull request. Reviewers can instantly see that your code doesn’t introduce new errors, letting them focus on reviewing the aspects of the commit which require human expertise.
Once you get some automated static analysis in your workflow, you’ll wonder how you lived without it. The tedious but necessary tasks that burn out your best developers are the ones at which computers excel – and will ensure your code is secure, not prone to a variety of annoying bugs, and conforms to your team’s best practices. We suggest checking it out today!

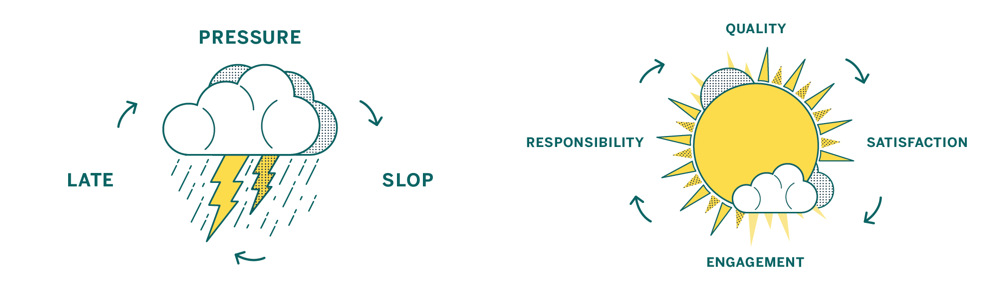
In our first post, we looked at how pressure-driven development leads to sloppy code and saw how shifting focus from deadlines to quality leads to happier, more productive teams. In this part, we’ll cover in detail five steps you can take to make that shift, so you have an actionable plan for building a culture of quality in your team.
1. Codify your best practices
Establish a shared and agreed-upon style and standard.
One of the best first steps you can take as a team is to start working on a style guide for the various languages and frameworks you use.
Style guides reduce friction because they take a whole class of issues off the table during code review. They enforce standards by codifying best practices. And best of all, style guides make contribution easier because people will know your project’s contribution requirements up front.
There are lots of great examples online, like GitHub’s Ruby Style Guide or Airbnb’s JavaScript Style Guide. They each represent the guidelines of contributing code to existing projects in those organizations, and guide how code is written when new projects are made.
2. Automate, automate, automate
Let your tools work for you.
When it comes to working on your internal process and company culture, it’s important that any improvements you introduce are perceived as being worth any additional work involved. Style guides are one great example of this, as enforcing a style guide is a much longer project than creating one.
To reduce the amount of work for your engineers, project managers, and QA team, seek to automate whatever tools they are using as part of your overall process. Relieve your team of the burden of running tests locally, and instead run them automatically on a centralized CI server. Instead of relying on everyone to run multiple code quality tools locally, run them simultaneously and automatically with Code Climate. Reducing the friction inherent in running these tools will make a big impact in your organization.
3. Get feedback in the right places
Bring the right data to the right people at the right time.
Once you’ve automated your build process and style guide enforcement, it’s time to make sure that the information gets to the right people. Don’t make people go to the data, bring the data to the people.
Tools that can post where your developers work – like in a GitHub Pull Request – have an advantage of those that don’t. Bringing feedback about code that doesn’t pass the style guide, or doesn’t pass tests inline with code review as it happens makes a huge impact.
When people see data, they can act on it. It’s as simple as that.
4. Measure your progress
Quantify what matters to you.
Building a culture of code quality means creating quantitative goals, and having quantitative goals depends on having stuff that you can measure. Tools like Code Climate can help you create guidelines for progress, and offer ways for your team to see the impact that they are having on the code over time.
Once you have metrics like the GPA of your Code Climate repo or the number of issues found by Code Climate’s static analysis engines, you can begin to act on them. To start with, though, there are just two guidelines you need to keep in mind to observe your code quality improving, your communication getting easier, and your results coming faster:
- Leave code better than you found it
- Don’t introduce new files that aren’t up to quality standards
When you focus on the impact of every proposed change to your code, you’ll improve with every commit.
5. Encourage participation and ownership
Once your tools are set up and running smoothly, it’s up to your team to enforce standards and welcome feedback evenly. You’ll find that getting these best practices in place involves making many compromises: older projects will have established standards while new projects may be opportunities to explore new ideas.
When every individual on every team is working along with a set of automated tools that provide actionable, quantified data, you’re on your way to a culture of code quality. Remember that your team wants to execute at the highest possible levels, and everyone participating in an open, encouraging atmosphere will activate the potential of the virtuous cycle.
Getting there takes time and energy, but we think the steps outlined here will send you well on your way. You’ll be able to measure your progress, react when necessary, and stay on top of your goals: to ship awesome stuff, and achieve a virtuous cycle that perpetuates healthy code and happy developers.

Update: See our CEO and Co-Founder Bryan Helmkamp introducing the Code Climate Quality Platform!
Today, we’re thrilled to launch the Code Climate Quality Platform − the first open, extensible platform for all types of static analysis.
We’ve come a long way since we started building a static analysis tool for Rubyists. Today, we’re fortunate enough to help 50,000 developers analyze about 700BN lines of code every weekday. As we’ve grown, we’ve seen that clear, actionable static analysis leads to healthier code and happier developers. Our new platform brings those benefits to every team, regardless of the technologies they use, so that they can focus on shipping quality software.
What does this mean exactly? First, we’re open sourcing our analysis tools, including the engines and algorithms we use to evaluate code. If you have a running Docker host, using Code Climate on your command line is as easy as:
boot2docker up && `boot2docker shellinit` brew tap codeclimate/formulae brew install codeclimate
We’re also enabling anyone to write static analysis engines that run on our servers by following a simple specification. No longer will you have to wait for us to provide support for your programming languages, frameworks and libraries of choice. Finally, using our new Code Climate CLI, you can now run any Code Climate-compatible static analysis on your laptop – for free.
Let’s look at each of these in turn…
Open Source
We’re releasing the static analysis engines that power the new Code Climate Quality Platform, and going forward, all of our static analysis code will be published under Open Source licenses. Code Climate has always provided free analysis to Open Source projects, and this continues to deepen our commitment to, and participation in, the OSS community.
Code Climate has always stood on the shoulders of giants in depending on Open Source libraries for the bulk of our static analysis algorithms. We would not exist today if not for the great work of people like Ryan Davis (Flog, Flay) and Justin Collins (Brakeman) that demonstrated the value of static analysis and allowed us to quickly bring it to developers.
Open Source static analysis means you can dig in and understand exactly how your code is being evaluated. And customizing static analysis algorithms becomes as simple as clicking the “Fork” button on GitHub…
Extensible
With the release of our new Code Climate Engine Specification, anyone can write static analysis engines that run on our servers. Code Climate’s set of officially supported languages can be augmented with community supported static analysis engines so that you can get confidence in your code, regardless of your choice of technology. For years, our most common type of feature request has been, “Can you add support for X?”, where X is a programming language, version of a language, or sometimes a framework. We’ve always wanted Code Climate to work for all developers, but in the past we were limited by the effort required to add new languages.
We believe that you shouldn’t have to wait for a vendor to add support for the languages you love, so are finally removing ourselves as the bottleneck to new static analysis features. Anyone who is interested in using Code Climate with their favorite languages, frameworks and libraries is free to build an engine to do so. Results from engines retain all the benefits of the Code Climate product, including automatic analysis of every Pull Request, comparison views, ratings/GPAs, and notifications. Of course, there’s already a vibrant community of OSS static analysis tools, and we’re excited to see what people are able to build and integrate. It’s really astounding how simple it is to build a Code Climate engine, as we’ve watched developers build functioning analysis from scratch in a matter of a couple hours.
If you want to give it a try, join our new Developer Program and we’ll be there to guide you along the way.
Run Anywhere
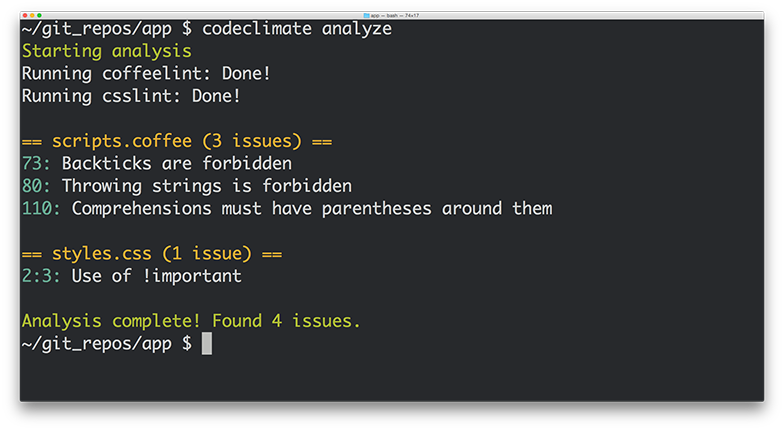
In addition to the spec, we’re also releasing the Code Climate CLI, which makes it easy to get static analysis results (both from Code Climate’s official engines and community-supported engines) in one clear, unified report right on your laptop. When you’re ready, you can load your repository into codeclimate.com and we’ll automatically apply the exact same configuration you use locally to analyze every commit and Pull Request, making the results available to your entire team.
To make static analysis truly ubiquitous, we realized it was not enough to support a wide variety of tools, we need to make it trivial to run these tools anywhere the developer is working. You shouldn’t have to wait to push your source code to a remote server to get clear, actionable static analysis results. Now it’s possible to easily run the same static analysis we run on our servers on your command line.
New Static Analysis Engines
We’re fortunate to be partnering with creators of two prominent Open Source projects who understand the value of static analysis in ensuring healthy code, Tom Dale from Ember.js and Laurent Sansonetti from RubyMotion. Here’s what they have to say about the Code Climate Quality Platform:
“The Ember community takes good tooling seriously. I’m excited to partner with Code Climate and bring their service to our users because better static analysis means better Ember apps.”
– Tom Dale from Ember.js
“HipByte is excited to partner with CodeClimate to provide clear and reliable code reviews for RubyMotion projects. RubyMotion allows Ruby developers to write cross-platform apps for iOS and Android by leveraging the native platform APIs, and a tool for static analysis means fewer crashes and more reliable applications.”
– Laurent Sansonetti from RubyMotion
Accordingly, we’re releasing an Ember.js engine that brings the Ember Watson tool to all Code Climate users, and a set of custom checks for RubyMotion that will help ensure that your application code is reliable.
In addition, we’re proud to release eight new static analysis engines that you can start using with Code Climate today:
- Gofmt, Govet and Golint – The official style, bug and lint checkers from the Go team
- CoffeeLint – Style checking for the CoffeeScript dialect of JavaScript
- CSSLint – Style checking for all CSS stylesheets
- Rubocop – Style and quality checks for Ruby code (including support for RRuby 2.2+)
- ESLint – Linting and style checking for your modern EcmaScript/JavaScript code
- Bundler Audit – Find security vulnerabilities in your Ruby dependencies
- PHP CodeSniffer – Style checking for PHP
Healthy Code Ships Faster
In many ways, our new platform is a culmination of the experience we’ve gained over the past four years building and operating the most popular static analysis app. We’re excited to bring this to you, and look forward to continuing to bring you the best tools to ship better code, faster. If you want to try out the new Code Climate, download our CLI to get started.

In exciting programming language news (how often do you get to say that?) Apple recently released Swift, a compiled language meant to augment Objective-C for development on Desktop and Mobile iOS platforms. While Swift’s primary audience at this (very early) point is iOS developers, the language contains some interesting functionality for program design that will appeal to a wider audience, including Ruby, JavaScript, and PHP developers.
In this post I’ll take a look at three of the program design constructs that Swift provides: Classes, Structures, and Protocols. I’ll discuss how they can contribute to well-designed Object-Oriented (OO) programs in a way that might be interesting to dynamic language programmers, and show how aspects of their design reflect concerns of the platform for which they were developed.

Classes and Structures
The best source of information about Swift so far is The Swift Programming Language, a free e-book provided by Apple. It contains a first pass introduction to the language, a language reference, and a good deal of example code. After introducing the basic facilities of the language – its philosophy, the basic available types and data structures, control flow, closures, and so on – we get to the section on Classes and Structures.
“Classes and structures are general-purpose, flexible constructs that become the building blocks of your program’s code.” [1]
This sounds similar to the functionality of a Class or Module in Ruby. From this list of the features of Classes and Structures, we see even more similarities. Classes and Structures can both:
- Define properties to store values
- Define methods to provide functionality
- Define initializers to set up their initial state
- Be extended to expand their functionality beyond a default implementation
This means that Swift provides similar functionality to familiar OO Programming Languages. We can model problems using objects which can encapsulate data and functionality, and build complex relationships between these objects in a modular fashion. Curious readers might have the same reaction to this as I did – if it’s the case that both classes and structures can do the above, which is a reasonable set of functionality to expect from classes, why are there two constructs? What are the differences between them, and why does Swift as a programming language need both?
First, let’s take a look at what Classes can do that Structures cannot. Classes provide functionality for two crucial pieces of OO functionality that Ruby developers, for instance, tend to rely on somewhat heavily:
- Inheritance, where one class can inherit the characteristics of another
- Type casting, where you can check and interpret the type of a class instance at runtime
Additionally, classes provide the following facilities which are stated in terms familiar to those with experience managing resources and memory manually:
- Deinitializers, to enable an instance of a class to free up any resources it has assigned
- Reference counting, to allow for more than one reference to a class instance
Stated in other terms, inheritance, type casting, deinitializers, and reference counting make it possible to expressively create designs which employ the full compliment of OO techniques.
From my perspective, Classes and Structures have just the right amount of overlap in functionality, leaving enough room for developers to make reasoned decisions about which construct to employ according to the purpose it may be used for. The differences hinge on how instances of Classes and Structures are represented in memory after they are initialized – structure instances are always passed by value and class instances are always passed by reference. This distinction is something that dynamic language developers typically do not have to spend much time thinking about – on a mobile platform, however, this kind of thinking becomes very important.
Different memory semantics is not the only advantage of having these distinct types, however. Because structures are simpler than classes, and cannot be as heavily modified after declaration, they provide an opportunity to create value objects which represent pieces of data independent from their behavior. This is very useful.
While Classes and Structures cover much of the familiar ground with respect to OO functionality in Ruby or Python, there is one more construct that might not be so familiar that I’d like to point out before we draw any conclusions on Swift’s OO design capabilities.
Protocols
Protocols are an interesting addition to the already rich world of classes and structures. They provide a way to define behavior separately from the classes which implement them:
“A protocol defines a blueprint of methods, properties, and other requirements that suit a particular task or piece of functionality”
Similar constructs exist in Java, Go, and other languages, but many dynamic languages do not embrace this design style. Protocols embrace flexible design by encapsulating the necessary data and behavior for a domain idea outside the scope of a Class or Structure definition. This means that a concept can be represented separately from its implementation, allowing for more creative reuse, composition, and more.
To illustrate the usefulness of Protocols, consider the development of a small networked process to record some information from a system over time. You might want to have the system write to a Key-Value store, or to disk, or to STDOUT, depending on a variety of circumstances. In this case, you would simply define a Protocol:
protocol BackEnd { func get(Int) -> Int func set(Int) -> Bool }
This protocol requires that anything which implements them must contain at least two instance methods – get, which accepts an Integer and returns an Integer, and set, which accepts an Integer and returns a Boolean value. A class that implements this Protocol might look something like the following:
class RedisBackEnd : BackEnd { func get(id: Int) -> Int { // Get 'val' from Redis based on 'id' let val = getFromRedis(id) return val } func set(val: Int) -> Bool { // Store 'val' in Redis here let boolFromRedis = storeInRedis(val) return boolFromRedis } }
You could imagine similar classes for the other backends I mentioned above. This is a very convenient solution for swapping out backends when you need to run your process in different locations and under different circumstances – simply implement new ones as needed, and pass them in wherever a Backend is needed.
Defining a Protocol and implementing it is really the tip of the iceberg, however – things can get very subtle and complex. Protocols can be treated as types, and intricate hierarchies can be created with them. While it is interesting to look through the Swift book to see these examples, I don’t believe they are the real selling points of protocols. Used simply and in combination with classes and structures, protocols provide a missing piece of the design puzzle that often vexes programmers in dynamic languages.
Conclusion
Swift is a very interesting programming language that at first blush appears to have all of the necessary components to build expressive OO programs. In addition to classes, structures, and protocols, Ruby developers might also want to look into Extensions which offer mixin-like capabilities.
Whether you prefer inheritance, composition, or even a more esoteric SmallTalk style flavor of OO, it seems that Swift will be able to support you.
Works Cited
[1] Apple Inc. “The Swift Programming Language.” iBooks.

Service-Oriented Architecture has a well-deserved reputation amongst Ruby and Rails developers as a solid approach to easing painful growth by extracting concerns from large applications. These new, smaller services typically still use Rails or Sinatra, and use JSON to communicate over HTTP. Though JSON has many obvious advantages as a data interchange format – it is human readable, well understood, and typically performs well – it also has its issues.
Where browsers and JavaScript are not consuming the data directly – particularly in the case of internal services – it’s my opinion that structured formats, such as Google’s Protocol Buffers, are a better choice than JSON for encoding data. If you’ve never seen Protocol Buffers before, you can check out some more information here, but don’t worry – I’ll give you a brief introduction to using them in Ruby before listing the reasons why you should consider choosing Protocol Buffers over JSON for your next service.

A Brief Introduction to Protocol Buffers
First of all, what are Protocol Buffers? The docs say:
“Protocol Buffers are a way of encoding structured data in an efficient yet extensible format.”
Google developed Protocol Buffers for use in their internal services. It is a binary encoding format that allows you to specify a schema for your data using a specification language, like so:
message Person { required int32 id = 1; required string name = 2; optional string email = 3; }
You can package messages within namespaces or declare them at the top level as above. The snippet defines the schema for a Person data type that has three fields: id, name, and email. In addition to naming a field, you can provide a type that will determine how the data is encoded and sent over the wire – above we see an int32 type and a string type. Keywords for validation and structure are also provided (required and optional above), and fields are numbered, which aids in backward compatibility, which I’ll cover in more detail below.
The Protocol Buffers specification is implemented in various languages: Java, C, Go, etc. are all supported, and most modern languages have an implementation if you look around. Ruby is no exception and there are a few different Gems that can be used to encode and decode data using Protocol Buffers. What this means is that one spec can be used to transfer data between systems regardless of their implementation language.
For example, installing the ruby-protocol-buffers Ruby Gem installs a binary called ruby-protoc that can be used in combination with the main Protocol Buffers library (brew install protobuf on OSX) to automatically generate stub class files that are used to encode and decode your data for you. Running the binary against the proto file above yields the following Ruby class:
#!/usr/bin/env ruby # Generated by the protocol buffer compiler. DO NOT EDIT! require 'protocol_buffers' # forward declarations class Person < ::ProtocolBuffers::Message; end class Person < ::ProtocolBuffers::Message set_fully_qualified_name "Person" required :int32, :id, 1 required :string, :name, 2 optional :string, :email, 3 end
As you can see, by providing a schema, we now automatically get a class that can be used to encode and decode messages into Protocol Buffer format (inspect the code of the ProtocolBuffers::Message base class in the Gem for more details). Now that we’ve seen a bit of an overview, let’s dive in to the specifics a bit more as I try to convince you to consider taking a look at Protocol Buffers – here are five reasons to start.
Reason #1: Schemas Are Awesome
There is a certain painful irony to the fact that we carefully craft our data models inside our databases, maintain layers of code to keep these data models in check, and then allow all of that forethought to fly out the window when we want to send that data over the wire to another service. All too often we rely on inconsistent code at the boundaries between our systems that don’t enforce the structural components of our data that are so important. Encoding the semantics of your business objects once, in proto format, is enough to help ensure that the signal doesn’t get lost between applications, and that the boundaries you create enforce your business rules.
Reason #2: Backward Compatibility For Free
Numbered fields in proto definitions obviate the need for version checks which is one of the explicitly stated motivations for the design and implementation of Protocol Buffers. As the developer documentation states, the protocol was designed in part to avoid “ugly code” like this for checking protocol versions:
if (version == 3) { ... } else if (version > 4) { if (version == 5) { ... } ... }
With numbered fields, you never have to change the behavior of code going forward to maintain backward compatibility with older versions. As the documentation states, once Protocol Buffers were introduced:
“New fields could be easily introduced, and intermediate servers that didn’t need to inspect the data could simply parse it and pass through the data without needing to know about all the fields.”
Having deployed multiple JSON services that have suffered from problems relating to evolving schemas and backward compatibility, I am now a big believer in how numbered fields can prevent errors and make rolling out new features and services simpler.
Reason #3: Less Boilerplate Code
In addition to explicit version checks and the lack of backward compatibility, JSON endpoints in HTTP-based services typically rely on hand-written ad-hoc boilerplate code to handle the encoding and decoding of Ruby objects to and from JSON. Parser and Presenter classes often contain hidden business logic and expose the fragile nature of hand parsing each new data type when a stub class as generated by Protocol Buffers (that you generally never have to touch) can provide much of the same functionality without all of the headaches. As your schema evolves so too will your proto generated classes (once you regenerate them, admittedly), leaving more room for you to focus on the challenges of keeping your application going and building your product.
Reason #4: Validations and Extensibility
The required, optional, and repeated keywords in Protocol Buffers definitions are extremely powerful. They allow you to encode, at the schema level, the shape of your data structure, and the implementation details of how classes work in each language are handled for you. The Ruby protocol_buffers library will raise exceptions, for example, if you try to encode an object instance which does not have the required fields filled in. You can also always change a field from being required to being optional or vice-versa by simply rolling to a new numbered field for that value. Having this kind of flexibility encoded into the semantics of the serialization format is incredibly powerful.
Since you can also embed proto definitions inside others, you can also have generic Request and Response structures which allow for the transport of other data structures over the wire, creating an opportunity for truly flexible and safe data transfer between services. Database systems like Riak use protocol buffers to great effect – I recommend checking out their interface for some inspiration.
Reason #5: Easy Language Interoperability
Because Protocol Buffers are implemented in a variety of languages, they make interoperability between polyglot applications in your architecture that much simpler. If you’re introducing a new service with one in Java or Go, or even communicating with a backend written in Node, or Clojure, or Scala, you simply have to hand the proto file to the code generator written in the target language and you have some nice guarantees about the safety and interoperability between those architectures. The finer points of platform specific data types should be handled for you in the target language implementation, and you can get back to focusing on the hard parts of your problem instead of matching up fields and data types in your ad hoc JSON encoding and decoding schemes.
When Is JSON A Better Fit?
There do remain times when JSON is a better fit than something like Protocol Buffers, including situations where:
- You need or want data to be human readable
- Data from the service is directly consumed by a web browser
- Your server side application is written in JavaScript
- You aren’t prepared to tie the data model to a schema
- You don’t have the bandwidth to add another tool to your arsenal
- The operational burden of running a different kind of network service is too great
And probably lots more. In the end, as always, it’s very important to keep tradeoffs in mind and blindly choosing one technology over another won’t get you anywhere.
Conclusion
Protocol Buffers offer several compelling advantages over JSON for sending data over the wire between internal services. While not a wholesale replacement for JSON, especially for services which are directly consumed by a web browser, Protocol Buffers offers very real advantages not only in the ways outlined above, but also typically in terms of speed of encoding and decoding, size of the data on the wire, and more.

There are a few common questions that we get when speaking with Code Climate Quality customers. They range from “What’s the Code Climate score for the Code Climate repo?” to “What’s the average GPA of a Rails application?” When I think back on the dozens of conversations I’ve had about Code Climate, one thing is clear – people are interested in our data!
Toward that end, this is the first post in a series intended to explore Code Climate’s data set in ways that can deepen our understanding of software engineering, and hopefully quench some people’s curiosities as well. We have lots of questions to ask of our data set, and we know that our users have lots of their own, but we wanted to start with one that’s fundamental to Code Climate’s mission, and that we’re asked a lot:
Does Team Size Impact Code Quality?
Is it true that more developers means more complexity? Is there an ideal number of developers for a team? What can we learn from this? Let’s find out!
The Methodology
There are a variety of different ways that this question can be interpreted, even through the lens of our data set. Since this is the first post in a series, and we’re easing into this whole “data science” thing, I decided to start with something pretty straightforward – plotting author count against Code Climate’s calculated GPA for a repo.
Author count is calculated by summing the authors present in commits over a given period, in this case 30 days. The GPA is calculated by looking up the most recent quality report for a repo and using the GPA found there. Querying this data amounted to a few simple lines of Ruby code to extract from our database, including exporting the data as a CSV for processing elsewhere.
I decided to limit the query to our private repositories because the business impact of the answer to the question at hand seems potentially significant. By analyzing private repositories we will be able to see many more Rails applications than are available in Open Source, and additionally, the questions around Open Source repos are manifold and deserve to be treated separately.
Please note that the data I’m presenting is completely anonymized and amounts to aggregate data from which no private information can be extrapolated.
Once I had the information in an easily digestible CSV format, I began to plot the data in a program called Wizard, which makes statistical exploration dead simple. I was able to confirm that there was a negative correlation between the size of a team and the Code Climate GPA, but the graph it produces isn’t customizable enough to display here. From there I went to R, where a few R wizard friends of mine helped me tune a few lines of code that transform the CSV a graph.
The fit line above indicates that there is indeed an indirect relationship between code quality and team size. While not a very steep curve, the line shows that a decline of over 1 GPA point is possible when team sizes grow beyond a certain point; let’s dig a little deeper into this data.
The graph is based on data from 10,000 observations, where each is a distinct repo and the GPA measurement and author count measurements are the latest available. The statistical distributions of the two columns show that the data needed some filtering. For example, the GPA summary seems quite reasonable:
> summary(observations$GPA) Min. 1st Qu. Median Mean 3rd Qu. Max. 0.000 2.320 3.170 2.898 3.800 4.000
As you would expect, a pretty healthy distribution of GPAs. The author count, on the other hand, is pretty out of whack:
> summary(observations$AuthorCount) Min. 1st Qu. Median Mean 3rd Qu. Max. 1.000 1.000 2.000 3.856 4.000 130.000
The 3rd Quantile ranges 4-130! That’s way too big of a spread, so I’ve corrected for that a bit by filtering the max to 50 in the graph above. This gives enough of a trend to show how new teams may tend to fall according to the model, but doesn’t completely blow it out with outliers. After working on this graph with the full data set and showing it to a couple people, some themes emerged:
- The data should be binned, with 10+ authors being the largest team size
- Lines or bars could be used to show the “density” of GPAs for a specific binned team size
Some CSV and SQL magic made it pretty straightforward to bin the data, which can then be plotted in R using a geometric density function applied to team sizes per GPA score. This lets us see areas of concentration of GPA scores per team size bin.
Now that the team sizes are broken up into smaller segments, we can see some patterns emerge. It appears easier to achieve a 4.0 GPA if you are a solo developerand additionally, the density of teams greater than 10 concentrates under the 3.0 GPA mark. This is a much richer way to look at the data than the scatterplot above and I learned a lot comparing the two approaches.
Nice first impressions, but now that we’ve seen the graphs, what can we learn?
Conclusions
How to interpret the results of this query is quite tricky. On one hand, there does appear to be a correlation supporting the notion that smaller teams can produce more organized code. On the other hand, the strength of this correlation is not extreme, and it is worth noting that teams of up to 10, 20, and 30 members are capable of maintaining very respectable GPAs which are greater than 3.0 (recall from the summary above that the mean GPA is 2.898 and that only the top 25% score greater than 3.8).
The scatterplot graph shows a weak fit line which suggests a negative correlation, while the density line graph (which could also be rendered with bars) shows that teams of up to 10 members have an easier time maintaining a 3.0+ GPA than teams with more than 10 members. Very intriguing.
It is worth considering what other factors could be brought into play when it comes to this model. Some obvious contenders include the size of the code base, the age of the code base, and the number of commits in a given period. It’s also worth looking into how this data would change if all of the historical data was pulled up, to sum the total number of authors over the life of a project.
One conclusion to draw might be that recent arguments for breaking down large teams into smaller, service oriented teams may have some statistical backing. If we wanted to be as scientific about it as possible, we can look at how productive teams tend to be in certain size ranges and produce an ideal team size as a function of productivity and 75% percentile quality scores. Teams can be optimized to produce a certain amount of code of a certain quality for a certain price – but now we’re sounding a little creepy.
My take is that this data supports what most developers already know – that large teams with large projects are hard to keep clean; that’s why we work as hard as we do. If you’re nearing that 10-person limit, know that you’ll have to work extra hard to beat the odds and have a higher than 3.0 GPA.
On a parting note, we are sure that there are more sophisticated statistical analyses that could be brought to bear on this data, which is why we have decided to publish the data set and the code for this blog post here. Check it out and let us know if you do anything cool with it!
Special thanks to Allen Goodman (@goodmanio), JD Maturen (@jdmaturen), and Leif Walsh (@leifw) for their code and help and to Julia Evans (@b0rk) for the inspiration.