Leadership

The more engineers on your team, the harder it is to gain visibility. If you’re managing four people or more, you’re probably asking questions like:
- How do I supervise the work of all of these engineers?
- How do I make sure I’m adding value where needed?
You can leverage Velocity to address both of these concerns.
Get Immediate Visibility into Your Engineers’ Work
A quick scan of the Activity tab in the Team360 report will give you a sense of both what your team is working on right now and their general work habits.
Hover over a purple circle to see your team’s commits and understand what they’re working on without having to tap them on the shoulder.
Look for:
- Developers who haven’t committed code for a few days. They might be bottlenecked, especially if they’re new to the team.
- Developers whose commits don’t match your expectations for what the team is working on.
- Big commits and PRs (visualized by the largest shapes on the graph).
- Work that is distributed in a way that doesn’t match your expectations.
Use this concrete data as a jumping-off point for in-depth conversations with your team.
Identify High-Risk Pull Requests
Use the Pull Requests report to see PRs that may warrant your attention.
Most managers start by looking for open, high activity PRs. Activity is defined as PRs that are getting either a lot of commits or a lot of comments. To surface the oldest PRs, sort by age by clicking on the "Age" column within Pull Requests. Pay close attention to anything that’s been open for over 72 hours.
You might want to talk to someone like Harry Potter to see if there’s anything you can do to unblock him.
Understand Which Developers Might Need Help
There are a number of metrics that can help you find stuck engineers:
- Weekly Coding Days represents engineering capacity, or how much time per week developers are able to spend actually coding. When this metric dips, it’s an indicator that a team member might be (1) working in large chunks or (2) stuck on a feature or bug.
- PR Throughput & PRs Reviewed are output metrics. If these look unexpectedly low, it might be worth a quick conversation to understand what’s going on.
- Review Cycles & Rework are both proxies for churn. Review Cycles represent the number of times a Pull Request has gone back and forth between the author and reviewer. Rework is the percentage of lines of code that have been rewritten by the same developer within 3 weeks and is helpful for identifying churn earlier on in the development cycle.
Compare these metrics by team or by person in the Compare report to identify who is stuck.
Dive Deeper into Churn Metrics
High Review Cycles and high Rework represent waste in the development process and are therefore a great place to start optimizing.
A developer with high Review Cycles has been asked to go back and fix things in their PRs multiple times. If you see someone with higher than expected Review Cycles, you can investigate further by going into the Analytics tab.
Run a query for Review Cycles, grouped by contributor over the last week or two. Scroll to the bottom until you see the following bar graph visualization:
To understand what’s blocking specific engineers, like Hecate, you can click the arrow next to her Review Cycle count to drill down into specific PRs.
Sort the number of Review Cycles from high to low and look through the ones that have been open the longest. Anything above 1.5 Review Cycles may indicate a problem. In this case, the top two open PRs with 4 Review Cycles is a good place to start.
You can run this same process for Rework, which is another indicator of churn, but at the coding level. Note that the top quartile of engineering organizations keep their Rework to less than 4%.
Use Metrics to Enhance Visibility
Though metrics can’t tell managers everything they need to know, they can be a valuable tool for gaining insight into the work that’s happening on your team. With data like that found in Velocity, you can spot stuck work before it becomes a bottleneck, and make sure your team’s processes are effective.
If you’re not already using Velocity, speak to one of our specialists and find out how you can get a more complete picture of the work being done on your team.

When you discover the benefits of data-driven conversations, it’s likely you’ll want to invite your entire team to view all of their engineering metrics.
But an abundance of data can make it difficult to hone in on the most important trends, and data that’s lacking context is more likely to be misused or misinterpreted. That’s why we recommend rolling out Velocity gradually. Then, as your team becomes comfortable with the engineering metrics Velocity reveals, sharing more can become increasingly valuable.
What does a rollout look like?
Velocity is Software Engineering Intelligence platform, built to improve how teams make decisions. To that end, a “rollout” can be as simple as exposing your engineers to the metrics and dashboards through curated slides, or as involved as giving each team member access to the application.
Here are the different levels of exposure you can consider:
- Contextual exposure: Share what data you’re tracking and present relevant reports in meetings with teams and individuals.
- Scoped exposure: Share the Velocity reports you’d like and limit the data scope by team or by individual so that engineers only see the metrics that are most relevant to them.
- Full access: Provide engineers with access to all their own and their team member’s data.
Different teams have varying levels of trust and familiarity with engineering performance metrics, so the right exposure will differ team-to-team. Use the guidelines below to gut-check when and how to introduce each type of rollout.
Introducing the idea of data-driven engineering with contextual exposure
The Challenge: Engineers are naturally skeptical and concerned about engineering metrics, so it’ll be up to you to advocate for the data and engender a positive culture around analytics.
The Preparation: We recommend that you work with your CSM to concretely define problem statements and get to know the dashboards and metrics that will support your objectives before sharing the tool with your team.
For instance, your objective may be to decrease batch sizes in an effort to improve the efficiency of your Code Review process. In this case, your supporting metrics may be Pull Request Size, Time to Open, and Review Speed.
Move on to rollout if you can answer yes to all of these questions:
- Can you articulate the problems that Velocity data will help you better understand?
- Do you know how the metrics you’re tracking connect to the problems you’ve defined?
- Will you be able to defend and explain these metrics to your team?
- Will your team feel confident that you’ll be using these metrics in a way that will benefit (not hurt) the team?
The Rollout: Introduce your problem statements and supporting metrics to your team. Have concrete examples of how you’re already working through a previously discussed problem using data.
Empowering engineers to own their success with scoped exposure
The Challenge: It’s one thing to periodically show org-wide metrics during team and individual meetings, but another to give engineers access to their own metrics. Even engineers who are interested in becoming more data-driven in theory can be wary of metrics when they’re frequently confronting their own dashboard.
The Preparation: To earn buy-in for limited use of Velocity, you’ll want to demonstrate how using data can help make 1:1s and retros more actionable. Use one of these meetings as an opportunity to find a concrete unit of work that represents an engineer’s experience or frustration. It can be helpful to involve a senior engineer earlier on, so they can pair what they know from experience with what is being surfaced in the data. Begin using Velocity to start conversations with real-world examples, so engineers can understand how data can be used to distinguish the signal through the noise.
Move on to rollout if you can answer yes to all of these questions:
- Can you correlate the experience of developers to specific PRs that Velocity is highlighting?
- Do you have a senior engineer who can advocate for the positive intention with which Velocity will be used?
- Do you have a sense of which metrics will be improved should you work through the identified challenges?
The Rollout: Work with your CSM to set up data scopes to display the appropriate reports and metrics for each engineer. At the end of your next retrospective, demo the Velocity product for your team. Encourage them to periodically view their dashboards and check in on key metrics at each retrospective so your team achieves the desired outcome.
Creating an autonomous team with full access
The Challenge: Introducing engineers to all of Velocity’s metrics means that not only does leadership have to interpret the metrics responsibly, but so does every single individual on the team. Exposing all of your metrics requires an extremely safe and trusting team environment.
The Preparation: First, you’ll want to show how setting quantifiable goals can benefit developers. Use a retrospective meeting to identify one significant problem they’re experiencing and work together to identify key metrics that will help work through the stated problem.
Move on to rollout if you can answer yes to all of these questions:
- Does your team have an identified problem that Velocity metrics will help work through?
- Have you identified both leading (health) metrics, and lagging (success) metrics for your stated problem?
- Can each team member explain why each metric was chosen in association with the stated problem?
- Do you have a hypothesis about what success looks like with these metrics?
The Rollout: Work with your CSM to set up data scopes to display all the reports and metrics for each engineer’s team. At the end of your next retrospective, demo the Velocity product for your team. Encourage them to periodically view their dashboards and check in on key metrics at each retrospective until the desired outcome is achieved.
Reach out to get started with Velocity, and find out how engineering metrics can help your team meet its goals.

The following is a guest post from Cassiopeia (now part of the cloud-based HR solution, HiBob), a SaaS solution that uses communication data to provide remote managers and team leaders with actionable insights regarding team dynamics, collaboration, and work-life wellness.
As distributed teams become the rule rather than the exception, managers and engineers are finding clear communication to be one of their biggest remote work challenges.
Remote work requires extra communication — as remote teams, we’re missing out on all the overheard discussions, cubicle wall meetings, and spontaneous brainstorms over lunch. For engineering teams, a lack of clear communication patterns means there’s greater risk that engineers will change and break code, overlap, and/or waste time doing unnecessary synchronous tasks.
Engineering teams could fall into unhealthy distributed work patterns if managers don’t set clear communication processes and structures. Managers can also help foster a more inclusive remote working experience by focusing on finding solutions for the communication hiccups within their distributed team.
The key to effective remote communication is to be much more intentional about how we communicate, when, and how often.
Here are a few tips that can help you optimize your communication while working remotely:
1. Set clear priorities and agendas. Whether in daily stand-ups or weekly team-wide meetings, be sure to set priorities for the week for all members of your team, so everyone is on the same page. As the team gets bigger and each individual starts working on multiple aspects of a product, this added context will make it easier for developers to switch off with other members of the team. In an office setting, you would be able to walk over and review someone’s code with them, but things are different virtually. If managers set clear agendas and priorities for their entire team, it creates more transparency and a clearer direction.
2. Make space and create processes for knowledge sharing. The key to successful completion of engineering projects is an effective communication flow and smooth transition of intricate inter-dependencies. If something changes in one aspect of a project, it will likely impact another team member and their workflow. This is why regular communication, especially when working remotely, is recommended for engineering teams.
From our research we have found that one of the most effective ways for distributed engineers to work together on a task is by pair programming. Just sharing a screen enables devs to code anywhere, edit the same files, click through the same dev server, and share a virtual terminal shell for running tests and other commands. Managers should encourage members to participate in this type of knowledge sharing, and also design process maps that help set up performance benchmarks and metrics to measure success for each individual on the team.
Have your team explicitly talk about their priorities for the day in your daily standup calls, and encourage them to discuss things like who will ‘drive’ the pairing session (i.e. who will be actively coding), who will raise tickets, and who will review before the final sign-off. This will help create a more inclusive work environment and combat the feeling of isolation when working remotely.
3. Don’t skip the 1:1 meetings. In the Manager Tools podcast, host Mark Horstman calls 1:1 meetings, “the single most powerful thing we know a manager can do to improve their relationship with direct reports and get better results.” These 1:1 meetings go beyond an open door policy. They offer dedicated time for leaders to coach, mentor, and build a working relationship with their employees, and they can open the communication channels in a remote setting. If, as a manager, you’re tempted to skip the 1:1 because you just had a call with someone in a team setting, stop and reflect on the importance of this one-on-one time. Remember, this meeting isn’t a performance review. A 1:1 is time for you to ask questions, listen to your employees, and coach where necessary. We suggest starting the meeting with, “how’s everything going?” or, “how’s it been working on xyz project so far?”
4. Over-communicate and use external tools to stay on top of things. Remote engineering teams often work asynchronously because they’re not in the same place. CEO of Remote Job van der Voort’s biggest recommendation is to over-communicate. “Remote team leads should always be writing more, saying more, the usual FYIs that you wouldn’t necessarily mention when you’re in an office space…mention them out loud in a remote workspace.”
3 tools that can add value to a remote workplace:
- A shared calendar: Remote managers should be transparent regarding where (and with whom) their time is being spent. This information should be made available to their entire team for the purpose of trust-building.
- Video conferencing: Research shows that remote employees tend to be more distracted in audio-only calls, but more alert and productive when their video is on. We recommend using Zoom, Slack Video, Teams, or any other video conferencing tool for calls that include more people, like company-wide meetings and team catch-ups.
- Project Management tool: Use a software like Jira or Trello to reflect on tasks and projects that members of the team are working on, and to monitor progress.
5. Communicate a clear Code Review process. Derek Parham was the former technical lead of Google Apps, where he scaled a team from one employee to over 100 in six years, and helped set up multiple processes that have contributed to better communication within the engineering team. “Google Marketplace was one of our first early remote teams, so there were a bunch of communication breakdowns. The design review process helped with that because we only spent a couple of weeks going back and forth instead of building a system for six months and then launching it only to realize it wouldn’t work, or would break a bunch of other things, or didn’t meet people’s expectations.”
He continues, “It’s okay to have that time crunch in the beginning when you’re writing the code and doing the review, because as soon as you launch the product, everyone knows what is going to be built.” Having a clear review process from the start can help engineering teams avoid many future issues.
6. Use a data-driven approach to increase visibility within the team and improve communication. When you’re working with a virtual engineering setup, it can be a lot harder to gain visibility on your teams. But it is possible. Engineering and other technical teams actually generate a lot of data about their communication patterns on a daily basis. It’s important for managers to aggregate and analyze this data and extract useful insights to improve the way team members communicate and work together. By doing so, managers can get a much clearer picture of how direct reports are communicating and collaborating. For all you know, that quiet engineer may be contributing much more than you thought.
At Cassiopeia, we use communication patterns and related tracking metrics to help managers gain visibility and spot communication issues in a timely manner. Managers can track if and when there are any collaboration issues between or within teams, or spot people who might be feeling less connected, all by tracking communication metrics.
7. Set daily ‘focus time’ for the team. When you’re working in a distributed team, it’s easy to get drawn into conversations on Slack or Teams with colleagues. The idea behind ‘focus time’ is to allow for dedicated work time, free from interruption and chatter. As a manager, setting daily focus time explicitly allows people to tune out group communication, and that’s an empowering move.
How does this work? Ask your team to turn off their Slack and Teams and work independently for set hours, either daily or weekly. This prevents team members (and managers) from having to keep one eye on their Slack channels. Quiet hours can be set based either on time zones, individual schedules, or personal preferences. Some managers also choose to have no-meeting days, which can produce similar results.
Despite the challenges, remote work can be very rewarding for organizations across the globe. With proper communication practices, the right tools, and a supportive work culture, distributed workforces can overcome common challenges and build more effective software and technical teams.
Cassiopeia is a SaaS solution that uses communication data to provide remote managers and team leaders with actionable insights to help improve team dynamics, collaboration, and work-life wellness.
The authors of Accelerate surveyed over 23,000 individuals in 2,000 distinct software companies to uncover the methodologies that set top-performing organizations apart. Their research suggests that “speed and stability are outcomes that enable each other” and that any software organization can measure and improve these outcomes.
The Continuous Delivery (CD) best practices they recommend, such as keeping batch size small, automating repetitive tasks and investing in quick issue detection, all perpetuate speed and quality while instilling a culture of continuous improvement on the team.
While most of the industry is actively adopting CD, few have set up any way to measure their progress. Concrete metrics, such as those found within Velocity, are a prerequisite to ensuring success in this transition.
In this guide, we’ve outlined how you can use Velocity to answer:
- How effectively is my team adopting CD practices?
- What’s hindering faster adoption?
Measure Improvement to Shipping Speed and Throughput
There are two success metrics that can represent how “continuously” your organization is shipping: speed (Cycle Time), and throughput (Pull Requests Merged or Deploy Volume).
Start by looking at the Analytics report to see how well you’ve been improving on one of those metrics. We recommend looking back at least 90 days.
Cycle Time, or the time between an engineer’s first commit to merging to production, should be trending down. Good coding habits, such as working in small batches, should keep changesets moving through the process with little friction, while CI/CD tooling should automate a lot of late engineering or QA work that frequently blocks merging to production.
Here’s how you can read this trend:
- Decreasing means you’re moving in the right direction. You’ve already adopted some Continuous Delivery best practices that have unblocked engineers and enabled them to move a single work in progress through the pipeline as quickly as possible.
- Flat is what you’d expect when you’re not in a state of transition. Typically, teams hit a local maximum with process efficiency when they’ve optimized as much as they can. If you’re in the middle of transitioning to CD, however, a flat Cycle Time is a bad thing. It means that even if you’ve changed some of the tooling or the messaging around how to ship software, this has not had the intended effect.
- Spiky indicates inconsistencies, and that your process is not delivering predictable results. You’ll want to take a closer look at days or weeks with particularly high Cycle Times to diagnose why work is getting stuck.
- Increasing is not a state you want to be in for a prolonged period of time, but can be normal during change management, as your team learns new practices and transitions to new tooling.
Alternatively, you can use Pull Requests Merged or Deploys as your yardstick. In this case, you can invert how you interpret results. Increasing throughput is desired, while flat and decreasing trends are a red flag that your team’s new practices are not yet yielding better outcomes.
Dive Into Key Health Metrics Team by Team
After understanding your overall engineering speed, you’ll want to investigate health metrics to find specific areas for improvement.
Velocity metrics can serve as strong proxies for the following Continuous Delivery practices:
- Good Coding Hygiene, which means working in small batch sets (PR size) and opening Pull Requests early (Time to Open).
- High Review Effectiveness, which means balancing review thoroughness (Review Coverage) and speed (Review Speed), while ensuring that comments lead to action (Review Influence).
- High Engineering Capacity, which means developers have enough time for engineering work (Weekly Coding Days).
In Velocity’s Compare report, you can look at these metrics across teams or for individuals to identify coaching opportunities or process improvements.
Click on a team to drill down and see performance on an individual basis:
Finally, get more context on a team or individual by seeing how they’ve performed on a specific metric, historically. The Analytics report lets you pick how far back you look and then drill down into any units of work that are dragging the average up or down.
Find the Biggest Opportunities for Improvement in Your Software Delivery Process
Now that you have all the context for how your team is working, create a mental model of your software delivery pipeline to see where a unit of work is most likely to get stuck. This will help you prioritize where you should start making optimizations.
We recommend breaking your process into three portions:
- Time to Open, or how long does development take.
- Review Speed, or how long does work sit before getting picked up for review.
- Time to Merge, or how long does the entire code review process take.
You can look at these three metrics side by side, by selecting them in the Analytics report and viewing them as bar graph clusters by week or by month.
With this data, you’ll be able to determine which area of your process is worth a closer look. If multiple stages need attention, we recommend starting with the one that comes earliest in your development pipeline, as improvements at early stages can have an impact downstream.
To dig into your own data and start measuring your progress towards Continuous Delivery, sign up for a demo of our Software Engineering Intelligence platform, Velocity.

“Don’t see management as a promotion, see it as a shift in role, and acknowledge that it will be a bit uncomfortable for you, and give yourself space to be okay with that.” – Smruti Patel, Engineering Manager at Stripe
Many engineering leaders move into management unprepared for precisely that reason — it requires a shift in mindset and a new set of skills. To ease that transition for new and aspiring managers, and to help seasoned managers level up, Code Climate and Codecademy for Business interviewed engineering leaders about the key components of leadership success. We spoke to VPs and Managers at companies like Netflix, Intuit, GitHub, and Stripe to find out about their most successful management strategies and the skills that they deem to be essential.
Their best advice is compiled in our ebook, How 10 Engineering Leaders Build High-Performance Teams.
Highlights include:
“Having leaders on your team that are not managers is actually very useful because for you as a manager, that means you don’t have to do everything…leadership by influence or suggestion is actually a lot more powerful.” – Mathias Meyer, Engineering Leadership Coach, www.paperplanes.de
“I start my management relationships with the foundation of trust, respect, and accountability. A powerful way to show trust and respect for your team is by welcoming everyone’s opinions, ideas and feedback.” – Alexandra Paredes, VP of Engineering at Code Climate
“Don’t pretend like you have all the answers. Do that figuring out in front of the team because it’ll make them trust you more, not less.” – Nitika Daga, Engineering Manager at Stitch Fix
Download it now for wisdom from:
- Tara Ellis, Manager, UI Engineering at Netflix
- Brooks Swinnerton, Senior Engineering Manager at GitHub
- Gergely Nemeth, Group Engineering Manager at Intuit
- Lena Reinhard, Vice President of Product Engineering at CircleCI
- Mathias Meyer, Engineering Leadership Coach, www.paperplanes.de
- Anchal Dube, Senior Engineering Manager at Zocdoc
- Andrew Heine, Engineering Manager at Figma
- Smruti Patel, Engineering Manager at Stripe
- Nitika Daga, Engineering Manager at Stitch Fix
- Alexandra Paredes, VP of Engineering at Code Climate
While most board decks will include business metrics like ARR, churn rates, and cash in the bank, these metrics only provide a snapshot of business health. They don’t speak to the strategic priority of how you plan to deliver real value. They also don’t illustrate engineering’s ability to execute on product timelines.
In this 30-minute webinar, Alexandra Paredes, VP of Engineering at Code Climate, runs through her method of communicating with technical and non-technical stakeholders in the board room. She covers:
- Representing both the speed and direction of your engineering department’s work
- Summarizing engineering challenges and opportunities
- Visualizing improvement against OKRs quarter over quarter
Armed with this framework, an engineering leader can illustrate the importance of their department and engage senior leadership on the best way to endure and thrive during these unprecedented times.
To incorporate this data into your own board deck, request a demo of Velocity.
It’s impossible to step into technical leadership fully prepared. The most successful technical leaders are always supplementing their own hard-earned expertise with the wisdom of others, drawing on the experiences of their peers and predecessors.
Over the past year, we’ve been speaking to engineering leaders from a range of industries, seeking out their advice on everything from fostering a strong company culture to helping your developers avoid burnout.
Now, for the first time ever, we’re making that collective knowledge available in one place.
It’s our inaugural Leadership Development Month – a December packed with resources for everyone from seasoned VPs to soon-to-be Engineering Managers. All of this year’s webinars and virtual events are now available on-demand, supplemented with blog posts and e-books, all aimed at helping you hone your leadership skills and build a high-performance engineering team.
Check out the materials below, and start preparing to be a stronger leader in 2021. There’s more to come, so be sure to subscribe to our newsletter and follow us on Twitter and LinkedIn for updates.
Data-Driven Leadership
- Roger Deetz, VP of Technology at Springbuk – Using Metrics to Reinforce Company Culture [Fireside Chat]
- Ale Paredes, VP of Engineering at Code Climate – Managing with Metrics [Fireside Chat]
- Juan Pablo Buriticá, Head of Engineering, LatAm at Stripe – Delivery Metrics [Fireside Chat]
- Edith Harbaugh, CEO and Co-Founder of LaunchDarkly – Continuous Improvement [Fireside Chat]
- The Moneyball Approach to Engineering Metrics [Blog Post]
- The Essential Data for Leading a Remote Engineering Team [Blog Post]
- How Our VP of Engineering Used Data to Support Our Engineering Team on a Human Level [Blog Post]
- So You Read Accelerate. Now What? [Blog Post]
Cycle Time: The Most Critical Metric
- The Engineering Leader’s Guide to Cycle Time [E-book]
- Perspectives on Cycle Time [Round Table]
- What is Cycle Time and Why Does it Matter? [Blog Post]
- The Virtuous Circle of Software Delivery [Blog Post]
- The Single Greatest Lever in Shortening Cycle Time [Blog Post]
- How to Stop Code Review from Bottlenecking Shipping [Blog Post]
- Keep Code Review from Wasting Everyone’s Time [Blog Post]
- The Last Mile to True Continuous Delivery [Blog Post]
Communicating with Executive Stakeholders
- What Your Engineering Board Slides are Missing [Webinar]
- How to Build a Leaner Process and Boost Your Engineering ROI [Webinar]
- Engineering Metrics are Business Metrics [Blog Post]
- Startup CEOs: Here’s Good News You Can Include in Your Q4 Board Deck [Blog Post]
- How to Choose Software Development KPIs for Your Board Deck [Blog Post]
- Hire People or Optimize Processes: A Cost-Benefit Analysis for Engineering Leaders [Blog Post]
- Hire or Optimize [Calculator]
Running Effective Meetings
- Running Remote Meetings with Data [Webinar]
- How 5 Minutes of Preparation Can Finally Make Standup Meetings Productive [Blog Post]
- Why Retro Action Items Fail (And What to Do About It) [Blog Post]
Leading High-Performance Teams
- Katie Womersley, VP of Engineering at Buffer – Be a Leader and a Manager [Fireside Chat]
- Dr. Aneika Simmons, PhD, and Anjuan Simmons, Technology Translator – Preventing and Addressing Burnout [Fireside Chat]
- Measure and Improve How You Innovate [Round Table]
- Developer360: Building a High-Performance Team with Data [Webinar]
- You Can’t Set Effective Engineering Goals Without Data [Blog Post]
Debugging Processes
Innovation is critical to startup success. To satisfy your customers, stay ahead of your competition, and keep your team engaged, you need to be shipping often — and at high quality.
But how can engineering departments measure and improve their ability to innovate?
With the right data, you can streamline processes and unblock your engineers, clearing the way for developers to work on fresh ideas and deliver new value to your customers.
In this 45-minute webinar, three startup leaders share how they use data to boost innovation on their engineering teams. You’ll hear from:
- Edith Harbaugh, CEO and Co-founder, LaunchDarkly
- Santiago García, Co-founder and CTO, La Haus
- Dalia Havens, VP of Engineering, Netlify
Here are some of the key takeaways:
Innovation requires iteration.
Edith Harbaugh: One of the things that really helped us innovate is we just had more swings at bat. If you’re in a cadence where you can release not every year, which is incredibly stale if you’re in the app store, but every month, or every week, and then do backend updates so you can update hourly – you’re going to win. ‘Cause part of the fact is that not everything you do is going to be perfect. But you just have to keep swinging and swinging and swinging, and one of those things is going to land.
Dalia Havens: One of the things I love about the way at Netlify we define innovation is that we focus on the simplicity of the solution to these complex problems…It’s about those quick iterations. It’s a learning journey. And it’s really hard to figure out which path will take you to the right solution if you’re not iterating.
Santiago García: To bring you some context, [La Haus is] in Latin America. So in this market, we have to invent actually everything. We don’t have [real estate] databases, like you in the US have…From here, we have to create everything from scratch. And that means you need to start to create everything with a good pace, with very fast experimenting because there are things that you don’t know.
Building a metrics-driven culture.
Dalia Havens: [Metrics] are operational measures. They are not punitive, they are very much a tool to help us improve at the end of the day.
Part of my responsibility is to create a quality of life for developers to do their best work. How are we measuring that? How are we removing roadblocks? How are we identifying that there was a roadblock? That’s where the data comes in. And when you bake it into the culture and not make it a taboo to talk about or hide it from this stakeholder or not communicate the incentive behind it, it creates a different shift…creating that metrics-driven culture is actually really important for the success of using metrics in your organization.
Edith Harbaugh: I think you really need to have metrics that people buy into in terms of, “How often do we ship?” because that means that I can feel pride that my code is out there. “How often are we able to roll back?” because that means that I can feel confidence.
Santiago García: What I think about it is what Peter Drucker said — “What you don’t measure, you can’t improve.” And that’s very important, that is very cultural. You can give feedback based on metrics, and people [can] feel comfortable with that. At La Haus, we have two values at the company…We have one that is, “Strive for more.” People want to improve, so it’s good to show the metrics, so they can see they are doing things [that] could have been better. Also, we have something that is called, “Extreme openness.” When you are open to feedback…you can take your data and make these data-informed decisions. For me, it’s very cultural.
Data provides objective insights.
Santiago García: When we started working remotely, some engineers started to complain — not complain, but they started to say, “Hey, we’re working more hours, we are exhausted, we have been working more.” My feeling was that we were delivering the same amount of work or less. But in that moment, I couldn’t measure [that feeling]. The first decision was to start measuring that, so I started using Code Climate.
Edith Harbaugh: When you get bigger, you just have to get a lot more deliberate about communication and about what you’re measuring and how teams work together. And then also still make sure that you are measuring, “Are we moving forward? Are we having meetings for the sake of having meetings?” So one question that the engineering side has to understand is, “How much new versus old features are you doing?” Like tech debt versus new, which is a really tricky balance. If it swings too far in either direction, you know that you’re going amiss. If 80% of my time is on maintenance, you’re not innovating. If 100% of my time is on innovation, and I’m not doing any code maintenance, stuff is going to start breaking in the field. So just keeping a close eye on metrics like that, in terms of “Does the team have the right pressure and direction?”
Dalia Havens: I fell in love with metrics because…through this organic journey to engineering management, I found that a lot of times without them, it’s a gut-feel conversation. And those are really hard to have without it seeming personal or you’re saying that someone is not putting in more hours or the right level of effort and so on. So what metrics have allowed us to do is sort of come objectively to the conversation. We are all trying to remove these roadblocks that are getting in your way and so on.
Transparency is critical.
Santiago García: [Transparency is] very important…I went with my team in a one hour meeting, I showed them the tool, how we are going to measure the process. And this was very clear, it was to improve the process. It was not going in a very punitive way or something like that. We wanted to improve our process, and everyone wants to improve. Actually, the next day, all the engineers were asking me for access to the tools so they could see their metrics and how they could improve them.
Dalia Havens: I’ve had an experience with an established team where it…the team was not talking about them being blocked to ship. And it was because we had metrics that we could see our week-to-week trend. And we’re like, “This is weird. For some reason, all of a sudden, we are not able to get things to production. Let’s talk about it.” So I found that it’s a really, really great way to be transparent and honest with everyone on the team. And also disarms sort of that tension. Because at the end of the day, just like all the the monitoring tools we have in infra, it’s to allow us to improve and iterate and create a better environment for development.
Innovation can be game-changing or destructive — make sure you’re moving in the right direction.
Edith Harbaugh: I think innovation in and of itself is a hard word. I think there’s the bright shiny answer that innovation is game-changing stuff that moves the business forward. The flip of that coin is innovation is sometimes harmful and destructive. And you don’t really know sometimes until you flip that coin, what way it’s going to land.
Dalia Havens: A product full of bells and whistles that are not really giving a seamless user experience is not going to be as effective or as useful to the potential end-user as one that is more thought out…Innovation is a big word for us. What I translate that to is iteration. Are we able to iterate? Are we able to learn? Do we have the tools to be able to learn to gradually get things out, or to decide on killing something? …having these tools allows the team to really define what is success or how are they working toward that success metric.
Santiago García: I think is very difficult to innovate in the tech team if you are not aligning with your business, with your customers…For my team, the engineering team, its mission is to deliver value to our customers as fast as we can, with the best quality.
To learn how to start gathering insights from your own data, request a consultation.


What is Cycle Time?
One of the more important metrics we look at for our own engineering team, as well as for the engineering teams using Code Climate's Software Engineering Intelligence (SEI) platform, is Cycle Time. Cycle Time is a rough measure of process speed. We’ll explore the definition in more depth, but first, it’s important to understand…
Why Does Cycle Time Matter?
Cycle Time is engineering’s speedometer. Measuring and improving on Cycle Time can help you innovate faster, outrun your competition, and retain top talent. Cycle Time even has implications beyond engineering — it’s also an important indicator of business success.
And yet, a number of engineering organizations practicing lean and/or agile development seem satisfied having their process be proof enough that they care about speed and are moving quickly. And, yet, these teams are likely not measuring any kind of speed. Or worse, they are using metrics more likely to lead to dysfunction than speed.
Mary and Tom Poppendieck, who popularized the idea of applying lean manufacturing principles to software engineering, discuss this phenomenon, specifically for Cycle Time, in their book Lean Software:
“Software development managers tend to ignore Cycle Time, perhaps because they feel that they are already getting things done as fast as they can. In fact, reducing batch sizes and addressing capacity bottlenecks can reduce Cycle Time quite a bit, even in organizations that consider themselves efficient already.”
In other words, rather than trust your gut that you’re moving as fast as possible, why not supplement your understanding with a quantitative measure? As with other metrics, tracking Cycle Time can reduce bias and provide a trustworthy baseline from which to drive improvement.
Back To: What is the Definition of Cycle Time?
Since the term originates in Lean Manufacturing, where “start” and “end” can be unambiguously defined, it’s not always obvious how to apply it to software engineering. Starting at the end of this process, the delivery, is in some ways the easiest: delivery of software is the deployment of production code.
The beginning of the process is more difficult to define. Asking when software development begins is an almost philosophical question. If you’re doing hypothesis-driven product work and are testing your hypothesis, has work started? In his book Developing Products in Half the Time, to illustrate the inherent ambiguity, Donald Reinertsen calls this phase the “fuzzy front end.”
This is why we tend to see development broken into two phases, design and delivery, where design encapsulates activities prior to writing code. Since the delivery phase has a more regular and reliable cadence — and is more completely within engineering’s control — it’s better suited to regular observation and measurement.1
Here at Code Climate, when we discuss Cycle Time, we’re usually referring to “Code Cycle Time,” which isolates the delivery phase of the software development process.
With that in mind, we define Cycle Time as the period of time during which code is “in-flight.” That period may be slightly different depending on an organization’s workflow. Some engineering teams might define Cycle Time as the time between a developer’s first commit in a section of code and when that code is deployed, while others will find it more useful to track the time from when a commit is first logged to when it is merged.
Ultimately, the goal is to quantify and understand the speed at which an engineering team can deliver working software, so the exact definition of Cycle Time you use is not important, as long as you’re consistent across your organization. The key to measuring Cycle Time is the directionality of the metric. You want an objective picture of how quickly your engineering department is moving, whether it’s getting faster or slower, and how specific teams compare to the rest of the department or others in your industry.
What Can Measuring Cycle Time Do for You?
Measuring and improving Cycle Time will boost your engineering team’s efficiency. You’ll deliver value to your users more quickly, which will shorten the developer-user feedback loop and can help you stay ahead of your competition.
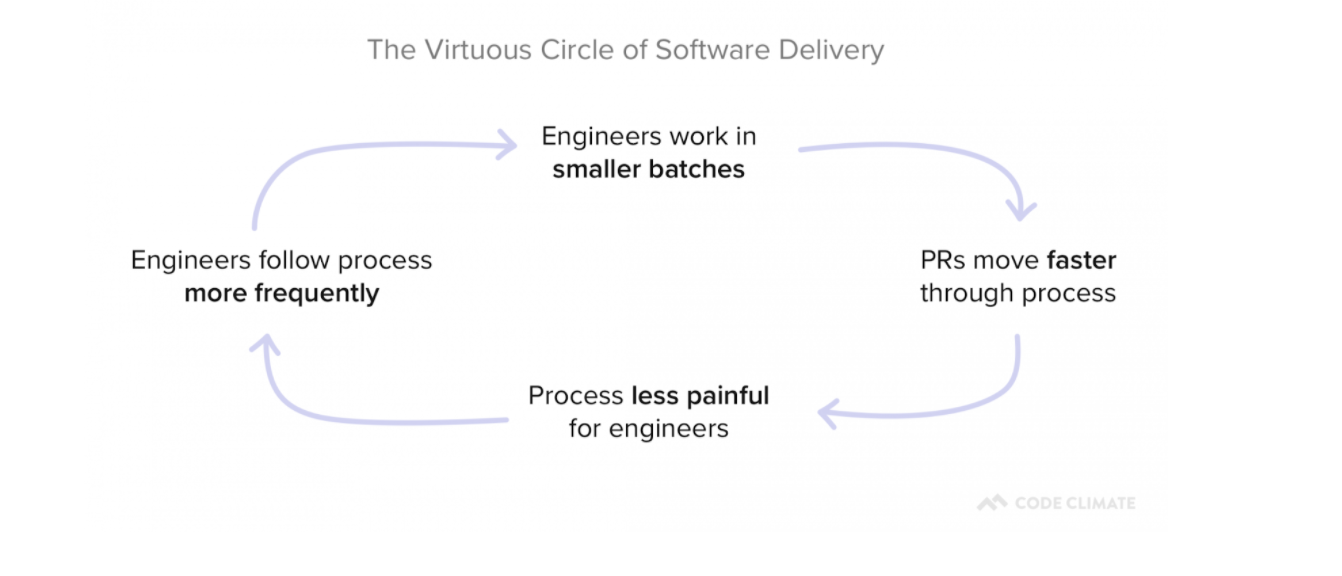
In addition, as you remove roadblocks from your development process, you’ll also reduce sources of frustration for your developers. This can have a positive impact on developer happiness and will set in motion a Virtuous Circle of Software Delivery, in which developers reap the benefits of optimization and are motivated to find even more ways to improve.
What’s Next?
Hopefully, you now have a better understanding of what Cycle Time is and why it matters. As a next step, you’re probably starting to think about ways to effectively minimize Cycle Time.
We took a data-driven approach to this question and analyzed thousands of pull requests across hundreds of teams. The results were interesting.
We turned that data into a tactical resource, The Engineering Leader’s Guide to Cycle Time, which offers a research-backed approach to minimizing Cycle Time.
If you’re interested in learning more about the origins of Cycle Time in Software Engineering, Mary and Tom Poppendieck’s book Lean Software, Chapter 4 “Deliver as Fast as Possible” is a great starting point.
If you would like to start tracking your own Code Cycle Time, request a consultation.
Related Resources
- What Data Science Tells Us About Shipping Faster
- The Engineering Leader’s Guide to Cycle Time
- Round Table: Perspectives on Cycle Time
Cycle Time in Lean Manufacturing
- “Takt Time – Cycle Time” – Describes some fundamental misconceptions around these terms. (Fittingly, the post includes a now 8-year running comment thread.)
- “How to Measure Cycle Times – Part 1”
- “How to Measure Cycle Times – Part 2”
Cycle Time in Software Engineering
- Lead time versus Cycle Time – Untangling the confusion
- The difference between Cycle Time and Lead Time… and why not to use Cycle Time in Kanban
- Measuring Process Improvements – Cycle Time?
Related Terminology
- Takt Time
- Lead Time
- Wait Time
- Move Time
- Process Time
- Little’s Law
- Throughput
- WIP
1 Thank you to Accelerate: Building and Scaling High Performing Technology Organizations, by Nicole Forsgren, Jez Humble and Gene Kim for the Donald Reinertsen reference, as well as the articulation of software development as having two primary phases (Chapter 2, p. 14 “Measuring Software Delivery Performance”). Accelerate is an excellent resource for understanding the statistical drivers behind software engineering. We were proud to have Nicole Forsgren speak at our Second Annual Code Climate Summit.