Resources & Insights
Featured Article
Navigating the world of software engineering or developer productivity insights can feel like trying to solve a complex puzzle, especially for large-scale organizations. It's one of those areas where having a cohesive strategy can make all the difference between success and frustration. Over the years, as I’ve worked with enterprise-level organizations, I’ve seen countless instances where a lack of strategy caused initiatives to fail or fizzle out.
In my latest webinar, I breakdown the key components engineering leaders need to consider when building an insights strategy.
Why a Strategy Matters
At the heart of every successful software engineering team is a drive for three things:
- A culture of continuous improvement
- The ability to move from idea to impact quickly, frequently, and with confidence
- A software organization delivering meaningful value
These goals sound simple enough, but in reality, achieving them requires more than just wishing for better performance. It takes data, action, and, most importantly, a cultural shift. And here's the catch: those three things don't come together by accident.
In my experience, whenever a large-scale change fails, there's one common denominator: a lack of a cohesive strategy. Every time I’ve witnessed a failed attempt at implementing new technology or making a big shift, the missing piece was always that strategic foundation. Without a clear, aligned strategy, you're not just wasting resources—you’re creating frustration across the entire organization.
Sign up for a free, expert-led insights strategy workshop for your enterprise org.
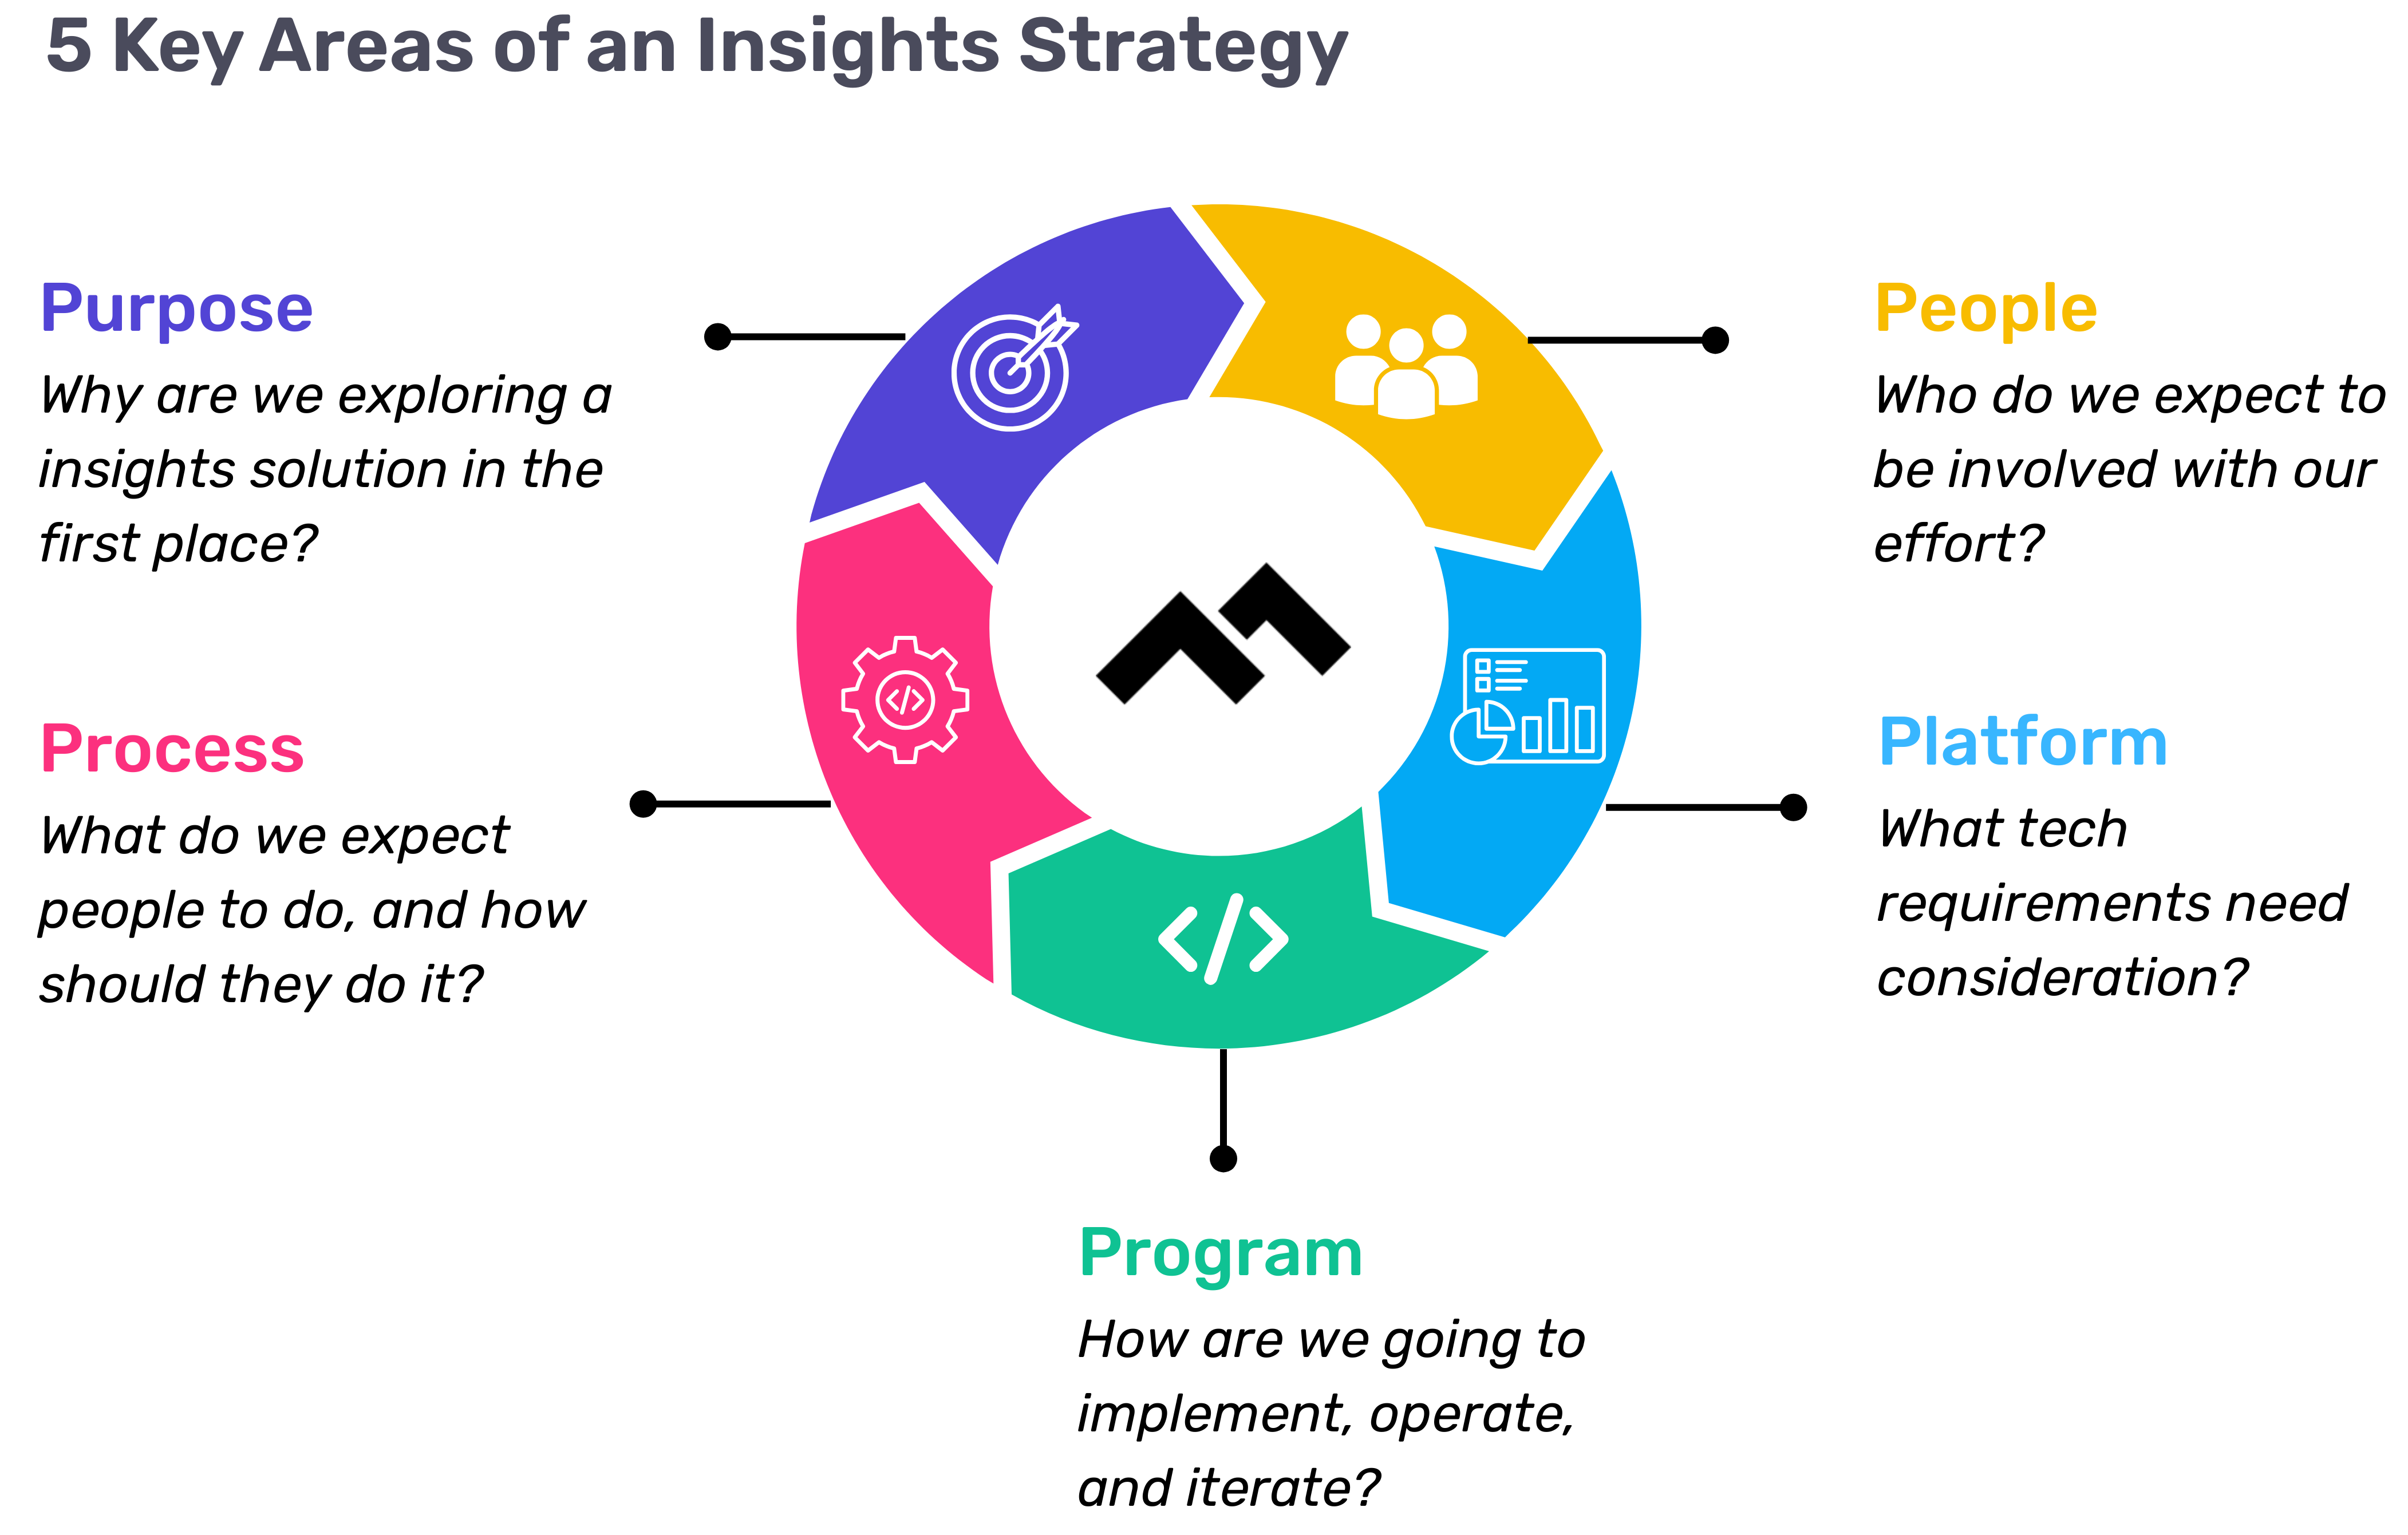
Step 1: Define Your Purpose
The first step in any successful engineering insights strategy is defining why you're doing this in the first place. If you're rolling out developer productivity metrics or an insights platform, you need to make sure there’s alignment on the purpose across the board.
Too often, organizations dive into this journey without answering the crucial question: Why do we need this data? If you ask five different leaders in your organization, are you going to get five answers, or will they all point to the same objective? If you can’t answer this clearly, you risk chasing a vague, unhelpful path.
One way I recommend approaching this is through the "Five Whys" technique. Ask why you're doing this, and then keep asking "why" until you get to the core of the problem. For example, if your initial answer is, “We need engineering metrics,” ask why. The next answer might be, “Because we're missing deliverables.” Keep going until you identify the true purpose behind the initiative. Understanding that purpose helps avoid unnecessary distractions and lets you focus on solving the real issue.
Step 2: Understand Your People
Once the purpose is clear, the next step is to think about who will be involved in this journey. You have to consider the following:
- Who will be using the developer productivity tool/insights platform?
- Are these hands-on developers or executives looking for high-level insights?
- Who else in the organization might need access to the data, like finance or operations teams?
It’s also crucial to account for organizational changes. Reorgs are common in the enterprise world, and as your organization evolves, so too must your insights platform. If the people responsible for the platform’s maintenance change, who will ensure the data remains relevant to the new structure? Too often, teams stop using insights platforms because the data no longer reflects the current state of the organization. You need to have the right people in place to ensure continuous alignment and relevance.
Step 3: Define Your Process
The next key component is process—a step that many organizations overlook. It's easy to say, "We have the data now," but then what happens? What do you expect people to do with the data once it’s available? And how do you track if those actions are leading to improvement?
A common mistake I see is organizations focusing on metrics without a clear action plan. Instead of just looking at a metric like PR cycle times, the goal should be to first identify the problem you're trying to solve. If the problem is poor code quality, then improving the review cycle times might help, but only because it’s part of a larger process of improving quality, not just for the sake of improving the metric.
It’s also essential to approach this with an experimentation mindset. For example, start by identifying an area for improvement, make a hypothesis about how to improve it, then test it and use engineering insights data to see if your hypothesis is correct. Starting with a metric and trying to manipulate it is a quick way to lose sight of your larger purpose.
Step 4: Program and Rollout Strategy
The next piece of the puzzle is your program and rollout strategy. It’s easy to roll out an engineering insights platform and expect people to just log in and start using it, but that’s not enough. You need to think about how you'll introduce this new tool to the various stakeholders across different teams and business units.
The key here is to design a value loop within a smaller team or department first. Get a team to go through the full cycle of seeing the insights, taking action, and then quantifying the impact of that action. Once you've done this on a smaller scale, you can share success stories and roll it out more broadly across the organization. It’s not about whether people are logging into the platform—it’s about whether they’re driving meaningful change based on the insights.
Step 5: Choose Your Platform Wisely
And finally, we come to the platform itself. It’s the shiny object that many organizations focus on first, but as I’ve said before, it’s the last piece of the puzzle, not the first. Engineering insights platforms like Code Climate are powerful tools, but they can’t solve the problem of a poorly defined strategy.
I’ve seen organizations spend months evaluating these platforms, only to realize they didn't even know what they needed. One company in the telecom industry realized that no available platform suited their needs, so they chose to build their own. The key takeaway here is that your platform should align with your strategy—not the other way around. You should understand your purpose, people, and process before you even begin evaluating platforms.
Looking Ahead
To build a successful engineering insights strategy, you need to go beyond just installing a tool. An insights platform can only work if it’s supported by a clear purpose, the right people, a well-defined process, and a program that rolls it out effectively. The combination of these elements will ensure that your insights platform isn’t just a dashboard—it becomes a powerful driver of change and improvement in your organization.
Remember, a successful software engineering insights strategy isn’t just about the tool. It’s about building a culture of data-driven decision-making, fostering continuous improvement, and aligning all your teams toward achieving business outcomes. When you get that right, the value of engineering insights becomes clear.
Want to build a tailored engineering insights strategy for your enterprise organization? Get expert recommendations at our free insights strategy workshop. Register here.Register here.
Andrew Gassen has guided Fortune 500 companies and large government agencies through complex digital transformations. He specializes in embedding data-driven, experiment-led approaches within enterprise environments, helping organizations build a culture of continuous improvement and thrive in a rapidly evolving world.
Navigating the world of software engineering or developer productivity insights can feel like trying to solve a complex puzzle, especially for large-scale organizations. It's one of those areas where having a cohesive strategy can make all the difference between success and frustration. Over the years, as I’ve worked with enterprise-level organizations, I’ve seen countless instances where a lack of strategy caused initiatives to fail or fizzle out.
In my latest webinar, I breakdown the key components engineering leaders need to consider when building an insights strategy.
Why a Strategy Matters
At the heart of every successful software engineering team is a drive for three things:
- A culture of continuous improvement
- The ability to move from idea to impact quickly, frequently, and with confidence
- A software organization delivering meaningful value
These goals sound simple enough, but in reality, achieving them requires more than just wishing for better performance. It takes data, action, and, most importantly, a cultural shift. And here's the catch: those three things don't come together by accident.
In my experience, whenever a large-scale change fails, there's one common denominator: a lack of a cohesive strategy. Every time I’ve witnessed a failed attempt at implementing new technology or making a big shift, the missing piece was always that strategic foundation. Without a clear, aligned strategy, you're not just wasting resources—you’re creating frustration across the entire organization.
Sign up for a free, expert-led insights strategy workshop for your enterprise org.
Step 1: Define Your Purpose
The first step in any successful engineering insights strategy is defining why you're doing this in the first place. If you're rolling out developer productivity metrics or an insights platform, you need to make sure there’s alignment on the purpose across the board.
Too often, organizations dive into this journey without answering the crucial question: Why do we need this data? If you ask five different leaders in your organization, are you going to get five answers, or will they all point to the same objective? If you can’t answer this clearly, you risk chasing a vague, unhelpful path.
One way I recommend approaching this is through the "Five Whys" technique. Ask why you're doing this, and then keep asking "why" until you get to the core of the problem. For example, if your initial answer is, “We need engineering metrics,” ask why. The next answer might be, “Because we're missing deliverables.” Keep going until you identify the true purpose behind the initiative. Understanding that purpose helps avoid unnecessary distractions and lets you focus on solving the real issue.
Step 2: Understand Your People
Once the purpose is clear, the next step is to think about who will be involved in this journey. You have to consider the following:
- Who will be using the developer productivity tool/insights platform?
- Are these hands-on developers or executives looking for high-level insights?
- Who else in the organization might need access to the data, like finance or operations teams?
It’s also crucial to account for organizational changes. Reorgs are common in the enterprise world, and as your organization evolves, so too must your insights platform. If the people responsible for the platform’s maintenance change, who will ensure the data remains relevant to the new structure? Too often, teams stop using insights platforms because the data no longer reflects the current state of the organization. You need to have the right people in place to ensure continuous alignment and relevance.
Step 3: Define Your Process
The next key component is process—a step that many organizations overlook. It's easy to say, "We have the data now," but then what happens? What do you expect people to do with the data once it’s available? And how do you track if those actions are leading to improvement?
A common mistake I see is organizations focusing on metrics without a clear action plan. Instead of just looking at a metric like PR cycle times, the goal should be to first identify the problem you're trying to solve. If the problem is poor code quality, then improving the review cycle times might help, but only because it’s part of a larger process of improving quality, not just for the sake of improving the metric.
It’s also essential to approach this with an experimentation mindset. For example, start by identifying an area for improvement, make a hypothesis about how to improve it, then test it and use engineering insights data to see if your hypothesis is correct. Starting with a metric and trying to manipulate it is a quick way to lose sight of your larger purpose.
Step 4: Program and Rollout Strategy
The next piece of the puzzle is your program and rollout strategy. It’s easy to roll out an engineering insights platform and expect people to just log in and start using it, but that’s not enough. You need to think about how you'll introduce this new tool to the various stakeholders across different teams and business units.
The key here is to design a value loop within a smaller team or department first. Get a team to go through the full cycle of seeing the insights, taking action, and then quantifying the impact of that action. Once you've done this on a smaller scale, you can share success stories and roll it out more broadly across the organization. It’s not about whether people are logging into the platform—it’s about whether they’re driving meaningful change based on the insights.
Step 5: Choose Your Platform Wisely
And finally, we come to the platform itself. It’s the shiny object that many organizations focus on first, but as I’ve said before, it’s the last piece of the puzzle, not the first. Engineering insights platforms like Code Climate are powerful tools, but they can’t solve the problem of a poorly defined strategy.
I’ve seen organizations spend months evaluating these platforms, only to realize they didn't even know what they needed. One company in the telecom industry realized that no available platform suited their needs, so they chose to build their own. The key takeaway here is that your platform should align with your strategy—not the other way around. You should understand your purpose, people, and process before you even begin evaluating platforms.
Looking Ahead
To build a successful engineering insights strategy, you need to go beyond just installing a tool. An insights platform can only work if it’s supported by a clear purpose, the right people, a well-defined process, and a program that rolls it out effectively. The combination of these elements will ensure that your insights platform isn’t just a dashboard—it becomes a powerful driver of change and improvement in your organization.
Remember, a successful software engineering insights strategy isn’t just about the tool. It’s about building a culture of data-driven decision-making, fostering continuous improvement, and aligning all your teams toward achieving business outcomes. When you get that right, the value of engineering insights becomes clear.
Want to build a tailored engineering insights strategy for your enterprise organization? Get expert recommendations at our free insights strategy workshop. Register here.Register here.
Andrew Gassen has guided Fortune 500 companies and large government agencies through complex digital transformations. He specializes in embedding data-driven, experiment-led approaches within enterprise environments, helping organizations build a culture of continuous improvement and thrive in a rapidly evolving world.
All Articles

Your engineering team is a lean, mean, feature-shipping machine. You have a happy and growing customer base. You’re taking customer requests but have a clear product direction. Things are hectic, but good hectic.
Then, the execs decide it’s time to scale. They’re asking your team to increase output by 20%, 50%, 2x, or 10x. And they give a budget of $x to do so.
Most engineering managers put that cash straight into recruiting and hiring. Their team has worked so hard to get this far, so instead of trying to push them to do more in less time, they’re going to double their output by doubling their headcount.
Managers who have experienced scale, however, are wary that growing a team can have diminishing marginal returns. They also know that the processes of their 7-person team aren’t going to work for a 20-person team or a 200-person team. The legwork to prepare for scale is significant so the decisions should be made carefully.
To help you make a well-calculated decision, we put together a cost-benefit analysis of scaling an engineering team, equipped with a spreadsheet Hire Or Optimize Calculator.
The hidden costs of hiring
When you’re working on an agile team, it always feels like you’re just one person short from getting everything done. It’s tempting to take advantage of the opportunity to bring on just one or two more folks to hit a 20% increase in output.
But just like every line of code adds technical debt, every butt-in-seat adds logistical complexity to your team. At the heart of the inefficiencies of scale is the non-linear growth of communication lines:

The complexity of the relationships between individuals grows exponentially with each added team member, which makes it harder for managers to:
- Communicate decisions to team members
- Give team members a voice or input into said decisions
- Execute on a process change (more on this later!)
- Gauge the effectiveness of said process change
Two-way communication between leaders and direct reports is integral to maintain alignment on the team and ensure people feel invested in the work. Without it, you’ll run into expensive problems like burnout, high turnover rate, and slow/inefficient incident recovery.
The measures typically introduced to adjust for scale usually take time away from actual engineering:
- More team meetings that ensure employees understand how their work fits into the larger picture (+30 min/week)
- More 1:1s that ensure employees get face time and opportunity for input with decision makers (+30 min/week)
- More documentation that ensures that information doesn’t get siloed with one person or team members (+15 min/week)
- More reporting that ensures that new changes are being implemented without direct supervision (+15 min/week)
If you added these processes overnight at an inflection point of hiring your 31st engineer, that’s 45 engineering hours lost a week– a loss that’s greater than the return you’re getting from a fully-onboarded engineer. This effect is often described by Brook’s Law: that adding manpower to a late software project will delay it.
Calculate your own cost of hiring
We built a model for you to estimate the costs and benefits associated with engineering hiring over time. Note that we made some simplifications, but as the saying goes, “all models are wrong, but some models are useful.”
The information you’ll need is:
- The # of engineers you’re looking to hire
- The # of engineering managers you’re looking to hire
- The average engineer salary at your organization
- The average manager salary
Inputting our own data, the monthly costs look something like this:
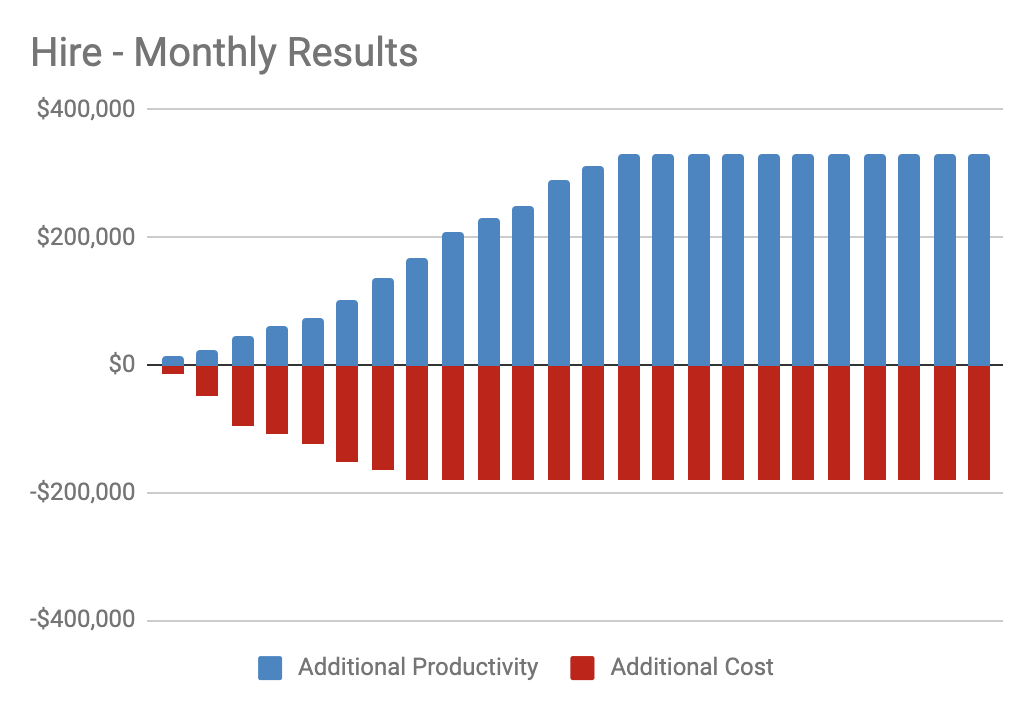
Our “Hire” Results
While the benefit does, in fact, outweigh the cost, we’re looking at a 36% cost increase for a 26% productivity increase. Over time, here are the cumulative results we’d be looking at:
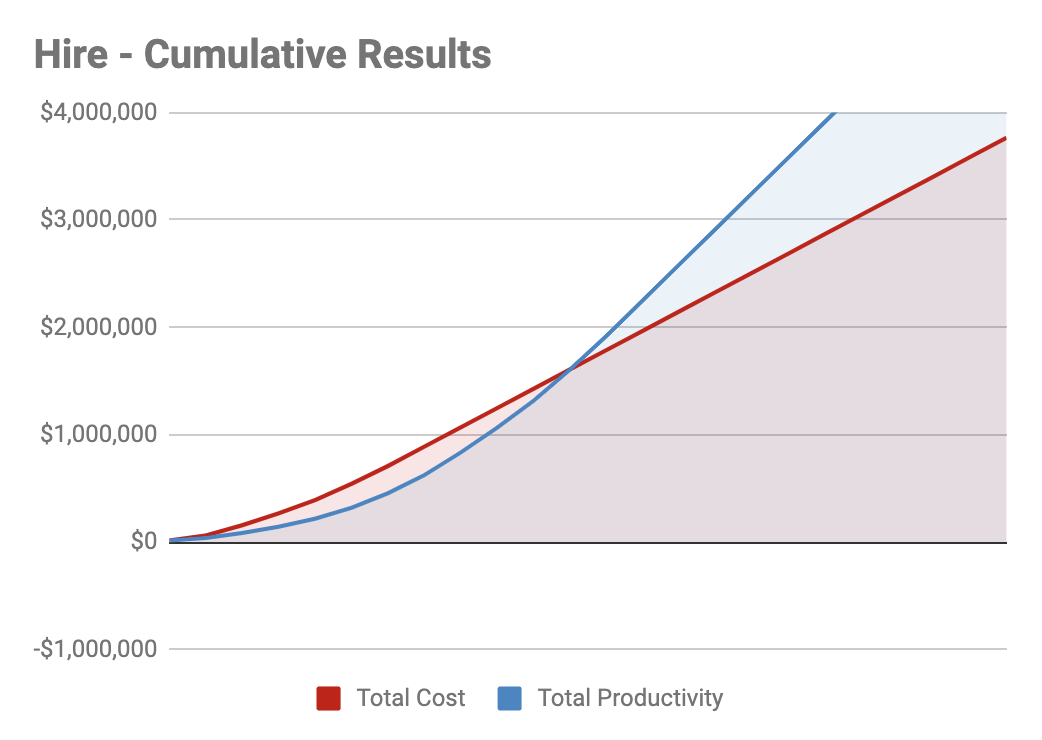
Our Cumulative “Hire” Results
Before committing to such a hefty, upfront cost, consider making your existing processes as lean as possible first. For most managers, this opportunity is much greater than they realize.
Hidden cost of process optimization
There are two common misconceptions about process optimizations:
- That there are few associated costs, and
- Benefits are minimal, often to the point of being trivial
Neither is necessarily true.
Let’s say a manager joins an engineering team and is horrified to find barely any processes in place ensuring continuous delivery. The team calls itself agile, but in reality, everyone is working on an undefined number of projects, and almost no one sticks to the deadlines discussed during planning meetings. The manager might try to force a new structure, equipped with retros, burn down charts, and a more-structured code review process.
All of those changes are good in theory, but making them all at once will drastically affect performance, as team members adjust to the new constraints. If productivity stalls for too long, a manager might pull the plug on the whole overhaul, and get back to their disorganized, but frequent shipping schedule.
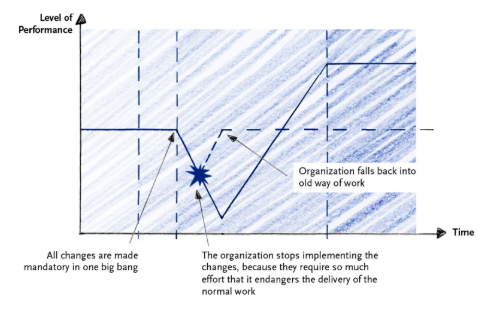
Big process changes require a re-onboarding of every existing team member, each of whom has already found and developed a working process that they believe to be efficient. You can expect your team to dip below its previous productivity level for anywhere from 3-12 months before seeing the effects of those changes.
To mitigate the risk associated with the process change, you can minimize the scope of each change. This “agile” approach to change management ensures that the workflow changes for your team members remain minimal and gives you the ability to roll back anything that isn’t effective without incurring too much loss.
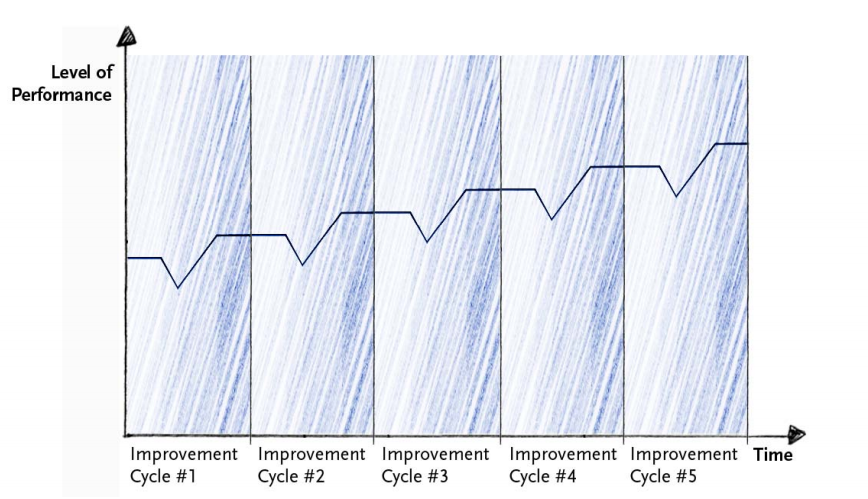
This kind of process optimization can also lead to much more than marginal returns. Just like adding a couple of meetings a week can subtract the equivalence of the productivity of a full-time engineer, the reverse is also true.
If you make small optimizations for each team member, it can boost output significantly. A change that improves the individual output of each developer by just 1%, means a team of 10 will be working 185% faster by the end of just one year.
Calculate your own cost of optimization
Use the same model as above to see the relative costs and benefits from an optimization.
When our engineering department restructured our teams into smaller squads earlier this year, we were aiming for a 20% productivity increase. Here are the kind of costs and benefits we were projecting per month from this optimization:
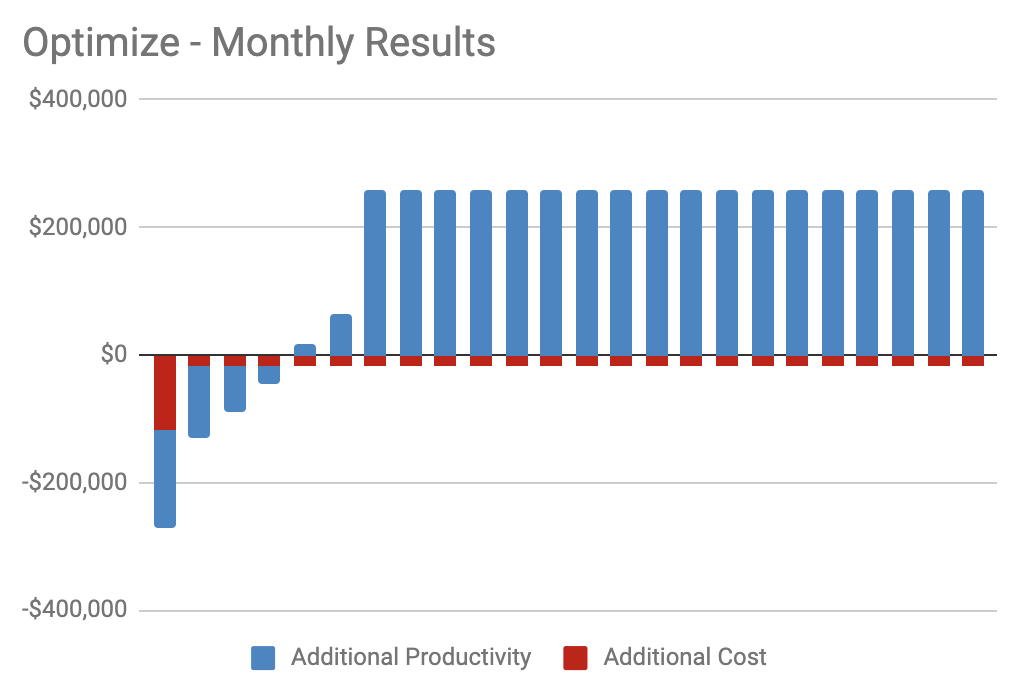
Our “Optimize” Results
Cumulatively, the gains quickly and drastically outpace the costs:
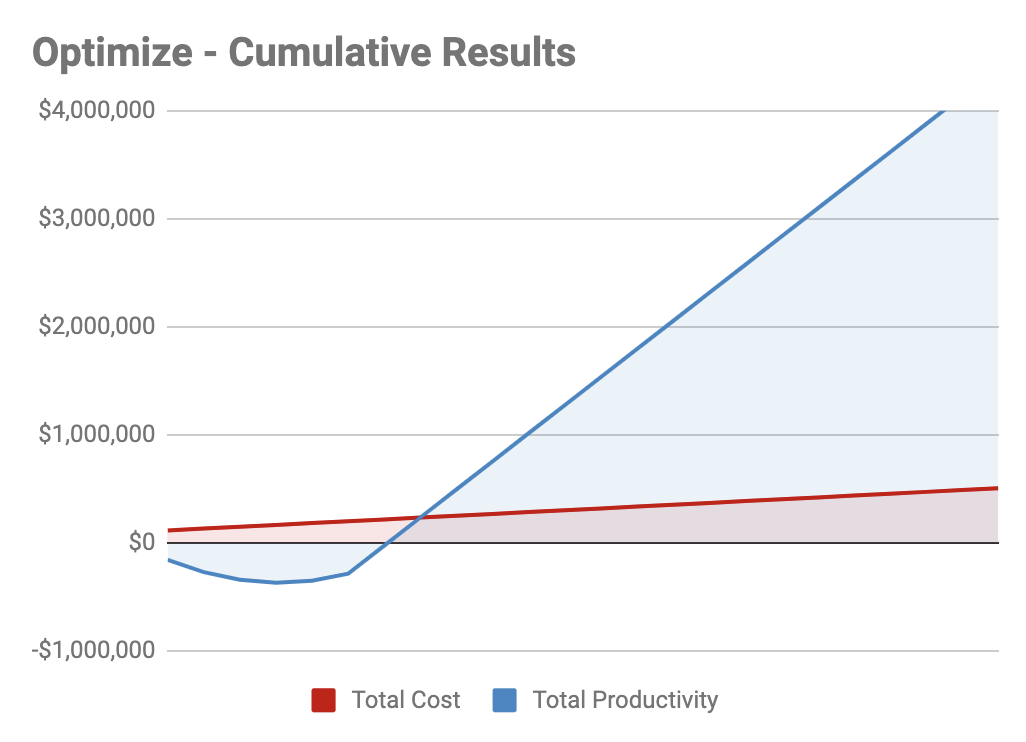
Our Cumulative “Optimize” Results
While hiring means our monthly costs increased 36% for a 25% ongoing increase, here, our monthly costs increase 3% for a 20% ongoing productivity increase. These relative costs illustrate that it is always better to look for opportunities for optimization before hiring.
Engineering processes are invisible, so uncovering opportunities for improvement is rather difficult. This requires quantifying how fast your team is moving and learning the patterns of where work gets stuck along the pipeline.
A Software Engineering Intelligence (SEI) solution like Code Climate can help you understand speed and work habits at a glance, or you can track simple metrics, such as Pull Requests Merged or Commit Volume yourself.
Optimize or hire?
Whether it’s better to (a)optimize or (b)optimize and then hire, depends on your desired outcome. You probably can’t 10x your output by optimizing alone, but before hiring, make sure you’ve taken every advantage of optimization that you can. As your team grows, any process improvement will become more lengthy and expensive.
Schedule a consultation to learn how to maximize engineering impact.
“Effective engineering leadership is being outcome-oriented,” says Kickstarter’s Mark Wunsch.
When Mark first joined Kickstarter as VP of Engineering, one of his first decisions was to re-organize the engineering department, based on business-oriented objectives.
Each 3-7 person scrum team focused on a different “essence,” or a different customer-facing part of the product. This helped engineering understand their work from a business perspective. Mark tells us, “The objective is not to ask, ‘Is the code good?’ but to ask ‘Is Kickstarter good?’”
The engineers’ perspective, however, was difficult to communicate with leadership.
The engineers were constantly bogged down by problems that were invisible to non-technical colleagues, such as legacy code. Kickstarter has been around for about 10 years, so a big portion of the codebase was troublesome to work with. Mark told us, “To an engineer, it’s so obvious when a piece of code is brittle, but it’s really hard to advocate for putting engineering resources into solving technical debt.”
Mark decided to use metrics to further align engineering and leadership.
Diagnosing technical debt with data
Every developer knows that legacy code undoubtedly slows down engineering. But taking weeks away from shipping new features compromises how much new value the company is delivering to customers.
Before making a case for refactoring to leadership, Mark decided to do a deep dive into where technical debt was slowing down the team. He used engineering analytics tool Velocity to learn how each engineering team was working and where they might be getting stuck.
Mark started by looking at his team’s weekly throughput, as measured by merged pull requests. Whenever the throughput dipped significantly below their average, he’d know to investigate further.
Seeing a low Pull Requests/Merged at the end of the week can be a red flag a team was stuck.
Unlike subjective measures that are common on most engineering teams, like story points completed, Velocity metrics are represented by a concrete unit of work: the Pull Request. This enables Mark to objectively understand when a scrum team is really bogged down, compared to the last sprint or last month.
Once he spotted productivity anomalies, Mark would pull up a real-time report of his teams’ riskiest Pull Requests. Pull Requests that were open longer and had a lot of activity (comments and back-and-forths between author and reviewer) were at the top of the list.
An example of Velocity’s Work In Progress which shows the old and active PRs that may be holding up the team.
Because trickier parts of the applications tend to require more substantial changes, pull requests that are most “active” often point Mark to the most troublesome areas of the codebase.
After a few weeks of investigation, Mark was able to find concrete evidence for what his intuition was telling him. “The data showed that we were consistently slowed down because of legacy code,” said Mark.
Bringing transparency to engineering practices
During meetings with the executive team, Mark could now point to weeks with less output and prove that technical debt was impeding the engineering team from their primary business objective: continuously delivering new features.
To communicate how the team was doing, he’d present a Pull Request throughput chart with a trend line:
A Velocityreport showing Pull Requests Merged/Day, over the last 3 months.
This helped leadership visualize how much Kickstarter was growing in their engineering efficiency but also opportunities for further improvement.
Mark also shared Cycle Time (i.e., how quickly code goes from a developer’s laptop to being merged into master.)
A Velocity report that shows the fluctuation of Cycle time, over the last 3 months.
Cycle time was a great indicator of how much trouble it was to make a change to the codebase. High cycle time would often correspond to low output a day or two later, showing that some form of obstruction existed for a developer or team.
These two charts, along with Mark’s summary of his more technical findings, aligned all of leadership around scaling back on new features temporarily and dedicate more time to refactoring.
Bridging engineering and leadership
After spending time investigating what legacy code was slowing down the team, Mark was able to take a strategic approach to how they tackled technical debt.
Rather than jump on the opportunity to fix anything that looked broken, he could have teams focus on the biggest productivity blockers first. Engineers were happy because they had the time to rework the legacy code that was constantly slowing them down. Leadership was happy when they could see long-term improvements in engineering speed. Six months after refactoring, Kickstarter saw a 17% increase in Pull Requests merged and a 63% decrease in Cycle Time. It was a win-win-win.
Mark tells us, “Being able to talk about technical debt in the same way we talk about business metrics is incredibly powerful.”
If you want to learn exactly how much technical debt is slowing down your own engineering team, talk to one of our Velocity product specialists.
Thousands of happy customers validated our software– but dogfooding Velocity validated our values.
A couple of years ago, our engineering leaders were anecdote-driven, like just about everyone else in the industry. We knew how much progress an engineer had made on a new feature because we asked. We knew why we missed a deadline for launching a new feature because we discussed it in our retros.
But we couldn’t answer simple questions like:
- Is our efficiency increasing or decreasing over time?
- What work slows us down and where is the biggest opportunity to improve?
- Which developers on my team are stuck, right now?
Even on a small development team, the insights that we had into our own productivity were limited.
Last year, we launched Velocity, an engineering analytics tool designed to help teams big and small with exactly the issue that we, ourselves, experienced. In the process of iterating and improving the platform, our Engineering Manager, Ale Paredes dogfooded our app. She used each feature from Velocity as soon as it was built and has experienced the benefits ofdata-driven engineeringfirst-hand.
Armed with Velocity, she addressed burnout, improved remote collaboration, and helped restructure the engineering team. The result was an 83% increase in productivity, and a healthier, more engaged dev team.
Here’s what dogfooding Velocity has done for Code Climate.
We Ditched Flat and Near Doubled Our Efficiency
Flat structure doesn’t scale. There comes a point along every engineering team’s growth where the same set up that once built camaraderie and a shared purpose now fuels disengagement and a lack of focus.
Ale first started noticing that disengagement during daily standups. Some people were zoning out; others were on their phones. Almost no discussion was happening. It was 20 minutes of engineers taking turns speaking, one by one. When she brought this up in her 1:1s that week, she found that the team was in unanimous agreement: meetings were inefficient and taking up too much time.
Ale checked her hypothesis against the metrics by looking at Pushes per Day over the last 6 months.
Velocity gave her confirmation that the team’s efficiency had, in fact, been steadily decreasing over the past four months.
Ale took this insight back to the leadership team, and together, they decided it was time to ditch flat. Software development is inherently collaborative, and if engineers have too many co-workers to support, they can’t feel invested in one another’s work.
We decided to break up the ten-person team into groups of three or four engineers. We hypothesized that breaking up teams byBezo’s 2-pizza rulewould help individual engineers focus on less tracks of work. As a result, meetings would suck up less time and be more engaging, as smaller teams only hash out problems relevant to the few people involved.
When Ale implemented this change, the feedback was overwhelmingly positive. Engineers were doing more of what they liked (coding), and less of what they hated (meetings). Over the course of several months, the metrics corroborated what the team was feeling: we started moving much faster.
We went from an average of12 pushes/dayin November to an average of21 pushes/dayin January, an 83% increase.
We Coached Remote Team Members for Better Collaboration
Agile software development relies on strong communication, and, in many cases, frequent face time, so managing team members that are an ocean and three time zones away is nontrivial. It’s hard to perceive frustration through Slack. It’s hard to understand workload through Zoom.
Ale made a concerted effort to check in with remote team members and find out what’s going well and where they might be in need of coaching. But not everyone is an open book– many of her remote team members hesitated to bring up troublesome pull requests or bottlenecks during these meetings.
To find a starting point for these conversation, Ale started looking through a handful of contributor metrics on a weekly basis. She would pay particular attention at overall throughput (# of PRs merged), rework (how often developers work on their own recently merged code), and cycle time (how long it takes code to go from a developer’s laptop to being a merged PR).
By putting together a chart in Velocity, she started noticing a pattern. Remote developers had a significantly higher cycle time than HQ team members.
Before a 1:1 with Legolas Greenleaf, Ale dug deeper into Velocity to see where, exactly, in the PR process contributors were getting stuck.
Ale discovered that Legolas was spending a lot of his time working on code on his laptop before opening up a Pull Request and getting his work looked over.
The next time they sat down, Ale discussed the trend she noticed. The remote team member was able to speak more specifically about what has been slowing him down and what challenges he was facing. In their conversation, she guided Legolas towards learning how he could’ve better approached some of the last few PRs.
Together, they discovered the heart of the problem was that his PRs were too big. Splitting up projects into smaller pieces was a work habit that the HQ team had heard a ton, but the distance between Ale and the remote workers meant they weren’t aligned in terms of best practices. The data brought Ale’s attention to the problem, and gave her something objective to work off for her coaching sessions.
We Prevented Burnout in our Engineers
Meeting deadlines and building great products isn’t the only measure of a good team. We also want engineers to be engaged and not overworked, so that our pace is sustainable. Too often, however, burnout is impossible to sniff out until it’s too late.
Last December, the team was on a tear. We were shipping features every other day, we had redesigned most of the pages in the application, and everyone was stoked about all the cool new stuff we were building. Everything seemed great.
During her weekly check-ins, however, Ale started noticing a trend.
Engineers were excited about their work, but everyone seemed to be feeling a lot of pressure to get features shipped– even though we were ahead of schedule. One senior engineer mentioned that he barely had time for code reviews. Other team members started neglecting pair programming in favor of spending more time getting stuff out the door.
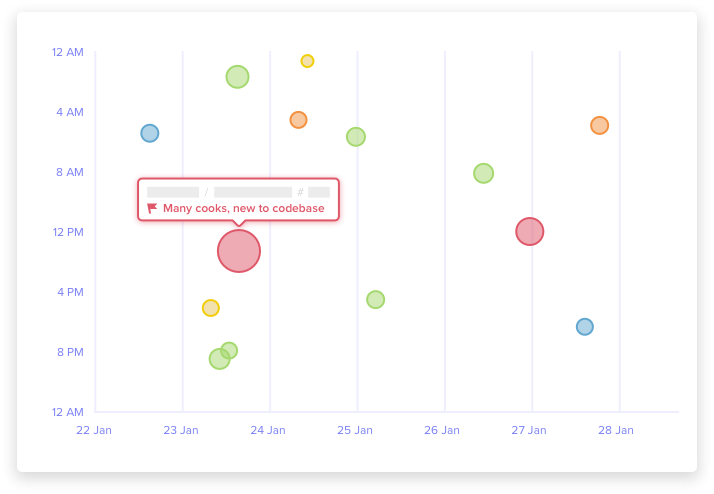
Ale used Velocity to take a look at what the team had on their plate:
She noticed that some developers had so much activity, it barely fit in their row. In a few cases, we were even pushing on weekends, which is highly unusual for our organization.
Looking through all the PRs and reviews the engineering team was churning out, Ale became suspicious that people were working overtime. She put together a report using Velocity’s Reports Builder to see how many pushes were made after 8pm each week:
During the last two weeks, the team had been working late hours more than they had in the previous three months combined. Ale brought this data to the leadership team and was able to successfully advocate scaling back work and giving the engineering team a well-deserved day off.
Now, Ale checks these dashboards regularly and sends out a monthly survey to check in on how work is distributed and how team members are feeling.
Measure and Mobilize
Metrics are not everything. Metrics didn’t help Ale notice that engineers were disengaged during meetings, or that remote team members weren’t voicing problems. Instead, metrics helped helped her check her intuition with more transparency into what’s going on. They also enabled Ale to verify that the changes she made generated an improvement in our productivity.
This gut-check was invaluable in helping us move faster and communicate better, both inside the engineering team and with the organization as a whole.
If you want to learn more on how Velocity can let you see deeper into your team’s work habits (and help you move at least 20% faster), sign up for a demohere.

We last looked at Cycle Time for software engineering to understand what it is and why it matters. Most discussions about Cycle Time end there, leaving a lot of engineering managers frustrated and wanting more. Well-meaning and intelligent engineering managers have theories on which principles drive low cycle time, but very few actually have data to support their hypotheses.
So today we’re going to do just that – we’re going to reveal what we learned about cycle time after analyzing thousands of pull requests from hundreds of teams. In a field full of complexity and nuance, our analysis results were strikingly simple. The primary conclusion we came to was that there’s a single intuitive practice that is highly correlated with low cycle time. But it’s not the one we would have guessed.
The Data
Before we get into exactly our findings, let’s talk briefly about the dataset and definitions we used.
As a refresher, Code Cycle Time (a subset of Cycle Time) represents how long code remains “in flight” – written but not yet deployed.
Our data science team analyzed 180,000 anonymized pull requests from 500 teams, representing about 3,600 contributors. We asked the team to determine what correlation exists, if any, between the following software engineering delivery metrics (we called these “drivers”) and Code Cycle Time:
- Time to Open (Days) (from commit to open)
- Time to Review (Days) (from open to review)
- PR Open to Merge (Days)
- Number of Review Cycles
- % of Abandoned Pull Requests
- Pushes per Day
- Pull Request Throughput per Week
While beyond the scope of this post, they used Locally Weighted Generalized Linear Models (GLM) to determine correlations between drivers.
The Results
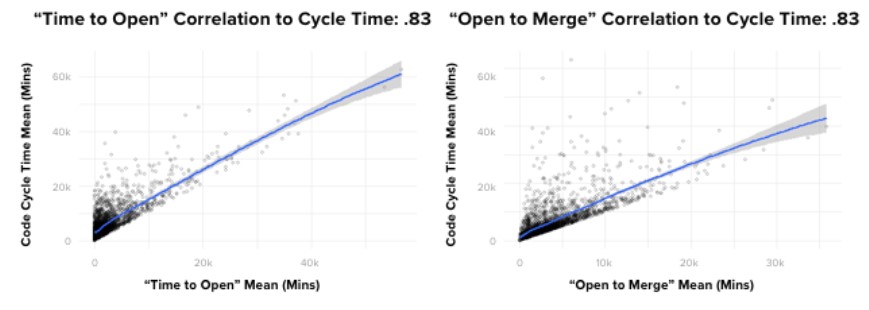
If I had been asked beforehand which of our set of metrics would prove most correlated with cycle time, I would have said, without hesitation, “PR Open to Merge”. Indeed, there is a powerful correlation between these two metrics. However, contrary to what you might think, the data showed that it’s not the most impactful one. Actually, of the drivers we looked at, the metric with the most predictive power on Code Cycle Time was, convincingly, Time to Open.
To give you a better sense of how strong the correlation is, in absolute terms, where a 0 coefficient means “no correlation” and 1 is perfectly correlated, Time to Open and Code Cycle Time had a 0.87 coefficient. This was, in fact, the strongest correlation we found between any two metrics we looked at in our analyses.
Even more striking, Time to Open is more predictive of Code Cycle Time than the length of time the pull request remains open, which means that pull requests that open faster, merge faster.
What can we do with this information?
First, as with most data-driven insights, it can be helpful to marry the results with our intuition.
Code that spends less time on someone’s laptop …
- Is likely small and therefore easier to get reviewed quickly by a single reviewer
- Gets reviewed sooner
- Gets closed sooner if it’s headed in the wrong direction (it happens)
- Signals to other team members the area of the codebase you are working, which can serve to head off painful merge conflicts before they happen
The good news is that Time to Open is a bit easier to influence and understand than the rest of Code Cycle Time, which can get mired in the complexity of collaboration.
Your team probably already hears from you about writing small pull requests, but reinforcing the message helps, and sharing data like the data presented here can help provide transparency and credibility to the recommendation.
One could also consider, carefully and judiciously, whether or not pair programming, in some cases, might improve time to open. This can be particularly helpful for engineers with a tendency (self aware or not) to overthink, overbuild and/or prematurely optimize code.
Closing
The influence of Time to Open on Code Cycle Time is striking. As software engineering professionals, we spend a lot of time discussing ways to optimize and understand the collaborative aspects of software development. This is completely understandable, and does in fact pay dividends. However, the data tells us that in some cases, for some teams, what you should be more likely looking at is your time to open.
Related Resources

Today, we’ll look at three terminal Pull Request outcomes and one way to improve abandoned Pull Requests and increase velocity in your engineering process.
Every Pull Request (PR) has one of three outcomes
Every PR has costs: engineering labor, product management, and opportunity cost, to name a few. Each also has an outcome: merged, closed without merging, or abandoned due to inactivity.
Here’s a look at how PRs fare across the industry:
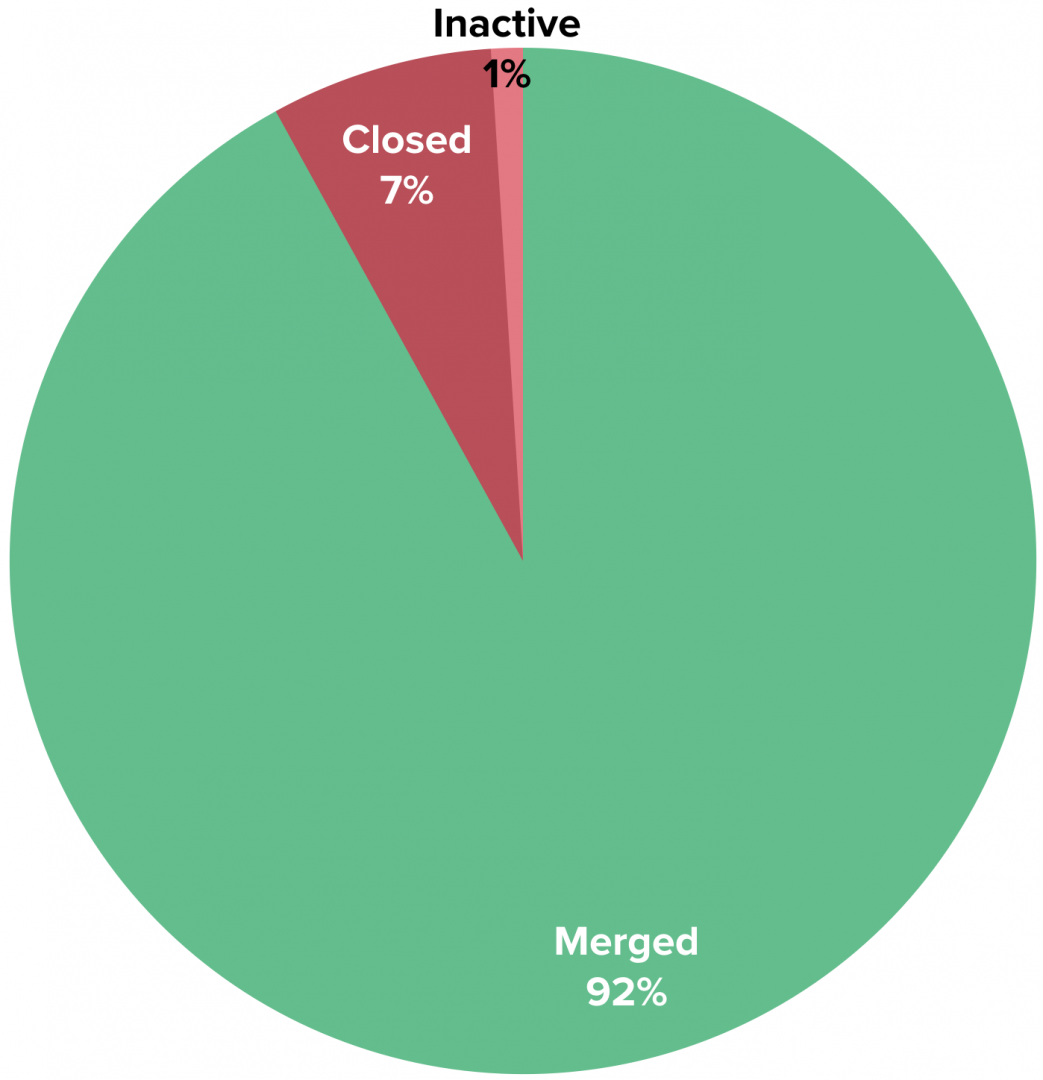
If you group closed and inactive Pull Requests together (“Abandoned PRs”), you can estimate that the average engineer abandons 8% of the Pull Requests they create, which is equivalent to a loss of $24,000 per year1, or the cost of a 2018 Toyota Camry Hybrid.
We consider PRs that have had zero activity for more than three days to be abandoned because our data shows a very low likelihood that PRs that go untouched for so long get merged later.
Achieving zero abandoned Pull Requests is an anti-goal, as it would require being extremely conservative when opening them. However, a high rate of abandoned PRs can indicate inefficiency and opportunity for improvement within an engineering process. Reducing PR loss by 20% on a team with 10 engineers could save $48,000 per year.
How does my team stack up?
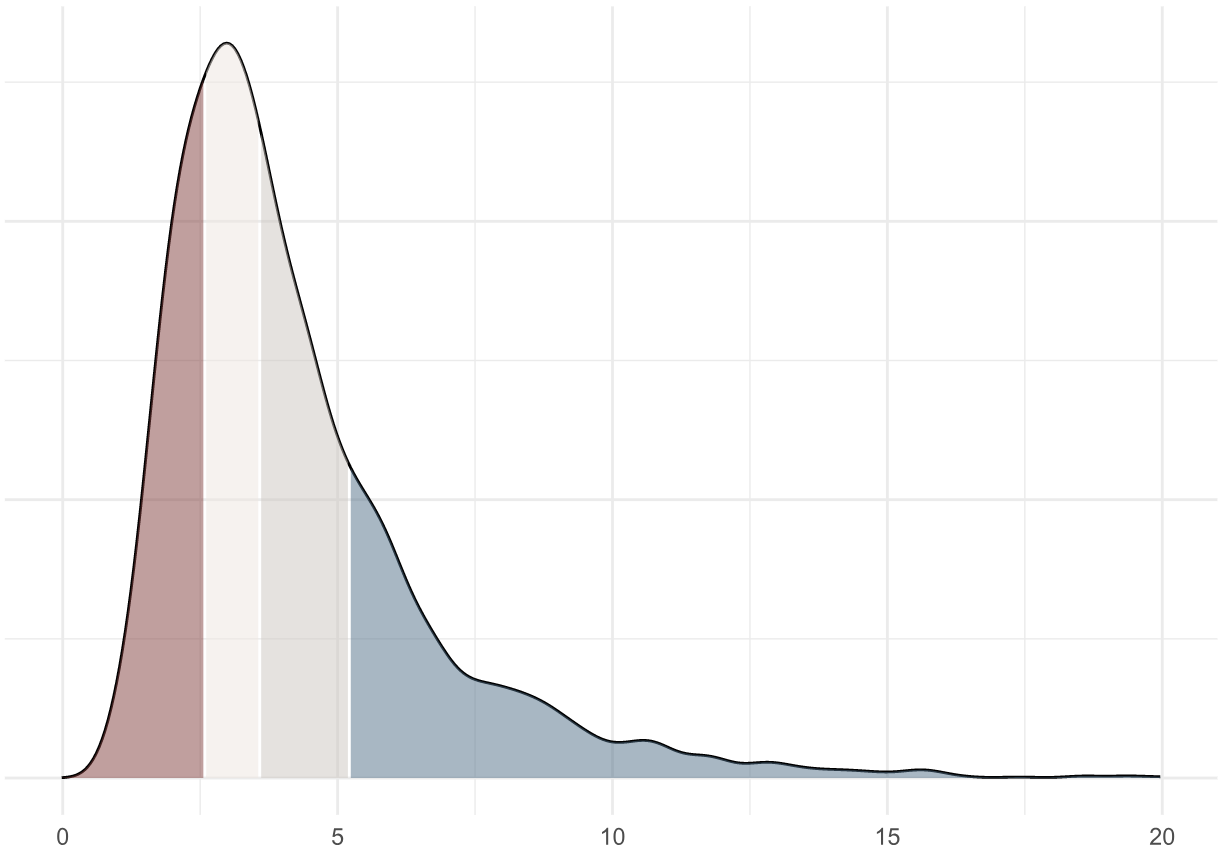
Using an anonymized, aggregated analysis of thousands of engineering contributors, we’re able to get an understanding of how an engineering organization compares to others in the industry:
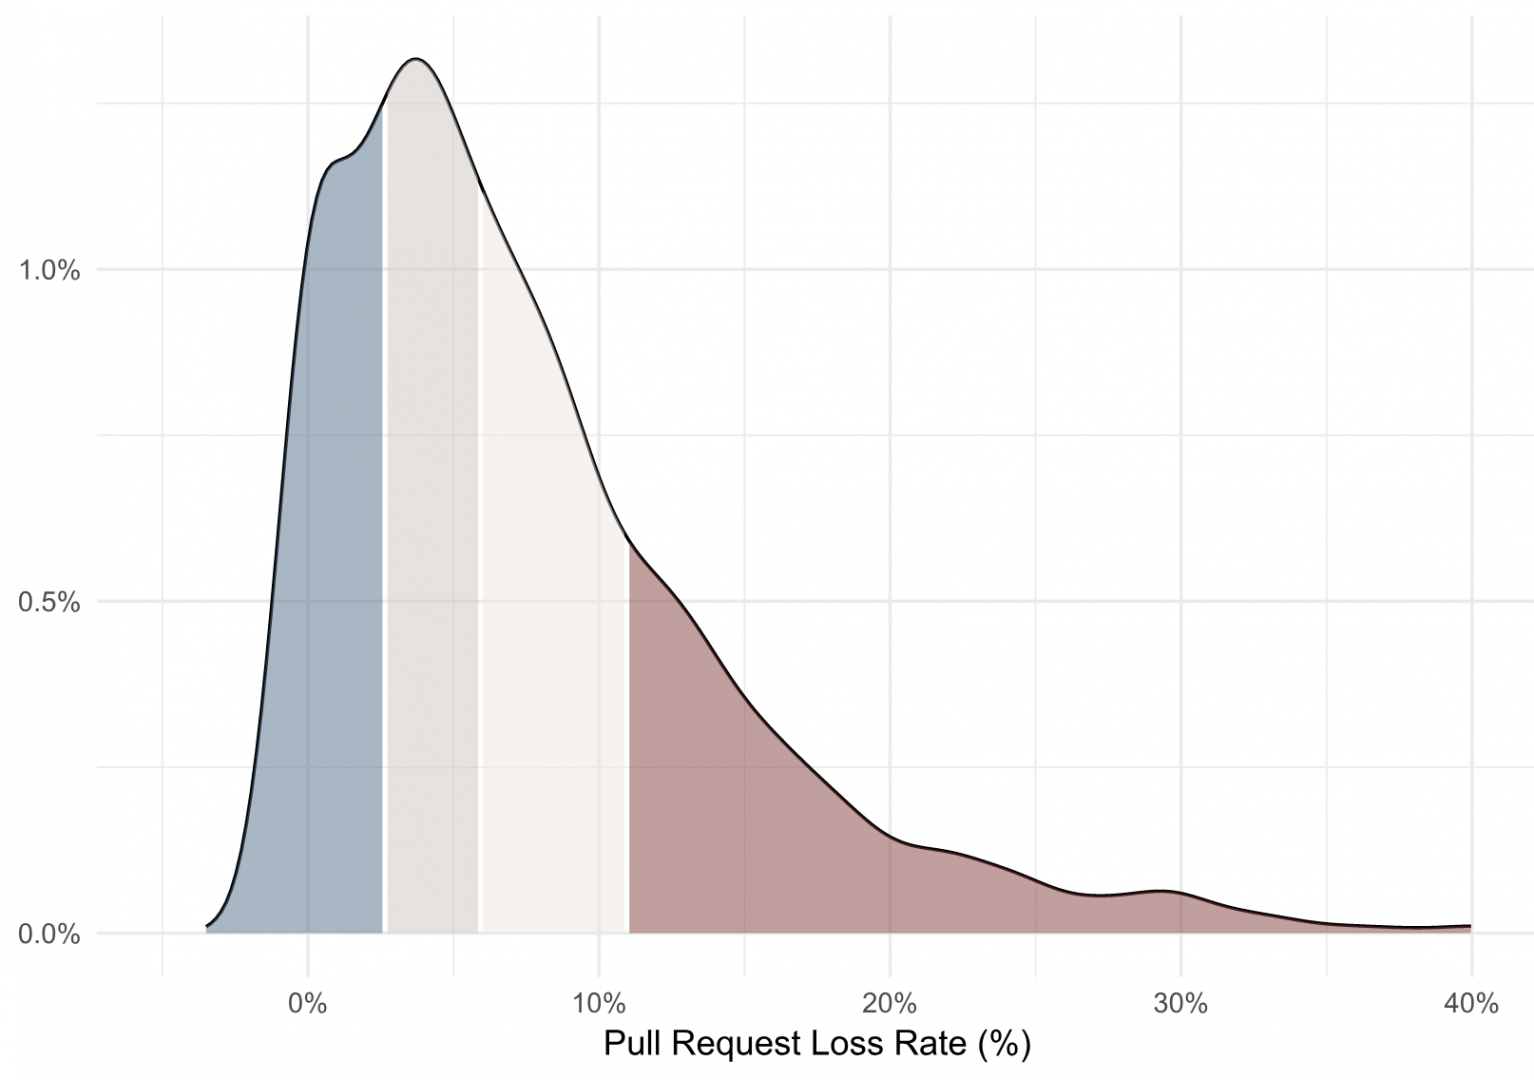
This density plot shows that the average Pull Request loss rate across our dataset is 8% (with a median of 6%). A loss rate above 11% would be in the bottom quartile, and a loss rate below 3% would be upper quartile performance.
Improving Pull Request outcomes
Abandoned Pull Requests are, of course, a lagging indicator. You can tell because it would be ridiculous to go to an engineering team and say, “All those PRs that you’re closing… merge them instead!”
Potential drivers lie upstream: late changing product requirements, shifting business priorities, unclear architectural direction and good ole’ fashioned technical debt. If you have an issue with abandoned Pull Requests, soliciting qualitative feedback is a great next step. Talk to your team. Identify something that is impacting them and talk about how you might avoid it next time. Then, rather than focus on the absolute value of your starting point, you can monitor that your abandonment rate is going down over time.
After all, you’d probably rather not send a brand new Camry to the scrap yard every year.
1 Assumes a fully loaded annual cost of $300k per developer.
Learn how a Code Climate's Software Engineering Intelligence solution can offer visibility into engineering processes and improve your team's PR outcomes. Request a consultation.
With new team insights, industry benchmarks, and more
Our mission at Code Climate is to help engineering organizations improve their processes, teams and code. We see a future where everyone from individual developers up to the CTO has access to a full picture of their engineering work in the form of clear, timely and actionable quantitative data.
In February, we opened our Velocity public beta. Over the past five months, we’ve spoken with hundreds of engineering leaders, processed a nearly-overwhelming amount of product feedback, and added dozens of top-requested features.
We’ve been floored by the excitement from engineering leaders:
“If you haven’t tried @codeclimate’s new Velocity product, and you’re interested in non-vanity measurements of productivity, and a baseline from which to measure process improvements, try it now. It’s very exciting.” – Avi Flombaum, Dean and Chief Product Officer, Flatiron School
“Velocity is quickly becoming one of my favorite tools for engineering management.” – Tomas Becklin, VP of Engineering, DroneBase
Today, Velocity is launching out of beta, and we’re ready to help your engineering organization turn on the lights.
Click here to book a Velocity demo today.
Everyone who books a demo before Thursday, July 26th will receive our introductory launch pricing of 20% off for life. This is a one-time offer that we won’t be repeating anytime soon.
Still on the fence? Keep reading.
Most engineering decisions are anecdote-driven
Today, engineering organizations are often forced to make decisions based solely on anecdotes, gut feel and incomplete information. We understand that qualitative information is highly valuable – there’s no substitute for experience and intuition. However,the lack of quantitative data within engineering processes is a missed opportunity, especially given how data has transformed DevOps.
Historically, engineering organizations looking to incorporate data into their processes have faced two problems.
First, unless they’re working within a behemoth like Google, there simply aren’t enough developer resources to spare to invest in such efforts. This is the problem of “The Cobbler’s children having no shoes,” as analytics has transformed so many departments like sales, marketing, and finance.
Second, even if metrics were available, they would be hard to interpret. After all, if someone told you that your team averages 1.9 review cycles per pull request, is that the best as you could reasonably aim for or an opportunity for improvement?
Get data-driven with Velocity
Velocity helps you unlock the full potential of your engineering organization with data-driven insights to manage risks, eliminate bottlenecks, and drive continuous improvement.
It’s built on one simple notion:The happiest developers work on the most productive teams, and vice versa.Applying these practices, which we call Data-Driven Engineering, puts you in the position to achieve both.
Velocity gives you:
- Custom dashboards and trends– engineering metrics with full historical trends
- Team insights– actionable data to level up your engineering teams
- Industry benchmarks– high impact opportunities for improvement by comparing your metrics against other engineering teams
- Real-time risk alerts– identify and resolve risks before they become problems.
As a software company ourselves, we’re committed to improving the process of engineering, for everyone involved: developers, product managers, executives, and more. Velocity is a core part of our foundation to pursue this goal. If you’re excited about this prospect as well, check out Velocity today:
Click here to book a Velocity demo today.
It takes 10 minutes to set up by connecting to your GitHub (or GitHub Enterprise) account, and soon you’ll have dozens of reports (with full historical data) to easily identify risks and opportunities.
Onward, to a data-driven future!
-Bryan, Noah and the entire Code Climate team
An introduction to Data-Driven Engineering
Welcome to the first installment of Code Climate’s new “Data-Driven Engineering” series. Since 2011, we’ve been helping thousands of engineering organizations unlock their full potential. Recently, we’ve been distilling that work into one unified theme: Data-Driven Engineering.
What’s Data-Driven Engineering?
Data-Driven Engineering applies quantitative data to improve processes, teams, and code. Importantly, Data-Driven Engineering is not:
- Ignoring qualitative data you don’t agree with
- Replacing collaboration and conversations
- Stack ranking or micromanaging developers
Why is this important?
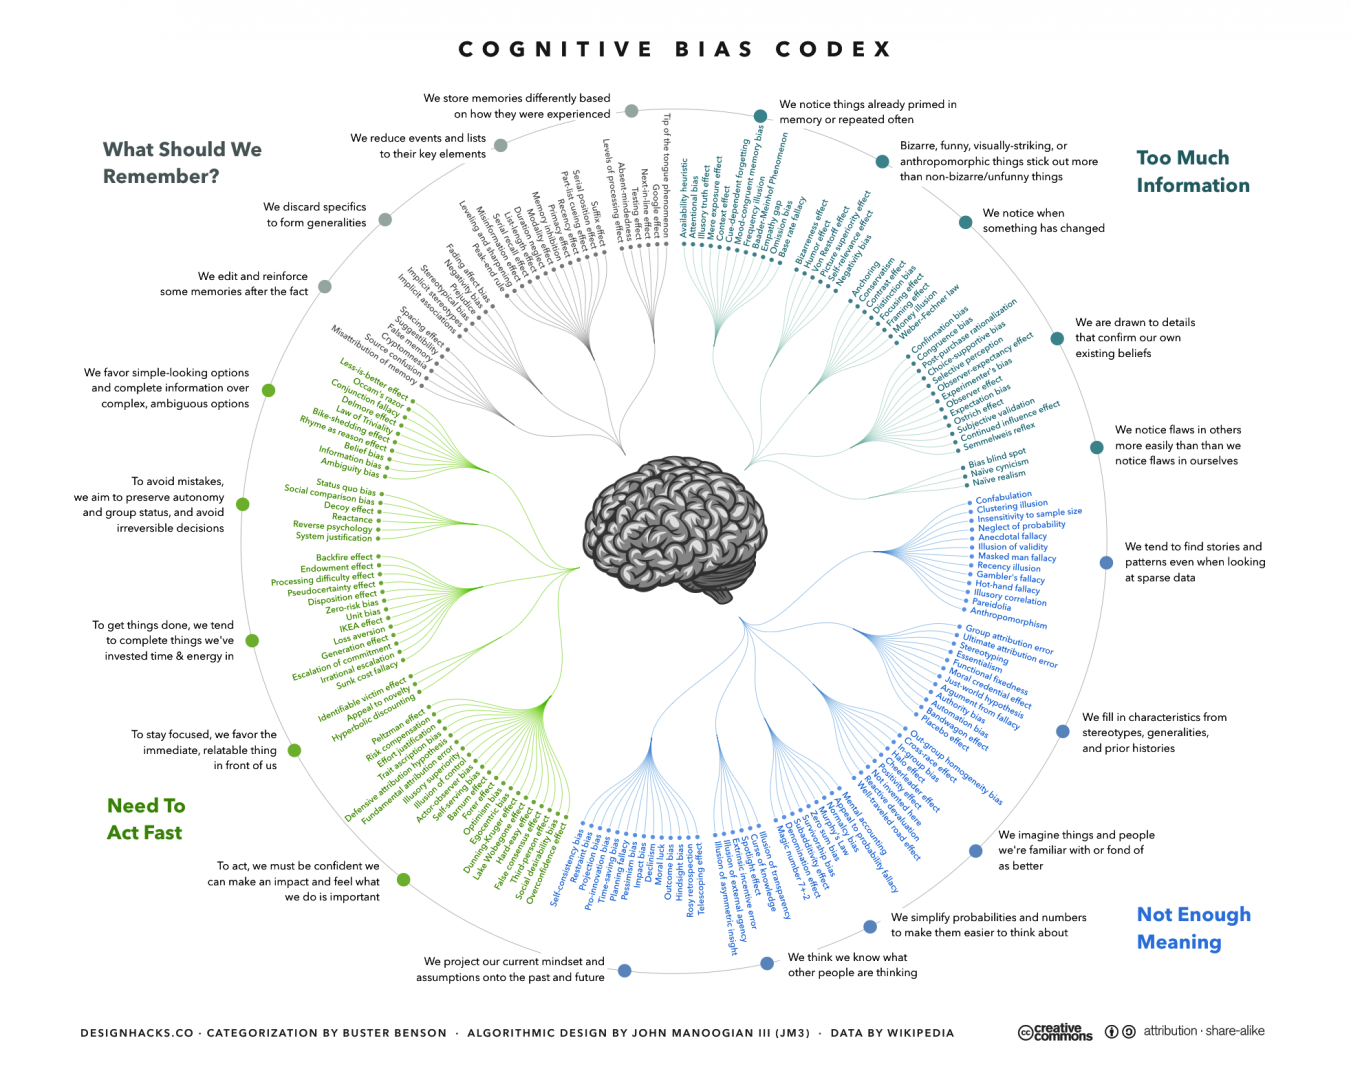
Data-Driven Engineering offers significant advantages compared to narrative-driven approaches. It allows you to get a full picture of your engineering process, receive actionable feedback in real-time, and identify opportunities for improvement through benchmarking. Most importantly, quantitative data helps illuminate cognitive biases, of which there are many.
What can Data-Driven Engineering tell us?
After analyzing our anonymized, aggregated data set including thousands of engineering organizations, the short answer is: a lot.
Over the coming weeks, we’ll explore unique and practical insights to help you transform your organization. We’ll share industry benchmarks for critical engineering velocity drivers to help our readers identify process improvement opportunities. Here’s an example:
Pull requests merged per week (PR throughput) per contributor1
This plot shows that an average engineer merges 3.6 pull requests per week, and a throughput above 5.2 PRs merged per week is in the upper quartile of our industry benchmark.
You might be thinking, “Why do some engineers merge almost 50% more than their peers?”… and that’s exactly the type of questions Data-Driven Engineering can help answer.
1 We included contributors who average 3+ coding days per week from commit timestamps.
Data-driven insights to boost your engineering capacity
Today we’re sharing something big: Code Climate Velocity, our first new product since 2011, is launching in open beta.
Velocity helps organizations increase their engineering capacity by identifying bottlenecks, improving day-to-day developer experience, and coaching teams with data-driven insights, not just anecdotes.
Velocity helps you answer questions like:
- Which pull requests are high risk and why? (Find out right away, not days later.)
- How does my team’s KPIs compare to industry averages? Where’s our biggest opportunity to improve?
- Are our engineering process changes making a difference? (Looking at both quantity and quality of output.)
- Where do our developers get held up? Do they spend more time waiting on code review or CI results?
Why launch a new product?
Velocity goes hand-in-hand with our code quality product to help us deliver on our ultimate mission: Superpowers for Engineering Teams. One of our early users noted:
““With Velocity, I’m able to take engineering conversations that previously hinged on gut feel and enrich them with concrete and quantifiable evidence. Now, when decisions are made, we can track their impact on the team based on agreed upon metrics.” – Andrew Fader, VP Engineering, Publicis
Get started today
We’d love to help you level up your engineering organization. Request a demo here.

We sat down with Jake Hiller, Head of Engineering at Codecademy, to find out how they use Code Climate’s automated code review tool, Quality, to maintain their quality standards while rapidly growing their engineering team.
INDUSTRY Education
EMPLOYEES 50+
DEVELOPERS 20+
LOCATION Manhattan, NY
LANGUAGES Ruby, JavaScript, SCSS
CUSTOMER Since May 2013
"Code Climate keeps our process for creating PRs really low-effort so we can quickly test ideas and ship sooner."
Why Code Climate Quality
Like many rapidly developing teams, Codecademy was running into growing pains for both engineering onboarding and code review. They had tried using local analysis tools but found them cumbersome to integrate as development environments varied across the team.
With an engineering workflow centered around pull request reviews, and a desire to reduce friction in committing and testing code, they needed a solution that would optimize their pull request review process and enable new team members to quickly become productive.
Codecademy had been using Quality for their Ruby stack since 2013. When Head of Engineering, Jake Hiller, joined in early 2015, he saw an opportunity to alleviate their code review and onboarding issues by rolling it out to the whole team.
“We wanted to avoid anything that blocks engineers from committing and testing code. Other solutions that use pre-commit hooks are invasive to both experimentation and the creative process. Code Climate’s flexibility helps us maintain rules that are tailored to our team and codebase, while offering standard maintainability measurements. Plus it enables us to defer checks until code is ready to be reviewed, so we can quickly test ideas and ship sooner.”
“Code Climate helps us transfer knowledge to new engineers – like our coding standards, why we’ve made decisions over time, and why we’ve chosen certain structures and patterns."
Increased speed and quality
Since rolling out to the whole team, Hiller says Codecademy has seen an improvement in the quality of their code reviews and the ease with which new team members get up to speed.
“Code Climate helps us transfer knowledge to new engineers – like our coding standards, why we’ve made decisions over time, and why we’ve chosen certain structures and patterns. New engineers can look through the Code Climate issues in their PR, ask questions, and propose changes and suggestions to the team.
“It’s also increased the speed and quality of our pull request reviews. We’ve been able to spend more time discussing the important functional aspects of our code, and less time debating smaller issues. There are a lot of issues that can’t be fixed with an auto formatter, which is where Code Climate will always be really helpful for our team.”
About Codecademy
Codecademy was founded in 2011 as an immersive online platform for learning to code in a fun, interactive, and accessible way. They’ve helped 45 million people learn how to code, covering a wide variety of programming languages, frameworks, and larger topics like Data Analysis and Web Development. Their recently released Pro and Pro Intensive products provide users with more hands on support and practice material to help them learn the skills they need to find jobs.