Resources & Insights
Featured Article
Navigating the world of software engineering or developer productivity insights can feel like trying to solve a complex puzzle, especially for large-scale organizations. It's one of those areas where having a cohesive strategy can make all the difference between success and frustration. Over the years, as I’ve worked with enterprise-level organizations, I’ve seen countless instances where a lack of strategy caused initiatives to fail or fizzle out.
In my latest webinar, I breakdown the key components engineering leaders need to consider when building an insights strategy.
Why a Strategy Matters
At the heart of every successful software engineering team is a drive for three things:
- A culture of continuous improvement
- The ability to move from idea to impact quickly, frequently, and with confidence
- A software organization delivering meaningful value
These goals sound simple enough, but in reality, achieving them requires more than just wishing for better performance. It takes data, action, and, most importantly, a cultural shift. And here's the catch: those three things don't come together by accident.
In my experience, whenever a large-scale change fails, there's one common denominator: a lack of a cohesive strategy. Every time I’ve witnessed a failed attempt at implementing new technology or making a big shift, the missing piece was always that strategic foundation. Without a clear, aligned strategy, you're not just wasting resources—you’re creating frustration across the entire organization.
Sign up for a free, expert-led insights strategy workshop for your enterprise org.
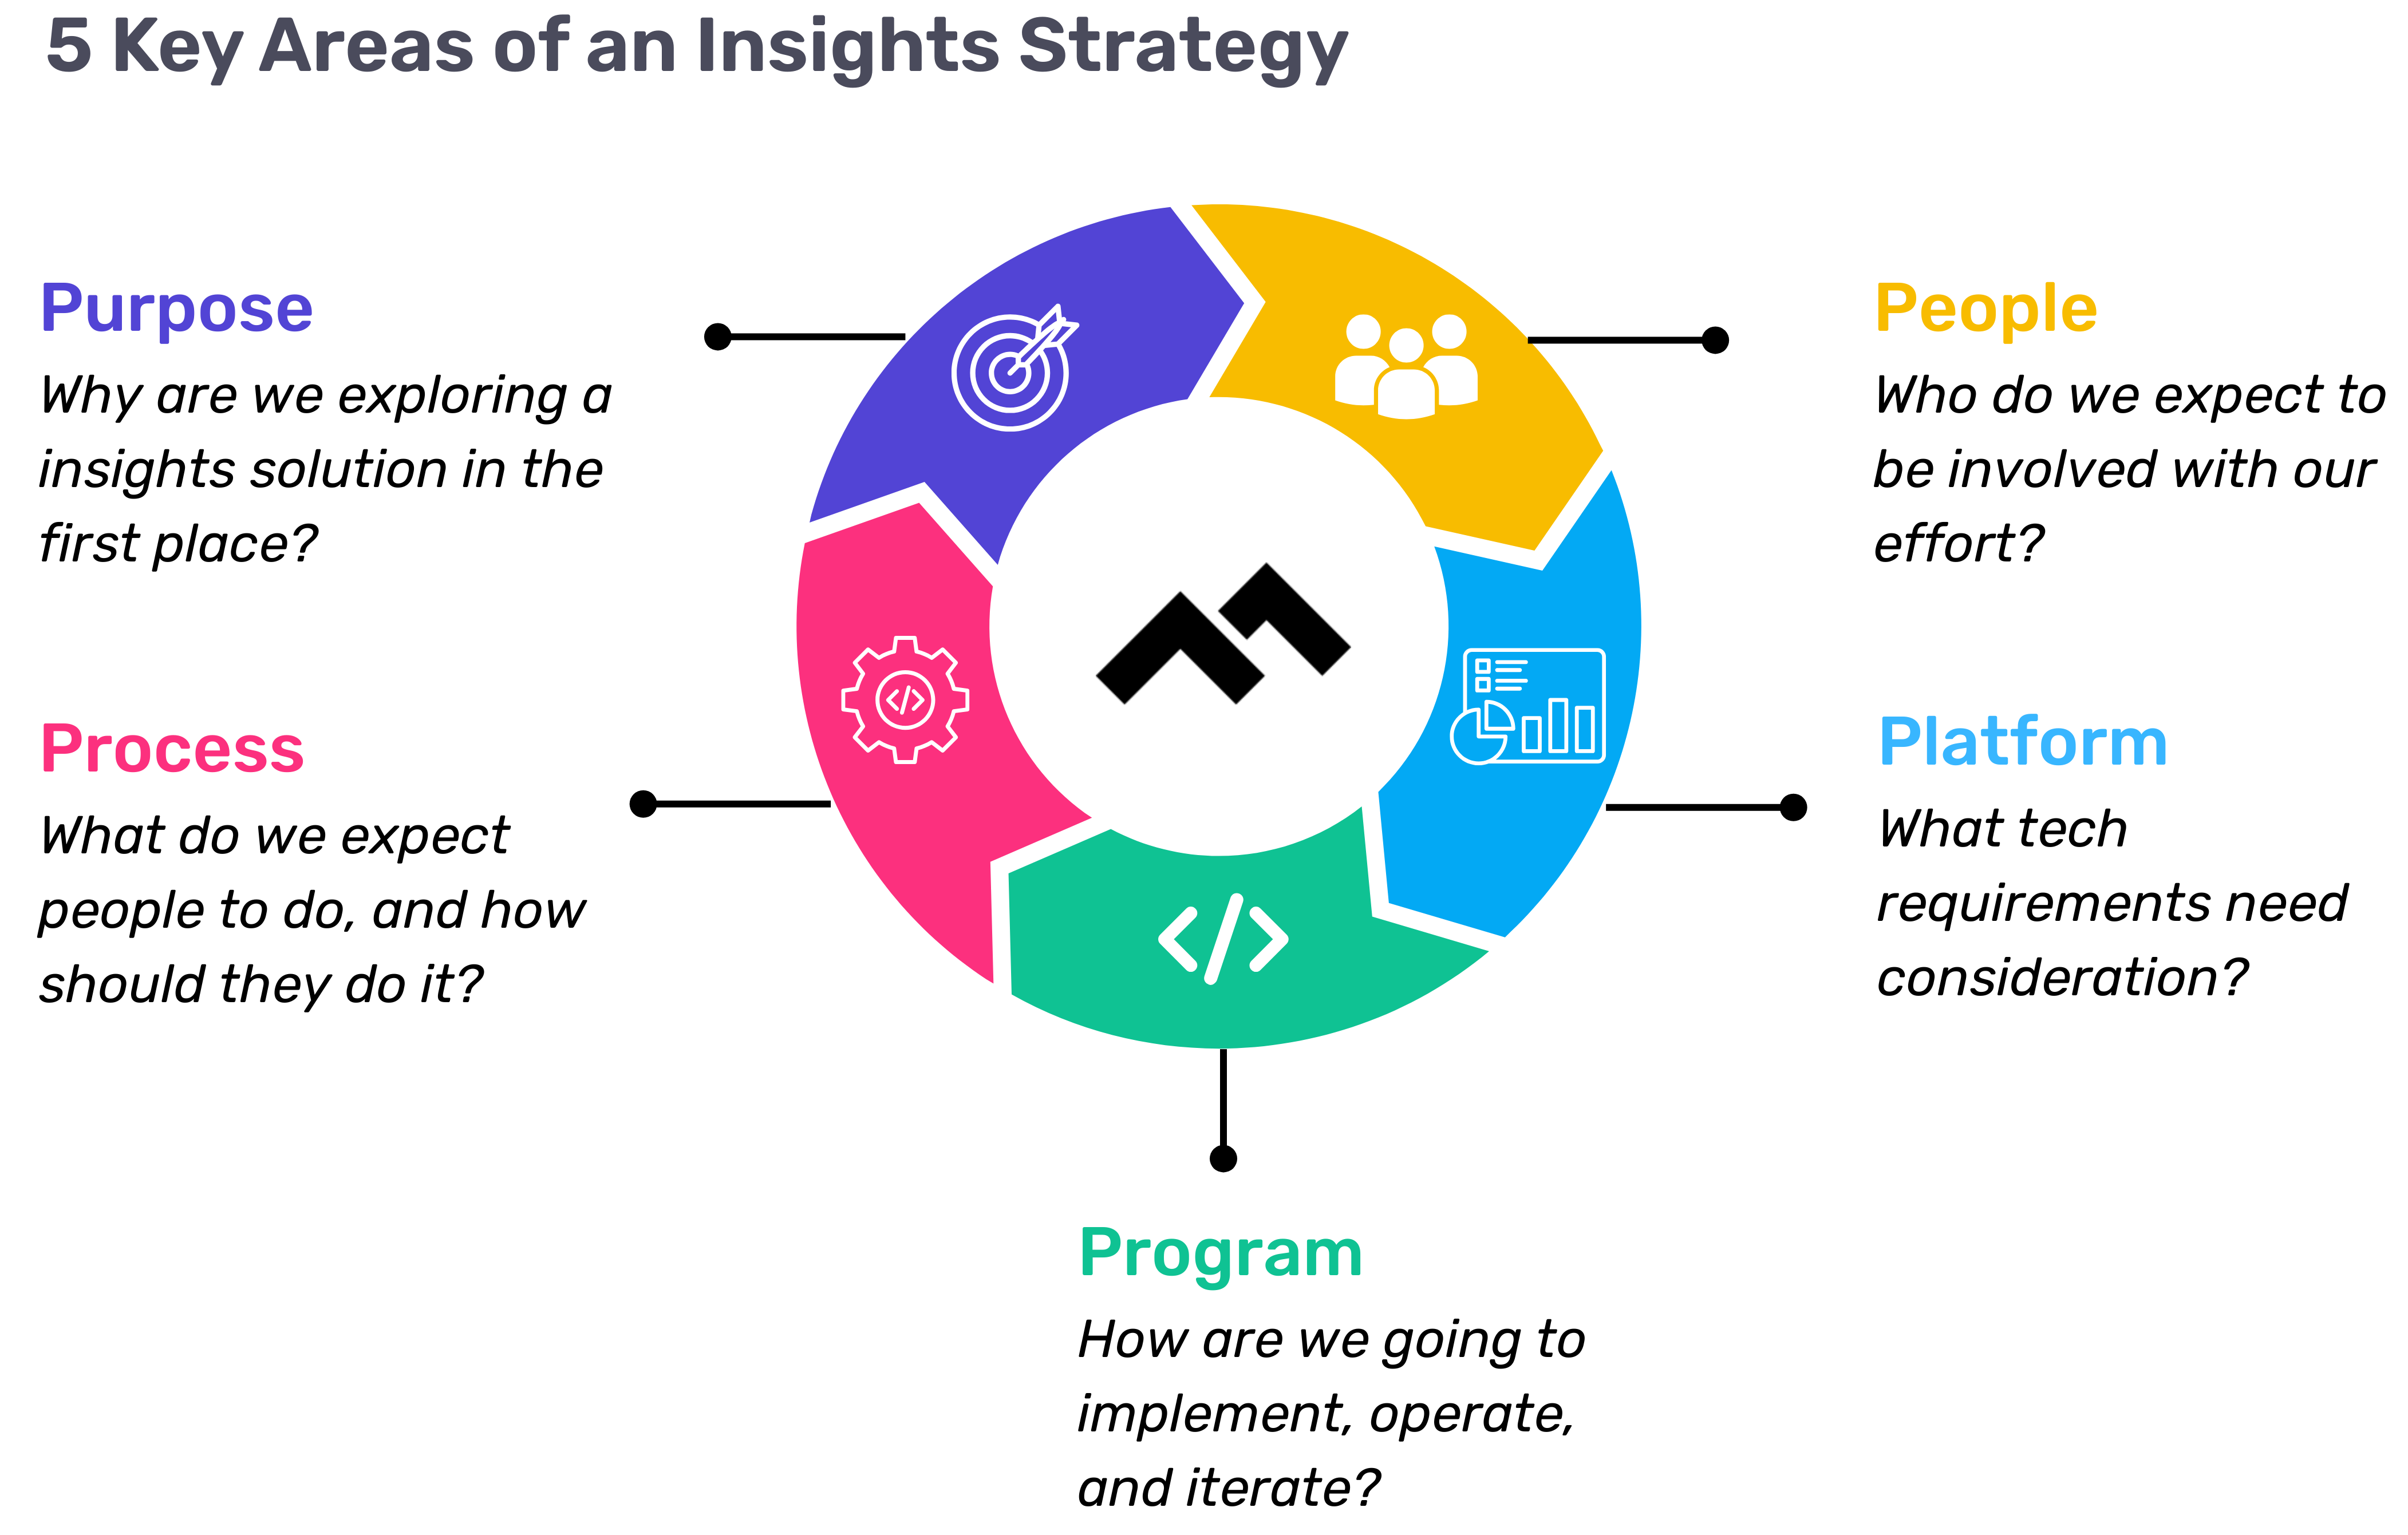
Step 1: Define Your Purpose
The first step in any successful engineering insights strategy is defining why you're doing this in the first place. If you're rolling out developer productivity metrics or an insights platform, you need to make sure there’s alignment on the purpose across the board.
Too often, organizations dive into this journey without answering the crucial question: Why do we need this data? If you ask five different leaders in your organization, are you going to get five answers, or will they all point to the same objective? If you can’t answer this clearly, you risk chasing a vague, unhelpful path.
One way I recommend approaching this is through the "Five Whys" technique. Ask why you're doing this, and then keep asking "why" until you get to the core of the problem. For example, if your initial answer is, “We need engineering metrics,” ask why. The next answer might be, “Because we're missing deliverables.” Keep going until you identify the true purpose behind the initiative. Understanding that purpose helps avoid unnecessary distractions and lets you focus on solving the real issue.
Step 2: Understand Your People
Once the purpose is clear, the next step is to think about who will be involved in this journey. You have to consider the following:
- Who will be using the developer productivity tool/insights platform?
- Are these hands-on developers or executives looking for high-level insights?
- Who else in the organization might need access to the data, like finance or operations teams?
It’s also crucial to account for organizational changes. Reorgs are common in the enterprise world, and as your organization evolves, so too must your insights platform. If the people responsible for the platform’s maintenance change, who will ensure the data remains relevant to the new structure? Too often, teams stop using insights platforms because the data no longer reflects the current state of the organization. You need to have the right people in place to ensure continuous alignment and relevance.
Step 3: Define Your Process
The next key component is process—a step that many organizations overlook. It's easy to say, "We have the data now," but then what happens? What do you expect people to do with the data once it’s available? And how do you track if those actions are leading to improvement?
A common mistake I see is organizations focusing on metrics without a clear action plan. Instead of just looking at a metric like PR cycle times, the goal should be to first identify the problem you're trying to solve. If the problem is poor code quality, then improving the review cycle times might help, but only because it’s part of a larger process of improving quality, not just for the sake of improving the metric.
It’s also essential to approach this with an experimentation mindset. For example, start by identifying an area for improvement, make a hypothesis about how to improve it, then test it and use engineering insights data to see if your hypothesis is correct. Starting with a metric and trying to manipulate it is a quick way to lose sight of your larger purpose.
Step 4: Program and Rollout Strategy
The next piece of the puzzle is your program and rollout strategy. It’s easy to roll out an engineering insights platform and expect people to just log in and start using it, but that’s not enough. You need to think about how you'll introduce this new tool to the various stakeholders across different teams and business units.
The key here is to design a value loop within a smaller team or department first. Get a team to go through the full cycle of seeing the insights, taking action, and then quantifying the impact of that action. Once you've done this on a smaller scale, you can share success stories and roll it out more broadly across the organization. It’s not about whether people are logging into the platform—it’s about whether they’re driving meaningful change based on the insights.
Step 5: Choose Your Platform Wisely
And finally, we come to the platform itself. It’s the shiny object that many organizations focus on first, but as I’ve said before, it’s the last piece of the puzzle, not the first. Engineering insights platforms like Code Climate are powerful tools, but they can’t solve the problem of a poorly defined strategy.
I’ve seen organizations spend months evaluating these platforms, only to realize they didn't even know what they needed. One company in the telecom industry realized that no available platform suited their needs, so they chose to build their own. The key takeaway here is that your platform should align with your strategy—not the other way around. You should understand your purpose, people, and process before you even begin evaluating platforms.
Looking Ahead
To build a successful engineering insights strategy, you need to go beyond just installing a tool. An insights platform can only work if it’s supported by a clear purpose, the right people, a well-defined process, and a program that rolls it out effectively. The combination of these elements will ensure that your insights platform isn’t just a dashboard—it becomes a powerful driver of change and improvement in your organization.
Remember, a successful software engineering insights strategy isn’t just about the tool. It’s about building a culture of data-driven decision-making, fostering continuous improvement, and aligning all your teams toward achieving business outcomes. When you get that right, the value of engineering insights becomes clear.
Want to build a tailored engineering insights strategy for your enterprise organization? Get expert recommendations at our free insights strategy workshop. Register here.Register here.
Andrew Gassen has guided Fortune 500 companies and large government agencies through complex digital transformations. He specializes in embedding data-driven, experiment-led approaches within enterprise environments, helping organizations build a culture of continuous improvement and thrive in a rapidly evolving world.
Navigating the world of software engineering or developer productivity insights can feel like trying to solve a complex puzzle, especially for large-scale organizations. It's one of those areas where having a cohesive strategy can make all the difference between success and frustration. Over the years, as I’ve worked with enterprise-level organizations, I’ve seen countless instances where a lack of strategy caused initiatives to fail or fizzle out.
In my latest webinar, I breakdown the key components engineering leaders need to consider when building an insights strategy.
Why a Strategy Matters
At the heart of every successful software engineering team is a drive for three things:
- A culture of continuous improvement
- The ability to move from idea to impact quickly, frequently, and with confidence
- A software organization delivering meaningful value
These goals sound simple enough, but in reality, achieving them requires more than just wishing for better performance. It takes data, action, and, most importantly, a cultural shift. And here's the catch: those three things don't come together by accident.
In my experience, whenever a large-scale change fails, there's one common denominator: a lack of a cohesive strategy. Every time I’ve witnessed a failed attempt at implementing new technology or making a big shift, the missing piece was always that strategic foundation. Without a clear, aligned strategy, you're not just wasting resources—you’re creating frustration across the entire organization.
Sign up for a free, expert-led insights strategy workshop for your enterprise org.
Step 1: Define Your Purpose
The first step in any successful engineering insights strategy is defining why you're doing this in the first place. If you're rolling out developer productivity metrics or an insights platform, you need to make sure there’s alignment on the purpose across the board.
Too often, organizations dive into this journey without answering the crucial question: Why do we need this data? If you ask five different leaders in your organization, are you going to get five answers, or will they all point to the same objective? If you can’t answer this clearly, you risk chasing a vague, unhelpful path.
One way I recommend approaching this is through the "Five Whys" technique. Ask why you're doing this, and then keep asking "why" until you get to the core of the problem. For example, if your initial answer is, “We need engineering metrics,” ask why. The next answer might be, “Because we're missing deliverables.” Keep going until you identify the true purpose behind the initiative. Understanding that purpose helps avoid unnecessary distractions and lets you focus on solving the real issue.
Step 2: Understand Your People
Once the purpose is clear, the next step is to think about who will be involved in this journey. You have to consider the following:
- Who will be using the developer productivity tool/insights platform?
- Are these hands-on developers or executives looking for high-level insights?
- Who else in the organization might need access to the data, like finance or operations teams?
It’s also crucial to account for organizational changes. Reorgs are common in the enterprise world, and as your organization evolves, so too must your insights platform. If the people responsible for the platform’s maintenance change, who will ensure the data remains relevant to the new structure? Too often, teams stop using insights platforms because the data no longer reflects the current state of the organization. You need to have the right people in place to ensure continuous alignment and relevance.
Step 3: Define Your Process
The next key component is process—a step that many organizations overlook. It's easy to say, "We have the data now," but then what happens? What do you expect people to do with the data once it’s available? And how do you track if those actions are leading to improvement?
A common mistake I see is organizations focusing on metrics without a clear action plan. Instead of just looking at a metric like PR cycle times, the goal should be to first identify the problem you're trying to solve. If the problem is poor code quality, then improving the review cycle times might help, but only because it’s part of a larger process of improving quality, not just for the sake of improving the metric.
It’s also essential to approach this with an experimentation mindset. For example, start by identifying an area for improvement, make a hypothesis about how to improve it, then test it and use engineering insights data to see if your hypothesis is correct. Starting with a metric and trying to manipulate it is a quick way to lose sight of your larger purpose.
Step 4: Program and Rollout Strategy
The next piece of the puzzle is your program and rollout strategy. It’s easy to roll out an engineering insights platform and expect people to just log in and start using it, but that’s not enough. You need to think about how you'll introduce this new tool to the various stakeholders across different teams and business units.
The key here is to design a value loop within a smaller team or department first. Get a team to go through the full cycle of seeing the insights, taking action, and then quantifying the impact of that action. Once you've done this on a smaller scale, you can share success stories and roll it out more broadly across the organization. It’s not about whether people are logging into the platform—it’s about whether they’re driving meaningful change based on the insights.
Step 5: Choose Your Platform Wisely
And finally, we come to the platform itself. It’s the shiny object that many organizations focus on first, but as I’ve said before, it’s the last piece of the puzzle, not the first. Engineering insights platforms like Code Climate are powerful tools, but they can’t solve the problem of a poorly defined strategy.
I’ve seen organizations spend months evaluating these platforms, only to realize they didn't even know what they needed. One company in the telecom industry realized that no available platform suited their needs, so they chose to build their own. The key takeaway here is that your platform should align with your strategy—not the other way around. You should understand your purpose, people, and process before you even begin evaluating platforms.
Looking Ahead
To build a successful engineering insights strategy, you need to go beyond just installing a tool. An insights platform can only work if it’s supported by a clear purpose, the right people, a well-defined process, and a program that rolls it out effectively. The combination of these elements will ensure that your insights platform isn’t just a dashboard—it becomes a powerful driver of change and improvement in your organization.
Remember, a successful software engineering insights strategy isn’t just about the tool. It’s about building a culture of data-driven decision-making, fostering continuous improvement, and aligning all your teams toward achieving business outcomes. When you get that right, the value of engineering insights becomes clear.
Want to build a tailored engineering insights strategy for your enterprise organization? Get expert recommendations at our free insights strategy workshop. Register here.Register here.
Andrew Gassen has guided Fortune 500 companies and large government agencies through complex digital transformations. He specializes in embedding data-driven, experiment-led approaches within enterprise environments, helping organizations build a culture of continuous improvement and thrive in a rapidly evolving world.
All Articles

This post is the fifth and final article in our Tactical Guide to a Shorter Cycle Time five-part series. Read the previous post here.
If developers’ change sets aren’t always deploy-ready upon merging, your team is not practicing Continuous Delivery.
The final step to fully optimizing your time to market (or your Cycle Time) is to indoctrinate seamless deployment, holding every engineer responsible for keeping the main production branch in a releasable state.
Impediments to true Continuous Delivery fall into three categories:
- Process: Your process involves many manual blockers, including QA and manual deployment.
- Behavioral: Your managers or engineers lack confidence. They’re not sure whether defects will be caught before merging or whether their team can respond to issues uncovered after deployment.
- Technical: Your current tooling is either lacking, too slow, or breaks frequently.
This post will walk you through mitigating each obstacle so that you can achieve a deploy-ready culture on your engineering team.
Work through Process Impediments
Transitioning to a CD process requires every person on your development team to spend their time as strategically as possible. This ruthless approach to time management requires automating everything you can in the deployment process— particularly, any manual phases that completely block deployment.
On many teams, the hardest transition is moving away from a process in which humans gate shipping, such as manual QA and security checks. These stamps of approval exist to give your team confidence that they’re not shipping anything that isn’t up to snuff. To eliminate these blockers, you’ll need to address quality concerns throughout your software dev process—not just at the end.
Remove QA as a Blocker to Deployment
The purpose of testing, whether manual or automatic, is to ensure software quality is up to standard. Many of the practices within CD, such as working in small batches and conducting Code Review, inherently serve as quality control measures. Any major defects that your team doesn’t catch during development should be caught with automated testing.
To reduce the risk associated with removing QA as a blocker:
- Automate testing throughout the software development process (not just at the end). Where and what you test will depend on a multitude of factors, but consider testing as early as possible to ensure developers can make changes before putting in too much work.
- Do not overtest. Overtesting may lead to long build times and will simply replace a manual bottleneck with an automated one. We recommend trying to ensure that test coverage is sufficient enough. If an issue isn’t caught and does break in the middle of the night, it doesn’t require waking up an engineer.
- Use feature flags and dark launches. If there are deployment risks that you have not yet mitigated, use feature flags to roll out changes either internally or to a small sample of your customer base. For further research, check out Launch Darkly’s full e-book on Effective Feature Management.
Once you have these components in place, you’ll want to make sure you have an effective monitoring system, where your tools surface issues as quickly as possible. Measuring Mean Time to Discovery (MTTD) alongside Mean Time to Recovery (MTTR) will help you consistently track and improve the efficiency of both, your monitoring and your pre-deploy testing suite.
Shift Security & Compliance Checks left
Security is one of the most important checks before deployment, which is why you shouldn’t leave it open to human error. Enable your security experts to think strategically about what kind of testing they should run, while leaving much of the tactical security work to the machines.
To integrate security throughout your software delivery process, consider:
- Involving security experts into the software planning and design process. Whenever a feature that handles particularly sensitive data is coming down the Continuous Delivery pipeline, include your security team in the planning and design process. This way, security considerations are baked into the process and front-of-mind for the team as they build out the feature.
- Automated source code scanning (SAST): With 80% of attacks aimed at the application layer, SAST remains one of the best ways to keep your application secure. Automated SAST tools detect all of the most threatening application risks, such as broken authentication, sensitive data expose, and misconfiguration.
- Automated dynamic testing (DAST): Frequently called black-box testing, these tests try to penetrate the application from the outside, the way an attacker would. Any DAST tool would uncover two of the most common risks— SQL injection (SQLi) and cross-site scripting (XSS).
- Automated testing for dependence on a commonly-known vulnerability (CVE): The CVE is a dictionary maintained by the Cybersecurity and Infrastructure Security Agency that you can use as a reference to make sure your automated testing has covered enough ground.
- Building secure and reusable infrastructure for the team. With the above covered, your security team can apply their expertise to create tools for the rest of the team in the form of modules or primitives. This way, they’ll enable developers without security training to write systems that are secure by default.
Naturally, there will always be manual work for your security team, such as penetration testing. If you’re folding security into your development process, however, it won’t become a bottleneck at the very end of the process, stopping features from getting out to customers.
Work through Behavioral Impediments
A survey conducted by DevOps Group found that organizational culture is the most significant barrier to CD implementation.
The behavioral change required to foster a culture of Continuous Delivery is the most difficult, yet the least discussed, aspect of adapting true CD practices. Your team needs to have confidence that their testing infrastructure and ability to respond to changes are strong enough to support Continuous Deployment.
To instill this certainty, you’ll need to create alignment around CD benefits and encourage best practices throughout the software delivery process.
Create Organizational Alignment on Continuous Delivery
If properly communicated, the Continuous Delivery pipeline should not be a hard sell to engineers. CD unblocks developers to do what they like most—building useful software and getting it out into the world.
Three intended outcomes will help you get both managers and engineers invested in Continuous Delivery:
- Less risk. If the testing infrastructure is solid (more on this below), and the developers agree that it’s solid, they will feel more comfortable shipping their changes upon merging.
- Higher impact for the individual developer. When developers have the power to merge to production, they feel more ownership over their work. Due to sheer expectations of speed, the Continuous Delivery pipeline minimizes top-down planning and gives developers the ability to make more choices related to implementation.
- Less blame. Because ownership over a feature isn’t siloed in one individual, the software development process becomes much more collaborative. Distributed ownership over features eliminates some of the anxiety (and potential blame) when developers decide to ship their changes to production.
Equip Your Team for Change with Best Practices
Thus far, our Tactical Guide to a Shorter Cycle Time five-part series has included dozens of best practices that you can share with your team. In addition to these phase-specific optimizations, you’ll also want to coach these general principles:
- Work in small, discrete changes. When developers are scoping a Pull Request, they should be thinking: what is the smallest valuable step I can make towards this feature? When they’ve scoped and built that Pull Request, it should be deployed to production. They should avoid long-running feature branches.
- Always prioritize work closest to completion. Have developers minimize work in progress as much as possible. If you’re using a Kanban board, this means prioritizing items that are closest to done.
Don’t be surprised if this transition process takes over six months. The confidence required from your team will take a long time to build as they become accustomed to this new work style. If you’d like to move quickly, adopt CD with a team of early adopters who are already interested and motivated to make a positive change. You can learn from adoption friction in a small environment to better ease the larger organization transition.
Work through Technical Impediments
Your team can’t overcome either behavioral nor process impediments unless they have confidence in their suite of CI/CD tools. Builds that perform automated testing and deployment should be fast and reliable, while your monitoring set up gives you clear and instant visibility into how things are running.
Sharpen Your Tools
You’re not able to ship features to customers multiple times a day, if either:
- Your build is flakey, or
- Your build is slow.
And even if your tests pass, your team won’t have the confidence to set up automatic deployment, if:
- Your monitoring isn’t thorough, or
- Your monitoring isn’t well-tuned.
Again, a safe way to test the waters is to use dark launches or feature flags. Your team will be able to test how quickly issues are caught and how quickly they can recover—all without compromising the customer experience.
As you work to improve your testing builds and monitoring, we recommend slowly transitioning your manual deploy schedule to a more frequent cadence. Start with weekly deploys, then daily, then multiple deploys a day. Finally, automate the deployment process once pressing the deploy button feels like a waste of time.
The Holy Grail of Software Delivery
Every article in our series has guided you through optimizing each phase in the software delivery process. If you’ve been successful with this, then your developers are making small incremental changes, pushing frequently, and moving work through the Continuous Delivery pipeline with little to no friction.
But unless you’re actually shipping those changes to production, you’re not practicing Continuous Delivery. The point of CD (and Agile before that) was to shorten the feedback loop between customers and engineers. Working incrementally, but still shipping massive releases, does not accomplish this objective.
Deliver continuously to mitigate risk, respond quickly, and get the best version of your software into the hands of customers as quickly as possible.
Check out the other articles in our Tactical Guide to a Shorter Cycle Time five-part series:

This post is the fourth article in our Tactical Guide to a Shorter Cycle Time five-part series. Read the previous post here.
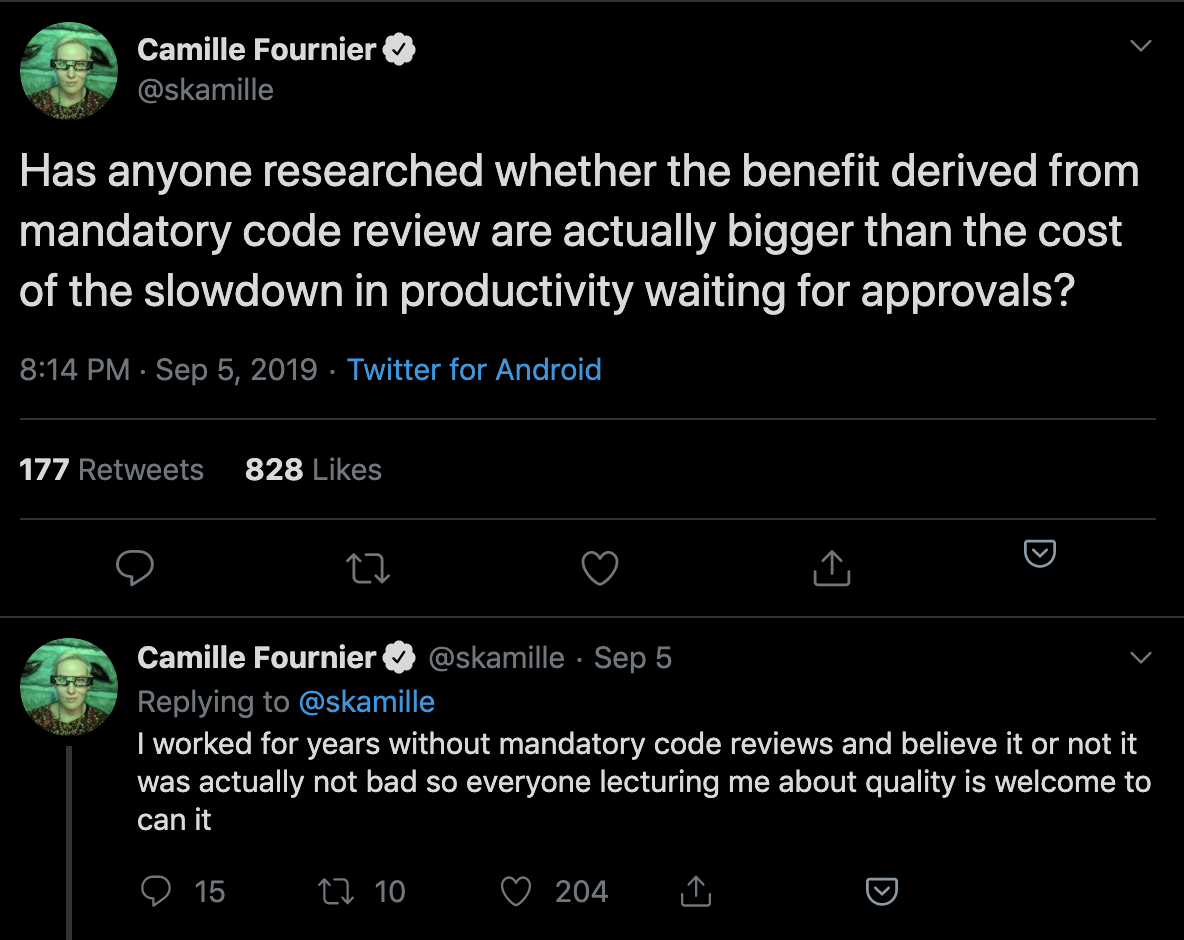
As the engineering industry has moved towards Continuous Delivery, teams have left behind many of the manual quality control measures that once slowed down delivery. Along this same vein, some engineering leaders are doubting whether Code Review still has value:
The annual survey conducted by Coding Bear revealed that 65% of teams are dissatisfied with their Code Review process– yet teams consistently identify Code Review as the best way to ensure code quality. Most people agree Code Review is important, but few know how to prevent it from wasting valuable engineering time.
Before giving up on Code Reviews altogether, we recommend looking at Code Review metrics to identify where you can avoid waste and increase the efficiency of this process.
Defining “Successful” Code Reviews
An effective Code Review process starts with alignment on its objective.
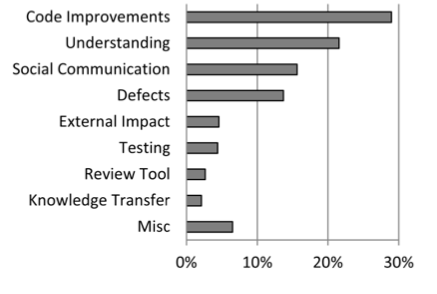
A study at Microsoft a few years ago surveyed over 900 managers and developers to understand the motivation behind Code Reviews. “Finding defects” was the primary motivator of the majority of those surveyed, but when the results were analyzed, the researchers discovered that the outcomes didn’t match the motivations. Improvements to the code were a much more common result of the reviews.
Work with team leaders to determine which outcomes you’re optimizing for:
- Catching bugs and defects
- Improving the maintainability of the codebase
- Keeping consistency of code style
- Knowledge sharing throughout the team
Determining your Code Review priorities helps your team focus on what kind of feedback to leave or look for. Reviews that are intended to familiarize the reviewer with a particular portion of the codebase will look different from reviews that are guiding a new team member towards better overall coding practices.
Once you know what an effective Code Review means for your team, you can start adjusting your Code Review activities to achieve those goals.
Code Review Diagnostics
Historically, there has been no industry standard for Code Review metrics. After speaking with and analyzing work patterns of thousands of engineering teams, we identified the following indicators:
- Review Coverage: the percentage of files changed that elicited at least one comment from the reviewer.
- Review Influence: the percentage of comments that led to some form of action, either in the form of a change to the code or of a reply.
- Review Cycles: the number of back-and-forths between reviewer and submitter.
These metrics were designed to give a balanced representation of the Code Review process, showing thoroughness, effectiveness, and speed. While imperfect (as all metrics are), they provide concrete measures that help you understand the differences between teams and individuals.
Diving into outliers will enable you to finally bring a quality and efficiency standard to Code Reviews across your organization.
Review Coverage
Review Coverage indicates how much attention is spent on reviews and represents review thoroughness. If you’ve identified that the purpose of Code Reviews is to catch defects or improve maintainability, this metric, together with Review Influence, will be a key indicator of how effective this process is.
Low Review Coverage can point you toward incidents of under-review or rubber-stamping. Under-review may be happening as a result of a lack of familiarity with the codebase, disengagement on the part of the reviewer, or poor review distribution.
Unusually high Review Coverage could be an indicator of a nitpicker who’s leading to inefficiency and frustration on the team. This case will likely require realignment on what “good” is.
Review Influence
Any action that is taken as a result of a review comment is proof that the reviewer is taken seriously and their feedback is being considered. When this metric dips low, feedback isn’t resulting in change, indicating that reviews are not perceived to be valuable.
See core Code Review metrics and how they compare across teams or individuals so you can pinpoint the problem.
If you consider this metric in tandem with Review Coverage, you may identify cases where individuals or teams leave many comments (have high thoroughness) but those comments yield no action (are low impact). This can signal that there needs to be a re-alignment on the function or purpose of Code Review.
When the Review Influence is low, you’ll want to dive into the reviews that are being left on each Pull Request. When feedback that was intended to be actioned is ignored, it may indicate that the comments were unclear or the suggestion was controversial.
Review Cycles
Each time a Pull Request is passed back and forth, developers are required to context switch and spend more time on one particular line of work.
If this happens frequently, the review process can become a bottleneck to shipment and directly increase your team’s Cycle Time. Even worse, it can serve as a source of demotivation to engineers and contribute to burnout.
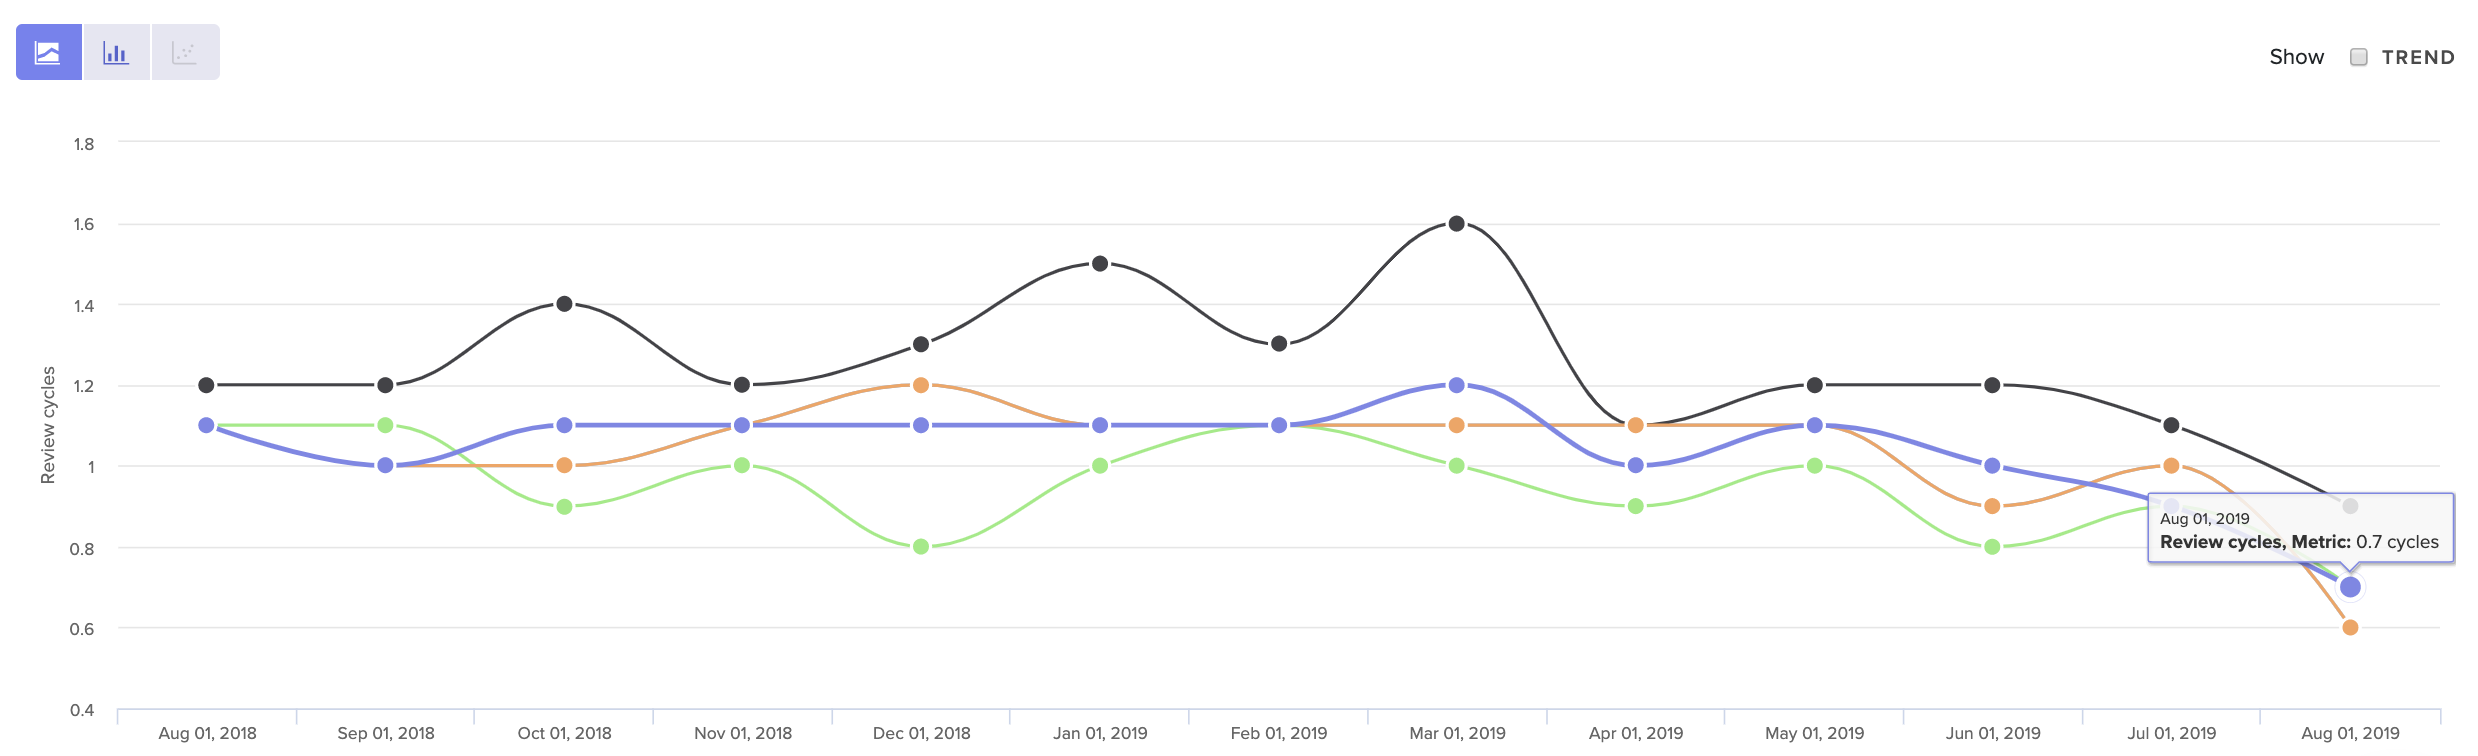
See core Code Review metrics over time, so you can get a sense of what’s normal for your team.
Look at your Review Cycle count over time to get a sense of what is typical for your team. Note that a high number of Review Cycles is typical for less experienced team members who are still becoming familiar with your codebase. Otherwise, when Review Cycles spikes, it typically represents some form of misalignment.
The source of that misalignment could be upstream, due to unclear technical direction. It may indicate that there’s a disagreement about how a solution should best be implemented. Or, more simply, team members may not have clarity about what “done” means.
Bring this data into your retros or 1:1s to start the conversation about where this misalignment may have taken place.
When to Revisit Code Review
Of all the components that influence Cycle Time, Code Review is the most difficult to get right. It requires taking a hard look at metrics, but also frequently requires difficult conversations about how to leave constructive yet respectful feedback. Often, the culture of one team is not conducive to processes have worked well for another.
For this reason, we recommend revisiting your Code Review process after any significant change to processes or team structure. This will get easier after you’ve done it once since you’ll have a clear sense of your expectations and the tools with which to communicate them.
To learn where your team should focus next, check out the other articles in our Tactical Guide to a Shorter Cycle Time five-part series:

This post is the third article in our Tactical Guide to a Shorter Cycle Time five-part series. Read the previous post here.
Every hour that a Pull Request spends awaiting review represents waste–but also threatens to slow down several subsequent lines of work.
An engineer who’s waiting on a code review will move onto the next Pull Request to feel productive until it too gets stuck in the queue. If this pattern continues, reviewers will be faced with a daunting stockpile of unreviewed Pull Requests, and each developer will be juggling three or four simultaneous lines of work. Code review will become a universally painful experience.
A poor Time to First Review (the time it takes for a reviewer to pick up a review) can jeopardize the effectiveness of your entire code review process. Here’s what you can do to mitigate the first significant bottleneck in the software delivery pipeline.
Benchmarking Success
First, you’ll want to define what a “low” Time to First Review means, across the industry and in the context of your organization.
In our analysis of over 19k contributors’ data we uncovered the following benchmarks for Time to First Review:
- The top 25% of engineering organizations get Pull Requests reviewed in under 4 hours.
- The industry median is about one day.
- The bottom 25% take over a day and a half.
You want to lower this metric as much as you can, without it coming at a cost to the focus and productivity of the reviewers. This delicate tradeoff means that you’ll want to understand the dynamics of your specific team before setting metrics-based goals.
First, look at this metric for your organization and team-by-team. Once you know what’s “normal” for your organization, you can further investigate two kinds of outliers:
- Teams with fast reviewers, who have found a way to create an effective process and juggle a difficult team dynamic. Their processes may be worth sharing with the rest of the organization.
- Teams with inconsistent reviewers, who are frequently blocked and struggling to get to code reviews quickly.
From here, dive into individual and team metrics to better understand precisely why your Time to First Review is high or inconsistent.
Time to First Review Diagnostics
Before diagnosing this particular phase of the software delivery process, make sure that it’s not a symptom of an earlier process. (Read our previous post about leveraging Time to Open to better understand how inefficiencies during the first stage can have significant, negative downstream effects.)
If everything earlier in the PR process is streamlined, however, there are three data points you can look at to fully diagnose this slowdown.
Pull Request Size
Pull Request Size is a byproduct of a high Time to Open and usually points to inconsistencies with how your team manages Pull Request scope.
For many teams, opening a Pull Request doesn’t indicate that the changeset is ready for review. Team members tend to continue making changes before the Pull Request gets into the hands of a reviewer.
At this time, a Pull Request can grow, deterring reviewers from picking it up because either A) they aren’t sure if it’s ready, or B) because it has grown in complexity and is, therefore, more difficult to review.
Surface the oldest and most active open PRs, so your frontline managers can mitigate issues before they grow out of hand.
Encourage managers to check in on individual Pull Requests that have been open for longer than a day (but not yet reviewed). If they find patterns among teams or individuals that indicate a lack of scope management, they’ll want to coach their teams on how to control the scope from the onset of the change set, by, for instance, giving PRs titles that are discrete and specific.
Review Workload Balance
Look at Review Involvement (i.e., the percent of reviews that reviewers participate in) across the team to understand how the burden of code review is distributed. If the same few people are handling all the reviews, work will start piling up, creating a lasting bottleneck.
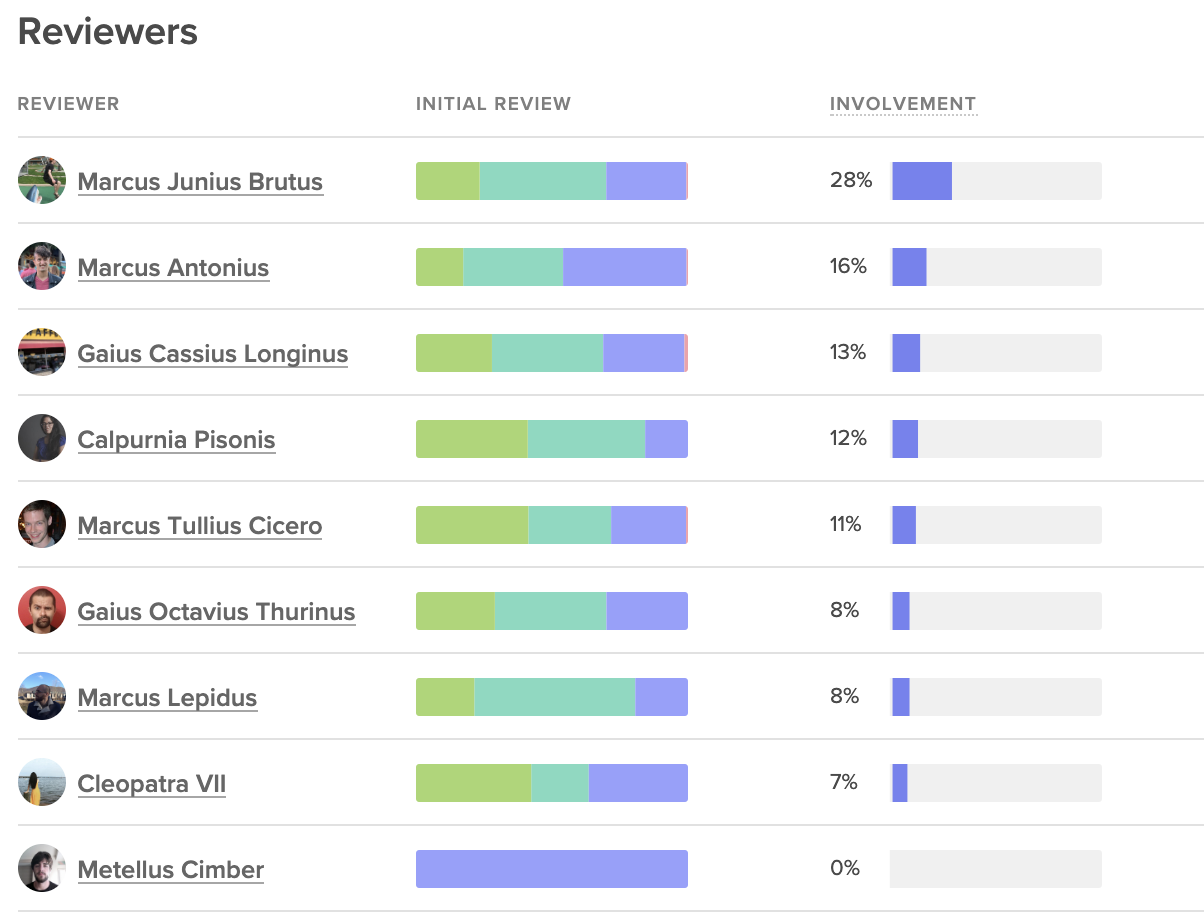
Code Climate's insights show involved each team member is on code reviews, next to the outcomes of those reviews.
Poor distribution may represent a difference of enthusiasm about code review. Some team members may be more keen to pick up reviews, while others consistently prioritize their own coding. This issue can be solved with automated code review assignments or a re-emphasis on code review across the team.
Poor distribution of code reviews can also represent a lack of confidence. The proper response will vary from team to team, but you’ll want to make sure there’s clarity around the expectations of a code review and training on how new team members can ramp up and start participating more deeply in the team-wide collaborative processes.
Review Speed
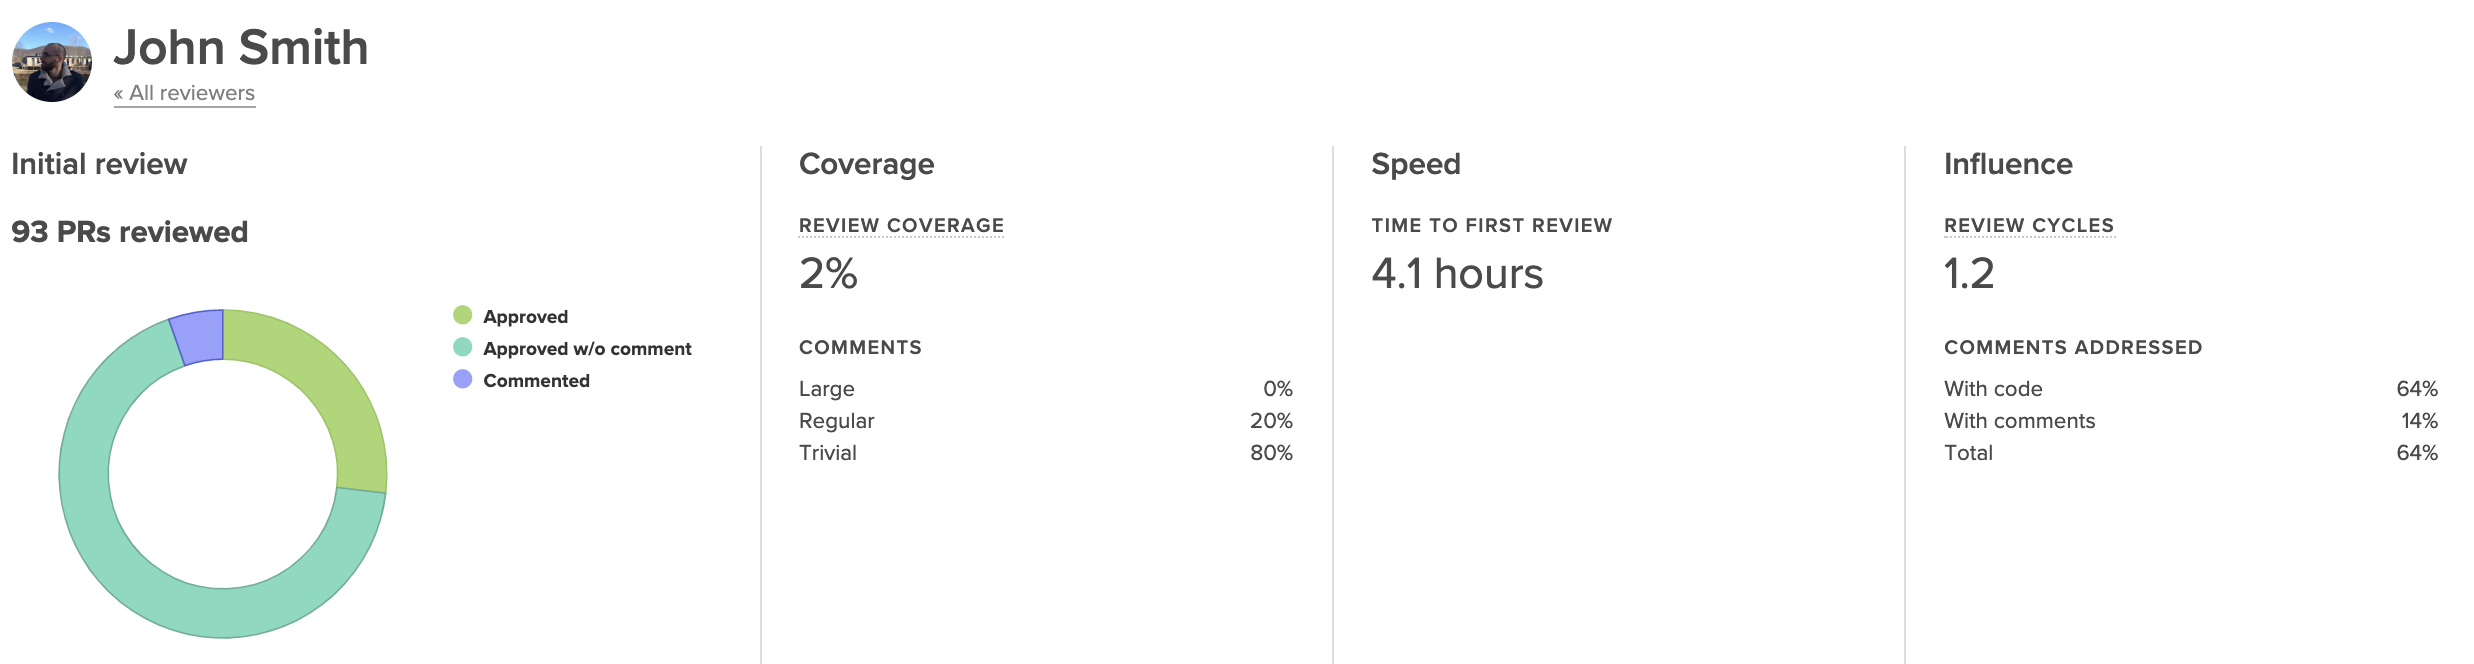
Unlike Time to First Review, which is used to understand team collaboration patterns, Review Speed is an individual metric, indicating how long each person takes to leave a review.
Review Speed helps you understand how well your team is prioritizing code review.
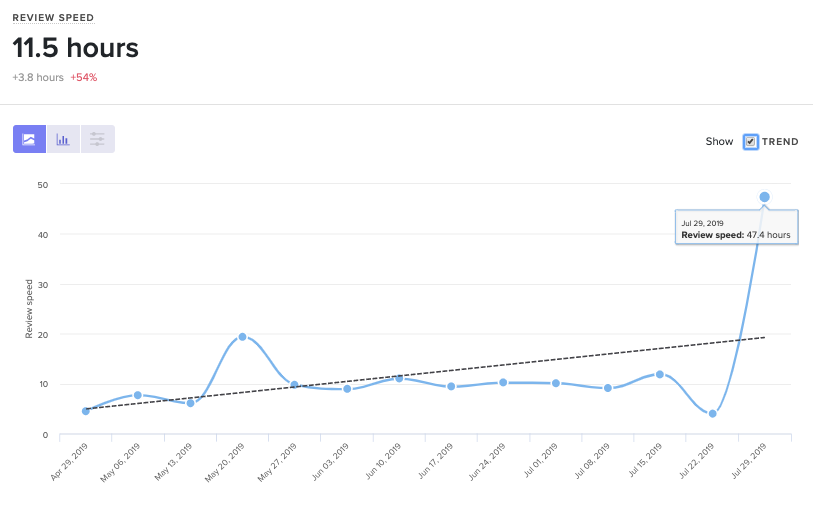
Code Climate's insights can show you how any metric is trending as your team scales or changes.
A high or inconsistent Review Speed can point to cultural or technical blockers.
A cultural blocker can only be uncovered through conversations with specific team members and managers. If you find that a team or a team member is not prioritizing code review, work with them to reprioritize, along with their other responsibilities. Encourage team members to optimize for this metric until Cycle Time decreases and Pull Request authors are quickly unblocked.
A technical barrier at this stage usually indicates that there may be a lack of tooling. Team members, while working in their individual environment, don’t have the signals or alerting systems that inform them of Pull Requests ready for review.
Start Code Review on the Right Foot
Code Review is one of the most difficult processes to get right on a software development team. A different balance between thoroughness and speed exists on most teams– yet few have a solid idea of what their code review objectives should be. Adding an endless queue of unreviewed Pull Requests to this equation makes the entire process unduly more difficult.
If Time to Review is a problem, a small reprioritization or retooling may be necessary– but the effects will be well worth it.
To learn where your team should focus next, look out for the upcoming articles in our Tactical Guide to a Shorter Cycle Time five-part series:

Last Thursday, DORA released their 6th annual State of DevOps report, identifying this year’s trends within engineering departments across industries.
The good news: a much higher percentage of software organizations are adopting practices that yield safer and faster software delivery. 25% of the industry is performing at the “elite” level, deploying every day, keeping their time to restore service under one hour, and achieving under 15% change failure rate.
The bad: the disparity between high performers and low performers is still vast. High performers are shipping 106x faster, 208x more frequently, recovering 2,604x faster, and achieving a change failure rate that’s 7x lower.

Accelerate: State of DevOps 2019
This is the first of the State of DevOps reports to mention the performance of a specific industry. Engineering organizations that worked within retail consistently ranked among the elite performers.
The analysis attributes this pattern to the death of brick-and-mortar and the steep competition the retail industry faced online. Most importantly, the authors believe that this discovery forecasts an ominous future for low performers, as their respective industries grow more saturated. They warned engineering organizations to “Excel or Die.”
There are No Trade-Offs
Most engineering leaders still believe that a team has to compromise quality if they optimize for pace, and vice versa– but the DevOps data suggests the inverse. The authors assert that “for six years in a row, [their] research has consistently shown that speed and stability are outcomes that enable each other.”
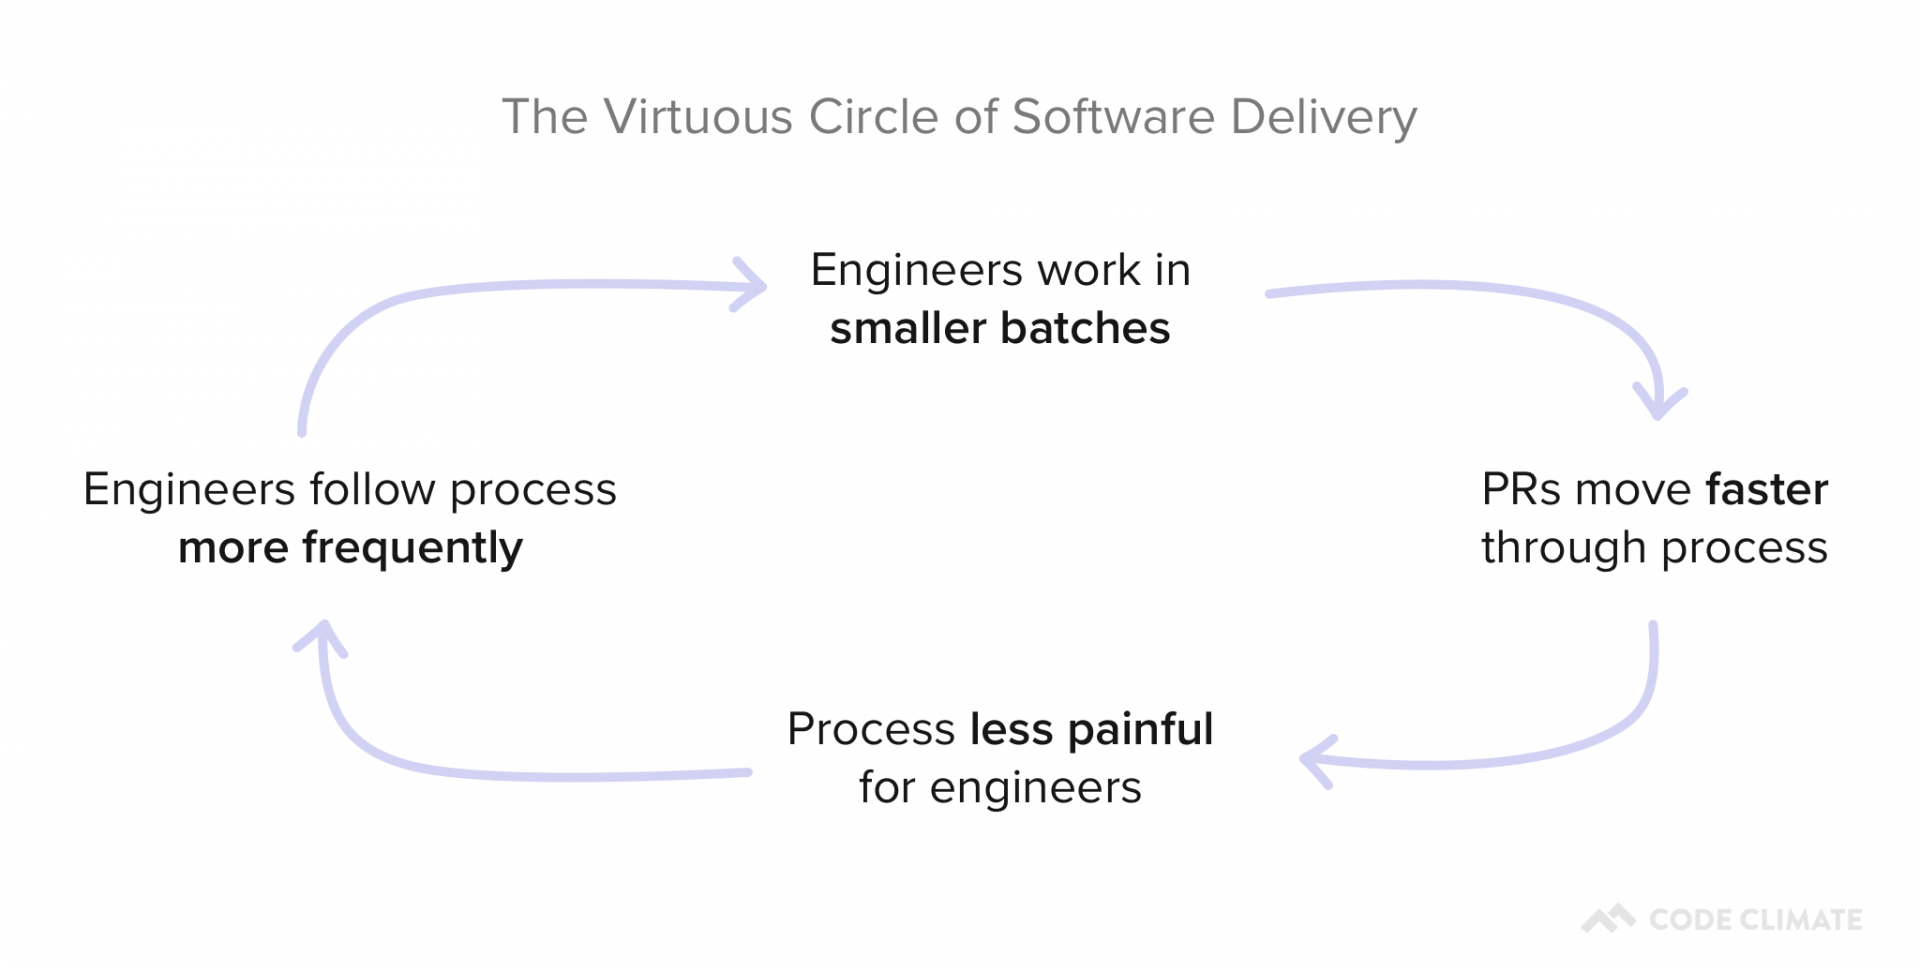
This is in line with Continuous Delivery principles, which prescribe both technical and cultural practices that set in motion a virtuous circle of software delivery. Practices like keeping batch size small, automating repetitive tasks, investing in quick issue detection, all perpetuate both speed and quality while instilling a culture of continuous improvement on the team.
Thus for most engineering organizations, transitioning to some form of Continuous Delivery practices shouldn’t be a question of if or even when. Rather, it should be a question of where to start.
The Path Forward: Optimize for DORA’s Four Key Metrics
The DORA analysts revealed that rapid tempo and high stability are strongly linked. They identified that high-performing teams achieve both by tracking and improving on the following four key metrics.
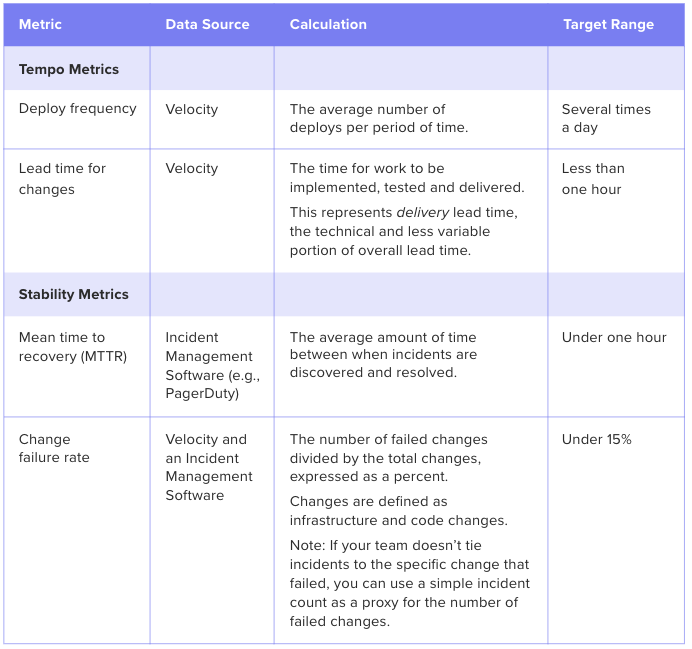
Software Engineering Intelligence (SEI) solutions provide out-of-the-box visibility into key metrics like Deploy Frequency and Lead Time. The analytics tool also reveals underlying drivers, so engineering leaders understand what actions to take to drive these metrics down.

This post is the second article in our Tactical Guide to a Shorter Cycle Time five-part series. Read the previous post here.
You discover your engineering team has a long Cycle Time compared to the rest of the organization or compared to the industry’s top performers. Now what?
When we ran an analysis on 19k+ contributors’ data, we uncovered that of all the identified key drivers, a low Time to Open (time between the earliest commit in a pull request and when the pull request is opened) had the highest correlation to a short Cycle Time.

The correlation coefficient chart above illustrates that Time to Open has the highest impact on overall Cycle Time of all analyzed drivers.
Since Time to Open is a component of Cycle Time, it’s natural to expect some correlation. What’s remarkable, however, is that work practices that take place before a pull request is opened have a higher impact on Cycle Time than those that take place after (including the Code Review process).
This data supports the most important principle of Continuous Delivery: keeping batch sizes small has significant positive downstream effects. By virtue of being small and discreet, each change will easily move through each phase of the software delivery process:
- Review will happen sooner because reviewers perceive the work to be less challenging and time-consuming to review.
- Approval will happen sooner because there will be fewer back-and-forths and the revisions will be less substantial.
- Deploy will happen sooner since less work in progress combined with lower risk encourages developers to deploy quickly.
Time to Open is thus one of the most impactful software metrics and serves as a great starting point for optimizing your Cycle Time.
Scoping the Opportunity for Improvement
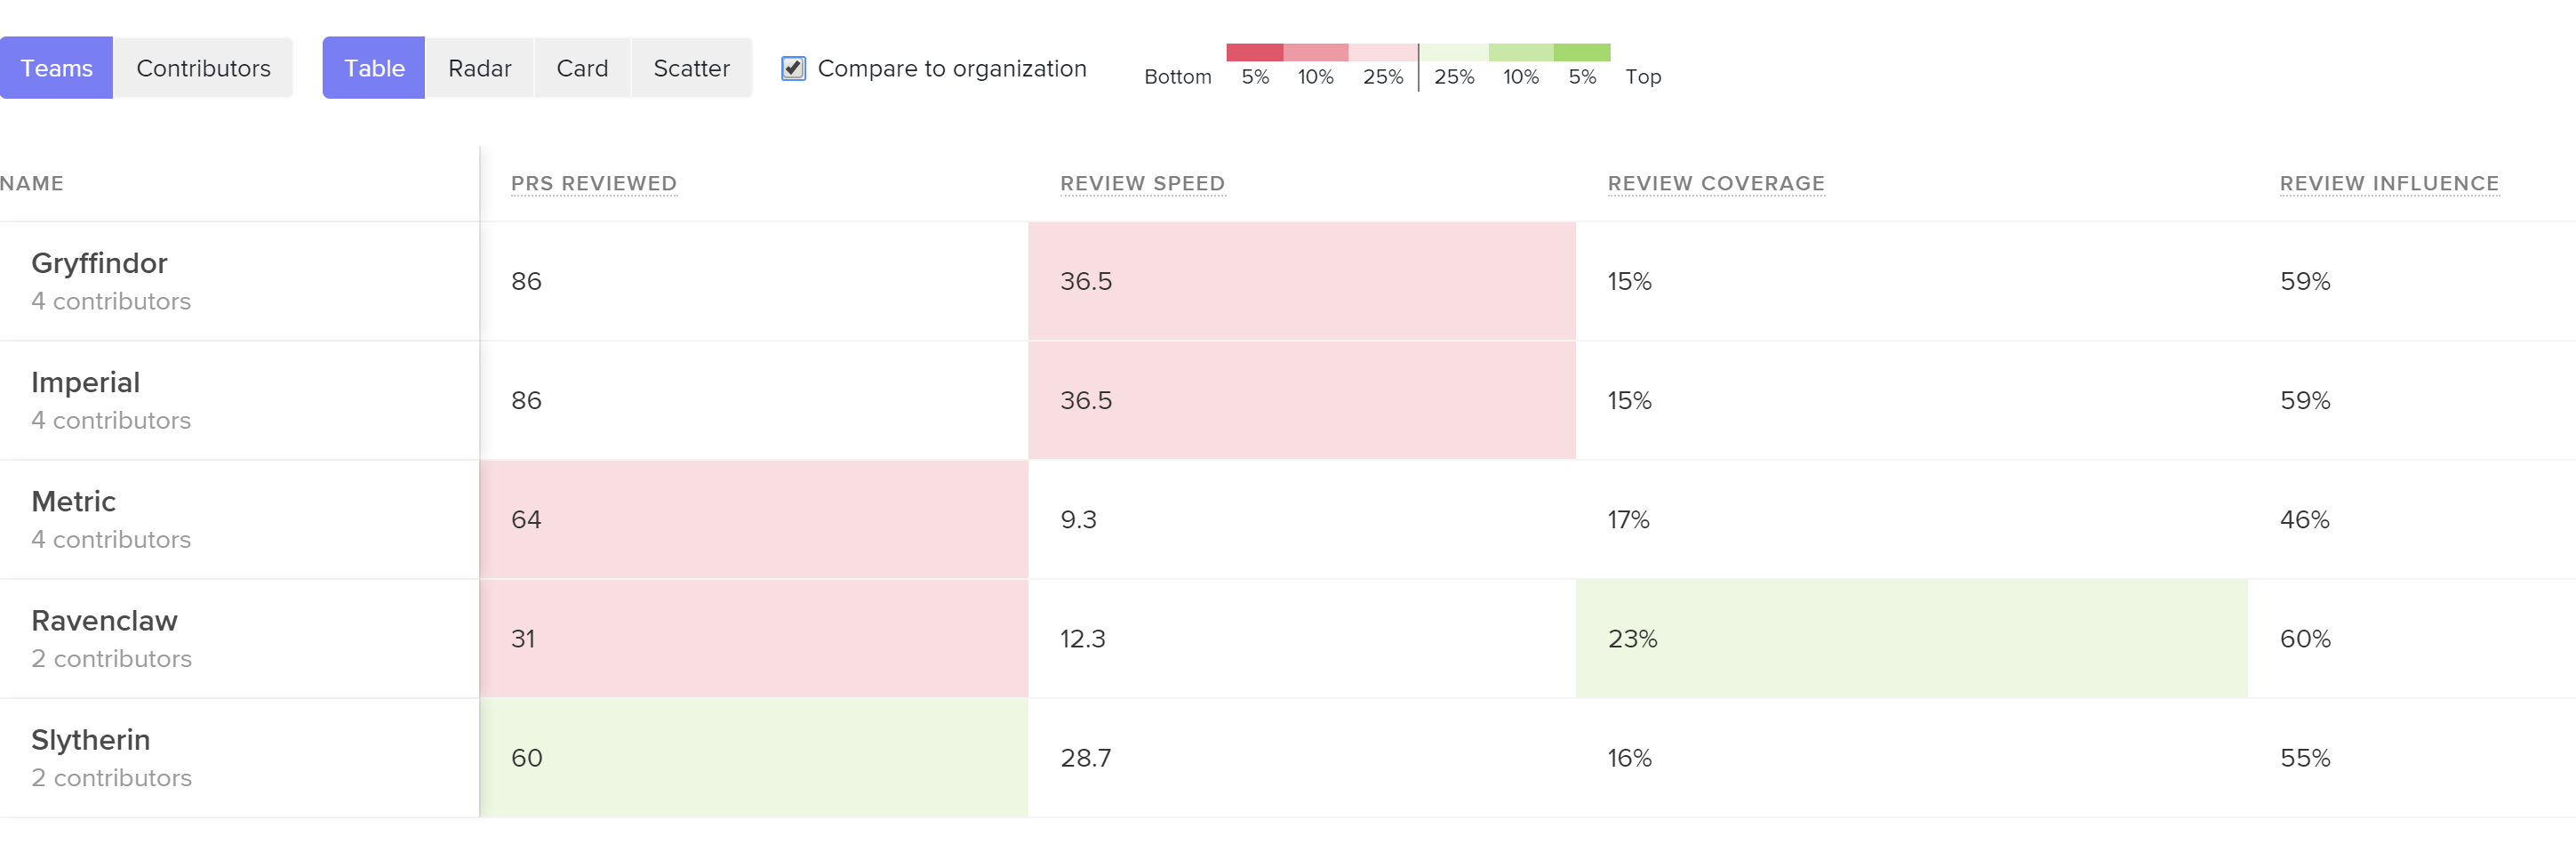
Before going in and making changes to improve Time to Open, you’ll want to have an understanding of what “good” looks like. You can look at this metric team-to-team to see how your top performers are doing:
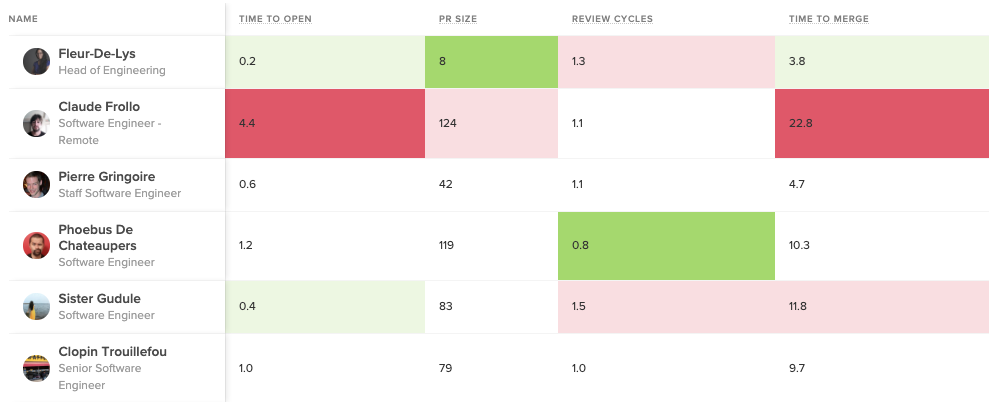
Bright green represents the top 5%, while bright red represents bottom 5% in each metric.
You can also gauge the performance of your entire organization by comparing them to the industry average. This will help you understand your starting point and how to benchmark progress.
Our data analysis reveals the following benchmarks for Time to Open:
- The top 25% of engineering orgs open pull requests in under 3 hours on average
- The industry median is about one day
- The bottom 25% take over two days to open a pull request

Once you know how your teams and your organization as a whole are doing, you can start diving into where, specifically, your team is experiencing friction in the beginning of your software delivery process.
Time to Open Diagnostics
A long Time to Open indicates one or several of three things might be happening on your team:
- Batch sizes are too large, evidenced by the Pull Request Size metric
- There is a high amount of code churn, evidenced by the Rework metric
- There’s a lot of multi-tasking and task-switching, evidenced by the amount of Work in Progress there is at any one given time.
Use the software metrics below as signals in conjunction with qualitative data to understand how to improve your Time to Open.
Pull Request Size
Look at pull request sizes (i.e., batch sizes) to see whether your team is consistently pushing small, easy-to-review changes. Our analysis shows that high-performing teams typically open PRs that are smaller than 150 LOC.
Look at this metric for the entire organization, each team, and then individuals to isolate the problem.
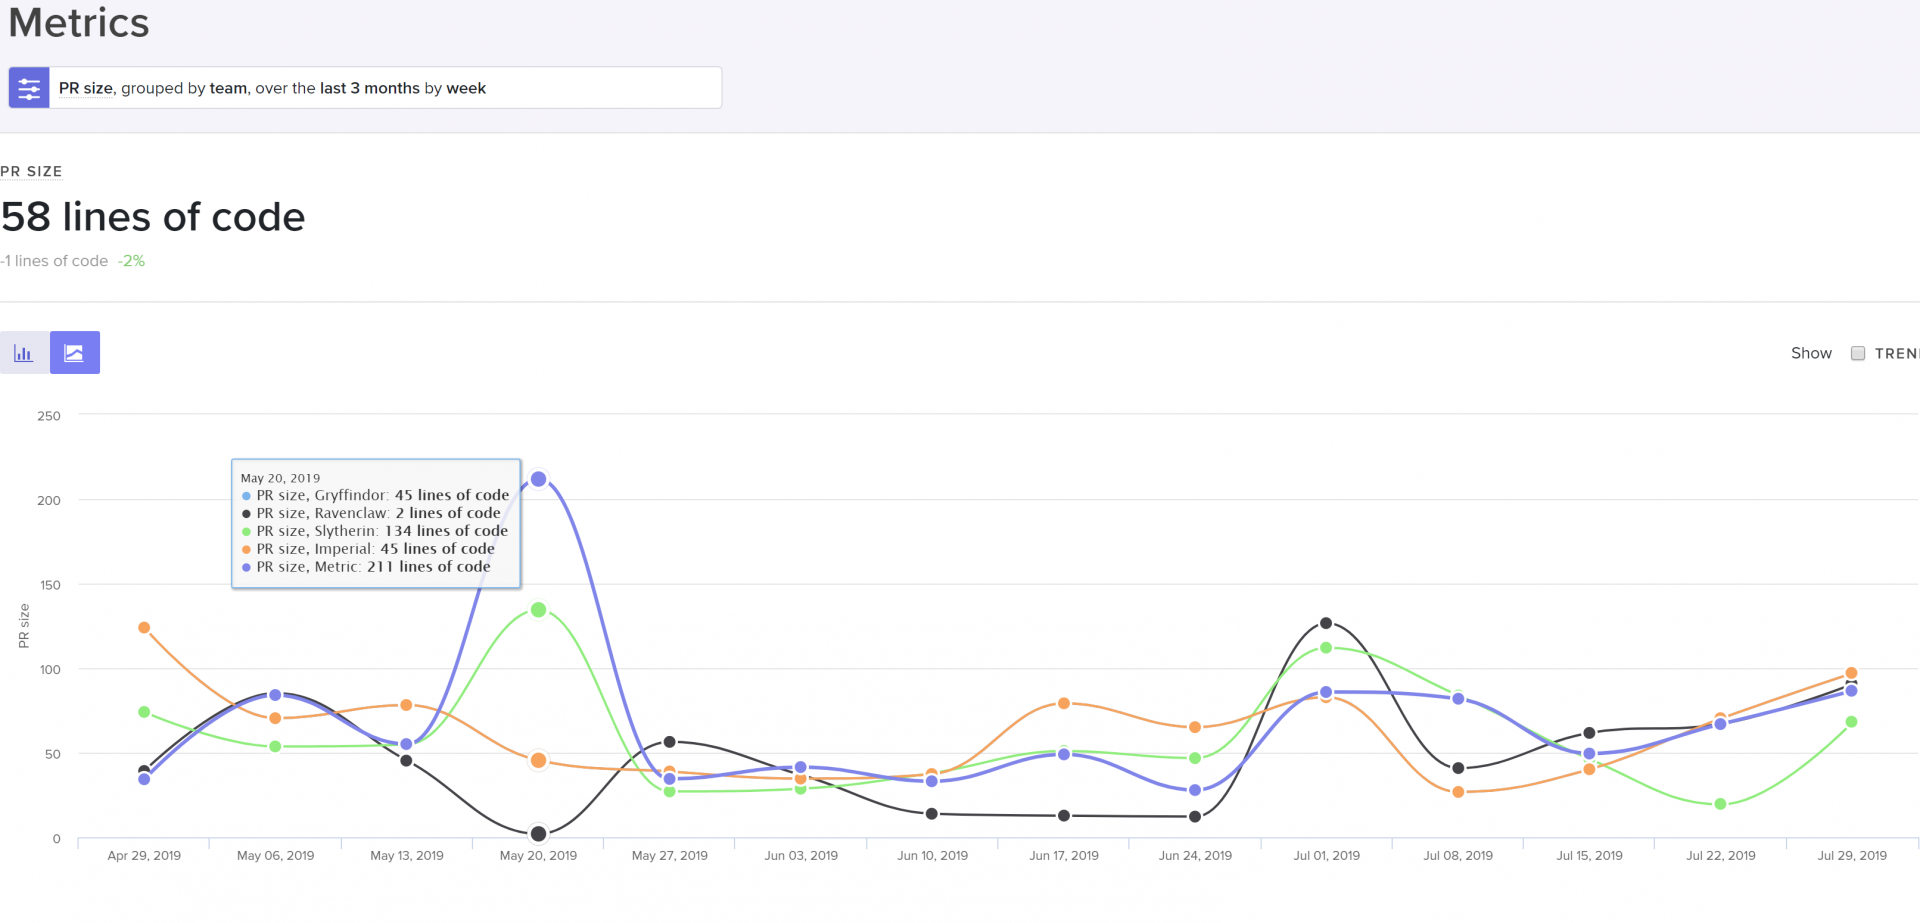
PR size grouped by team, cohort, or individual to help identify the scope of the problem.
If PR Size is high, it may indicate:
- The practice of pushing small batch sizes isn’t viewed as important,
- There’s a lack of experience with keeping batch sizes small,
- Your team hasn’t built up this habit yet
When large PR sizes are systemic across your team or organization, bring this data into discussions with your managers to find out why the team feels comfortable with large changes. Encourage teams to optimize this metric until it drives down Cycle Time and the effects of less bottlenecks are felt.
When this metric is high for an individual, it presents a coaching opportunity. Encourage mentors to show how to approach problems with smaller, more incremental changes.
Rework
We define Rework, or code churn, as a percentage of code changes in which an engineer rewrites code that they recently updated (within the past three weeks). We’ve found that top-performing teams keep their Rework under 4%, but this number can vary.
While some Rework is a natural and expected part of the software development process, high or increased Rework indicates wasted effort that is both slowing down productivity and frustrating engineers.
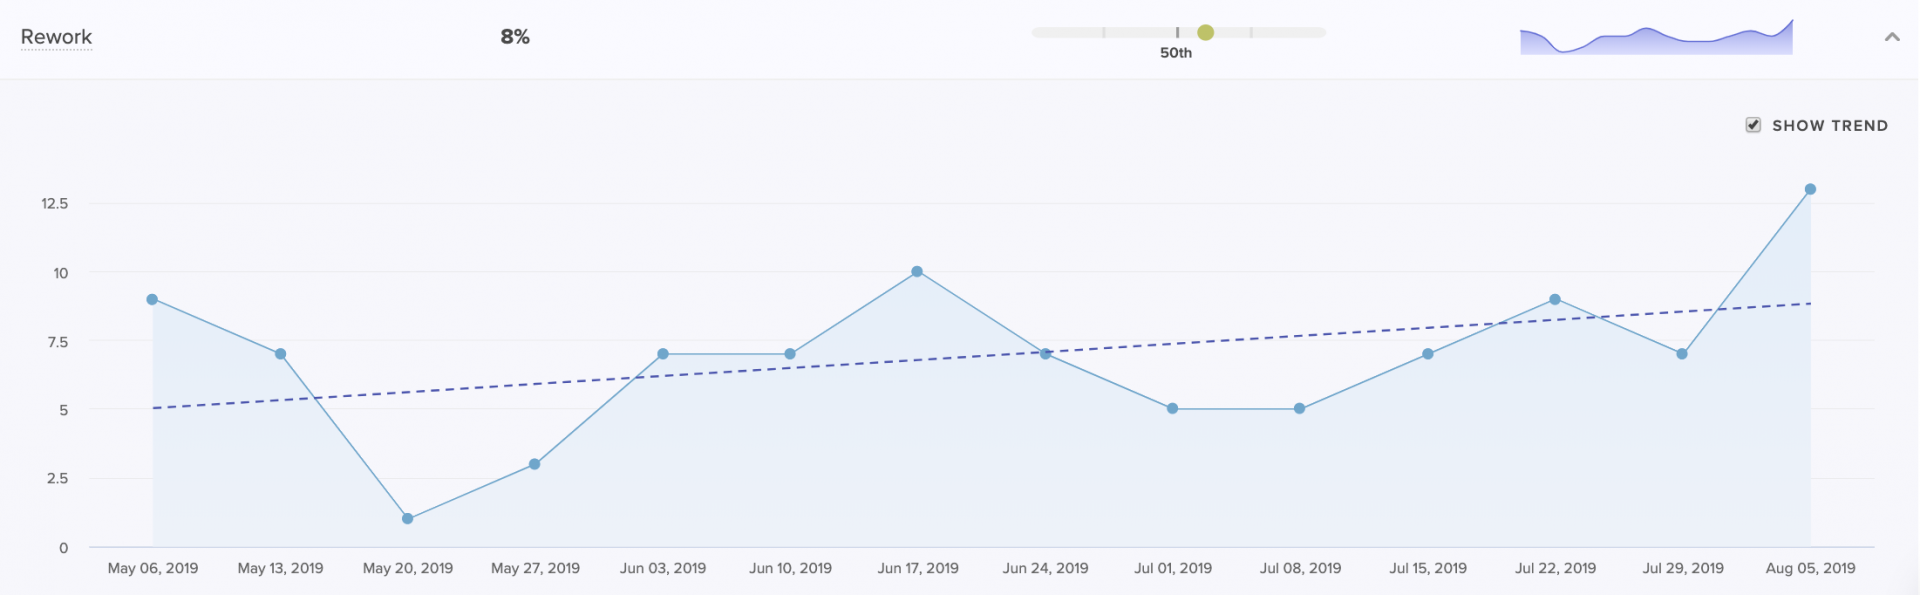
A Coaching Summary for managers to see how Rework of a particular team or individual compares to the rest of the org.
High Rework on the team or organization level can be a signal that there was a misalignment between product and engineering. It often indicates unclear technical direction or consistently late changing product requirements.
When Rework is high for individuals, it’s often a symptom of a lack of experience. Newer team members tend to have higher Rework. If this isn’t decreasing significantly throughout the onboarding of a team member or cohort, consider improving onboarding or mentoring processes.
Work in Progress (WIP)
A principle of lean product development, often discussed in the context of Kanban, is limiting Work in Progress. Practically, this means your team should be consistently progressing the unit of work that is closest to complete so that context-switching is minimal.
Looking at WIP per contributor helps you understand whether your teams are juggling multiple tracks of work, slowing the time to completion for each.
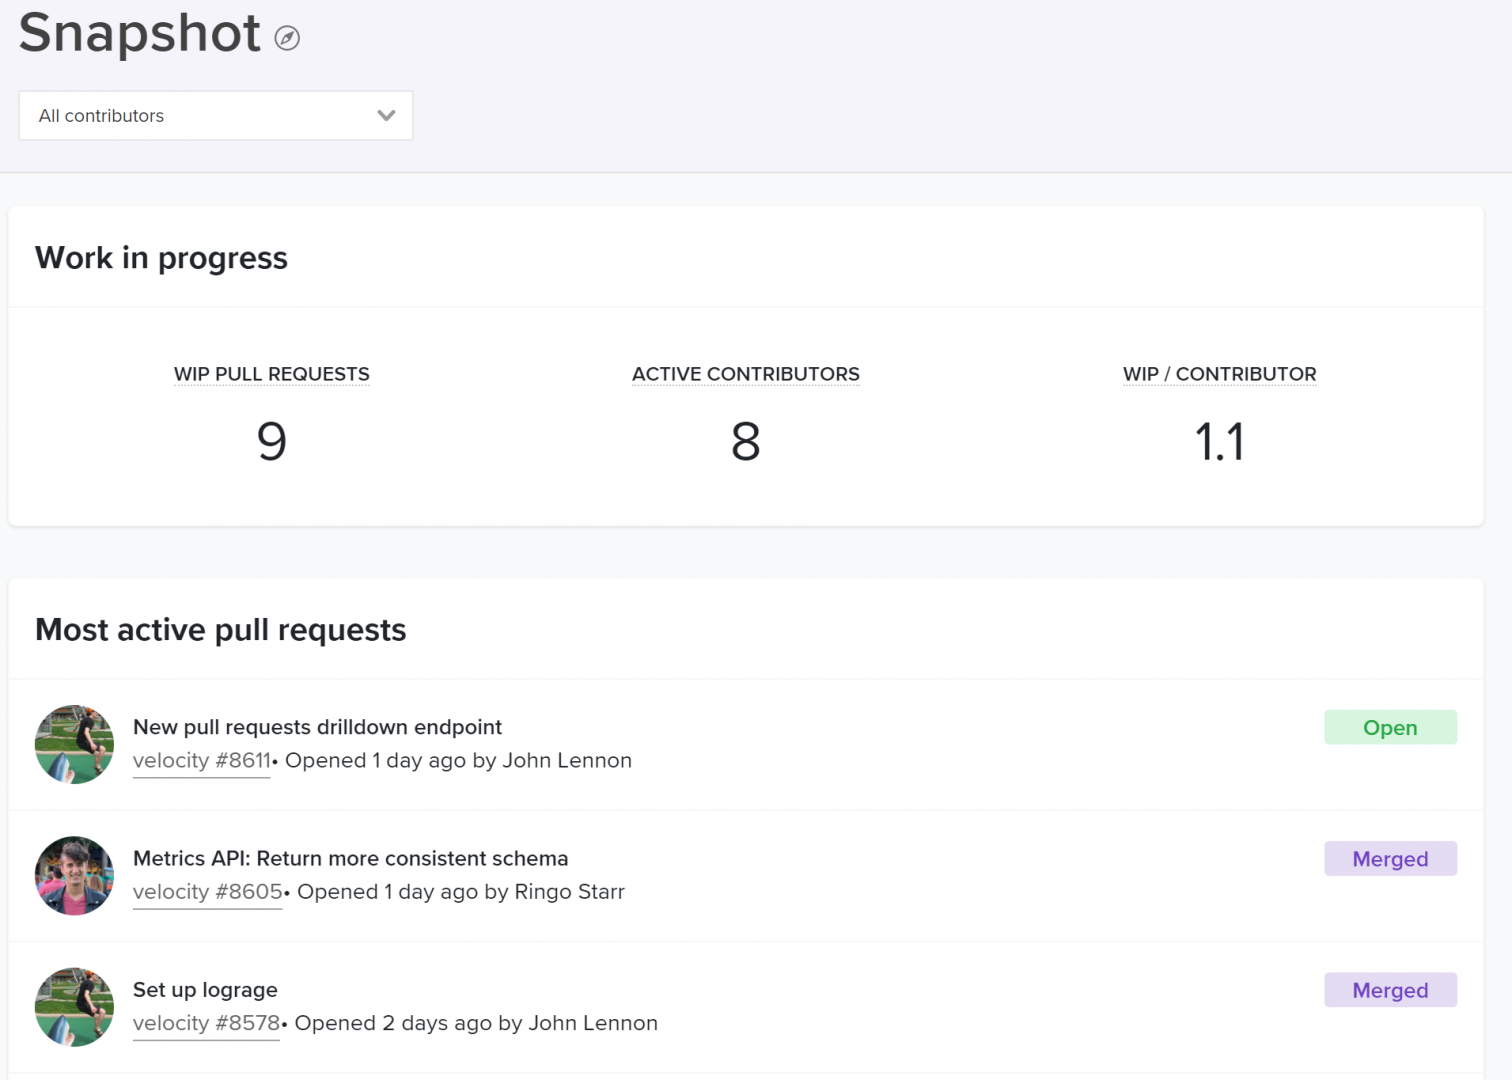
The WIP per contributor with a breakdown of the most active pull requests below.
High WIP for your team or organization is another indication of unclear or conflicting priorities, which cause team members to abandon work and move onto the next project. Similarly, high WIP per Contributor can be systemic in a team with too many dependencies. When team members are constantly blocked, they have no choice but to move forward onto other tracks of work.
High WIP for an individual can be indicative of a bad work habit and should be addressed by mentors or managers through coaching.
What’s Next
The effects of improving Time to Open will immediately improve Cycle Time and team morale. Once engineers feel unblocked and see the impact of their work more frequently, they’ll be eager to uncover more opportunities to further optimize how they work. This will set in motion a Virtuous Circle of Software Delivery which managers can use to facilitate a culture of continuous improvement.
To learn where your team should focus next, stay tuned for the upcoming articles in our Tactical Guide to a Shorter Cycle Time five-part series:

This post is the first article in our Tactical Guide to a Shorter Cycle Time five-part series.
Low Cycle Time is a characteristic of high performing teams–and the authors of 9 years of DevOps Reports have the data to prove it. In their book, Accelerate, they’ve found a direct link between Cycle Time and innovation, efficiency, and positive engineering culture.
Our data analysis of over 500 engineering organizations corroborates their findings. It also reveals helpful benchmarks for teams to gauge how they compare to the rest of the industry. We’ve uncovered that:
- The top 25% achieve a Cycle Time of 1.8 days
- The industry-wide median is 3.4 days
- The bottom 25% have a Cycle Time of 6.2 days
The Accelerate authors discovered the “elite” performers (making up just 7% of the industry) reach a Cycle Time of less than one hour. This means that the median Cycle Time is 80 times higher than that of the best performing organizations. This spread suggests that the majority of the industry either doesn’t measure Cycle Time, doesn’t know what a good Cycle Time is, or doesn’t know how to fix it.
This is why today, we’re kicking off our Tactical Guide to a Shorter Cycle Time, a 5-part series to help you accomplish all of the above.
The Virtuous Circle that Spurs Continuous Improvement
We define Cycle Time as the time between first commit and deploy of a changeset. Whether or not your definition matches ours precisely, optimizing the amount of time between these two events will significantly improve your engineering team’s efficiency (we’ve observed increases of at least 20%).
Measuring and improving this metric has a long term effect that’s even more significant than the initial bump in productivity. It sets in motion a Virtuous Circle of Software Delivery, in which optimization that encourages better engineering practices, paired with the positive reinforcement that comes from unblocking, encourages more optimization that sparks better coding practices, and so on.
The process of improving each portion of your Cycle Time will create a culture of Continuous Improvement on your team.
Where to Start
First, you’ll want to know what your Cycle Time is and how it compares to the industry average.
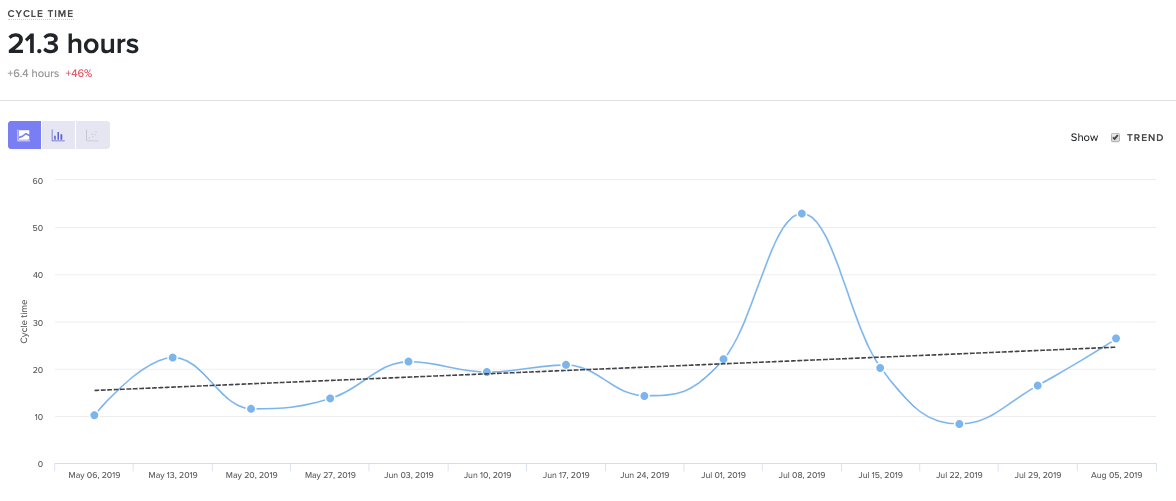
Cycle Time with 3 years of historical data out of the box.
At face value, Cycle Time is a great metric to gauge success, but it isn’t diagnostic. To understand why your Cycle Time is high or low, you’ll want to look at its four constituents:
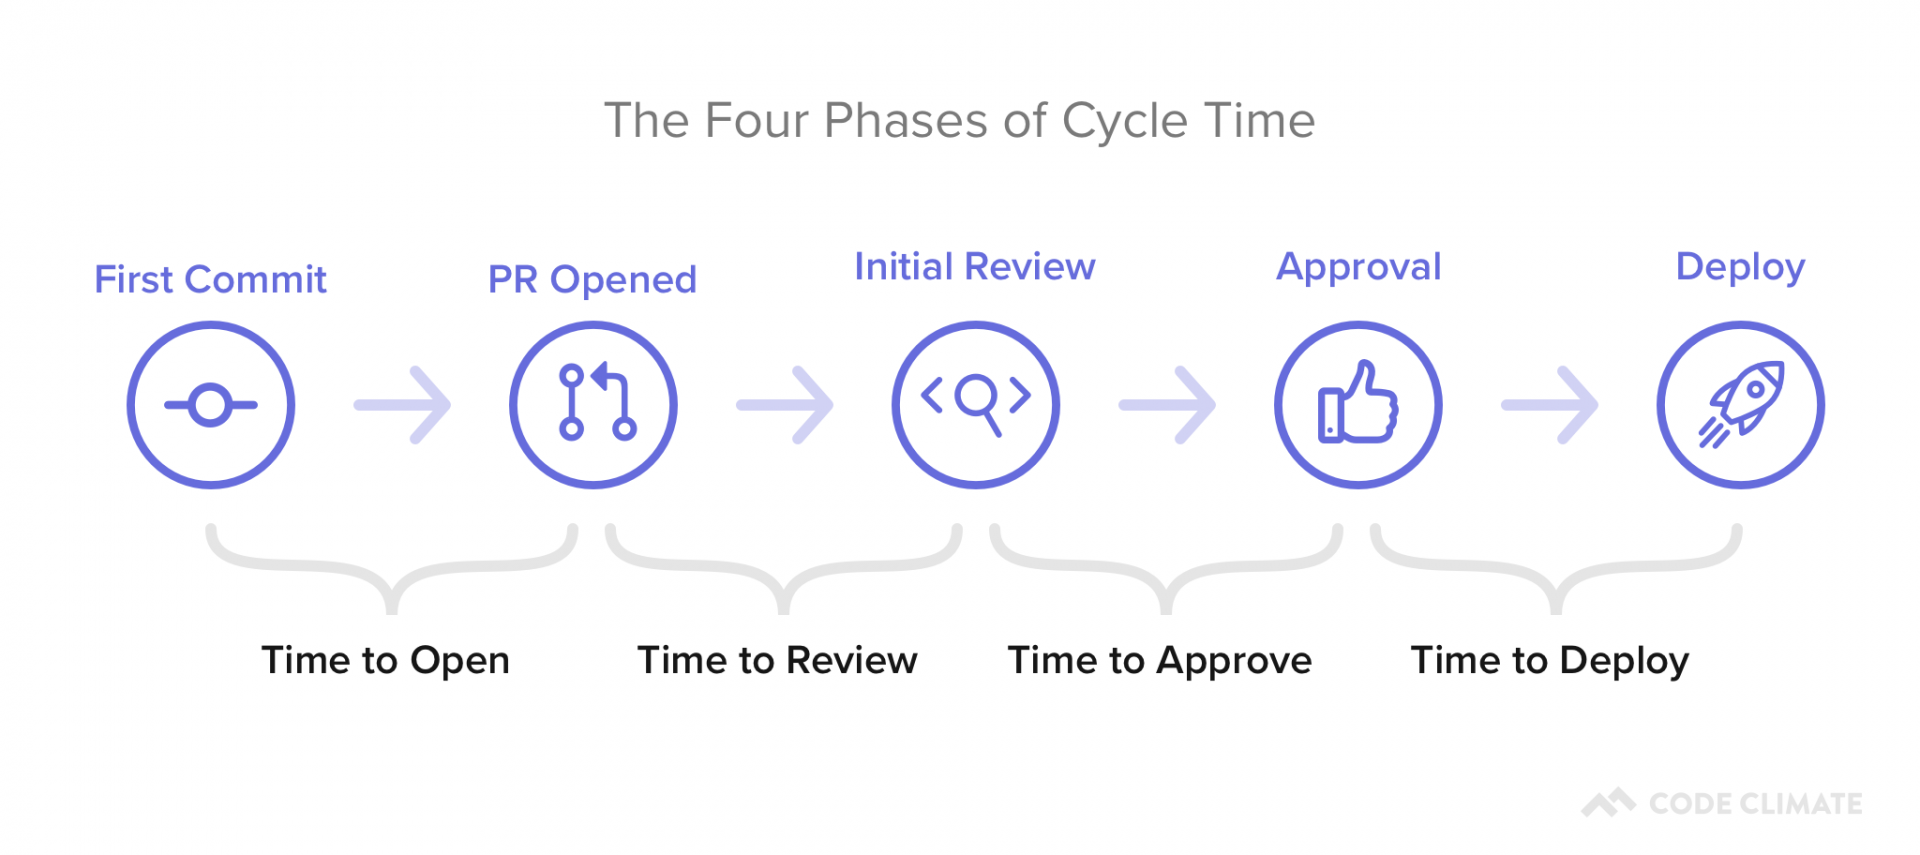
- Time to Open: The time between an engineer’s first commit and when they open a pull request in their version control system. Our data shows that this metric has the highest correlation with Cycle Time, so this is a great place to start optimizing.
- Time to Review: The time between when a pull request is opened and when it receives its first review. Delays at this stage incentivize multi-tasking, so you’ll want to minimize the time a PR is left waiting for review.
- Time to Approve: The time between when a pull request receives its first review and when it is approved, also known as the Code Review process. You don’t want to completely minimize the time spent in this phase, but you do want to make sure you reduce inefficiencies while still getting the value on Code Review you anticipate.
- Time to Deploy: Any additional time following the pull request approval, before the change reaches production.
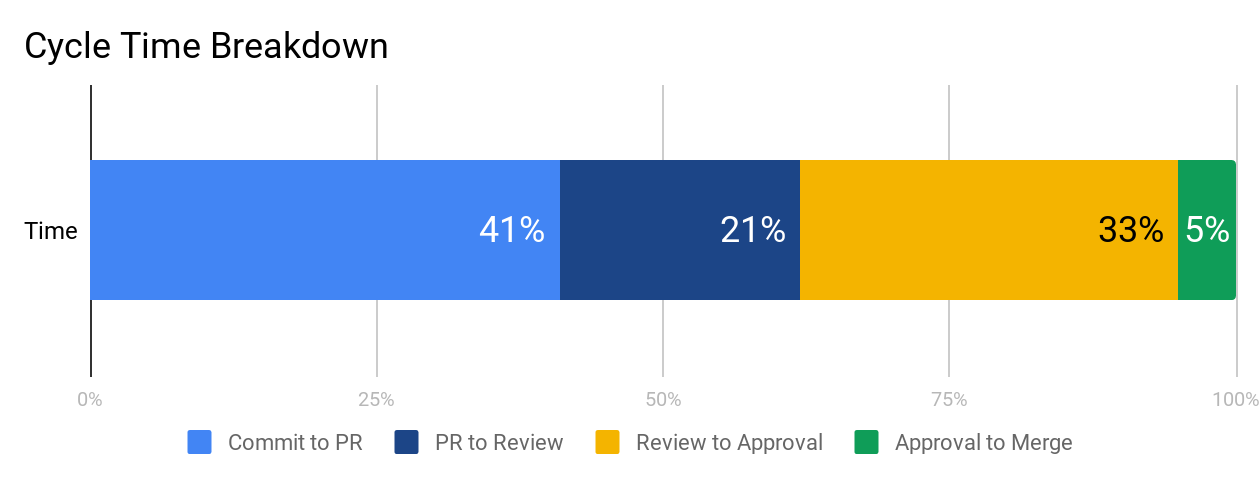
You can plot these metrics side-by-side and look at them in terms of hours or percentage of time spent, so you know what your team’s starting point is before optimizing.
We recommend working on each phase from left to right because inefficiencies tend to compound from earlier stages. When a very large pull request is opened, it also affects how long it’ll wait for review and how likely it is to get stuck in the code review process. Start with Time to Open to ensure your team has streamlined individual practices before moving on to collaborative ones.
What’s Next
The next four parts of our series will dive deep into each component of Cycle Time:
- Part I: The Virtuous Circle of Software Delivery
- Part II: The Single Greatest Lever in Shortening Cycle Time
- Part III: How to Stop Code Review from Bottlenecking Shipping
- Part IV: Keep Code Review from Being a Waste of Everyone’s Time
- Part V: The Last Mile to True Continuous Delivery
We’ll include industry benchmarks, based off our analysis of 500+ engineering teams’ data, further data points to investigate, and tactical advice on how to improve each stage.

A retrospective is a time for our team to look back. Its function, however, is to improve the way in which we move forward. Let’s digest the original definition from Scrum:
“The Sprint Retrospective is an opportunity for the Scrum Team to inspect itself and create a plan for improvements to be enacted during the next Sprint.”
The first two components are activities, the third is a result. And while most teams have fruitful conversations and create action items to yield that result, few have systems in place to ensure that positive change is actually created.
- Inspect ✔
- Create a plan ✔
- Enact improvements 🤷♀️
The problem starts with the notion of “improvement.” It’s both vague and subjective, so any plan of activities feels like a step in the right direction (spoiler: it’s not). If you take measures to concretely define improvement, however, you can hold yourself and your team accountable to your action items. For that, we can use SMART goals.
SMART goals contextualize improvement
Research has shown that goals that are both specific and time-bound are considerably more likely to yield results than generic action items.
Putting a number and a date to each retrospective action item ensures:
- The department understands and aligns on what constitutes success, and
- Progress towards this goal is black and white – trending toward or away from the goal.
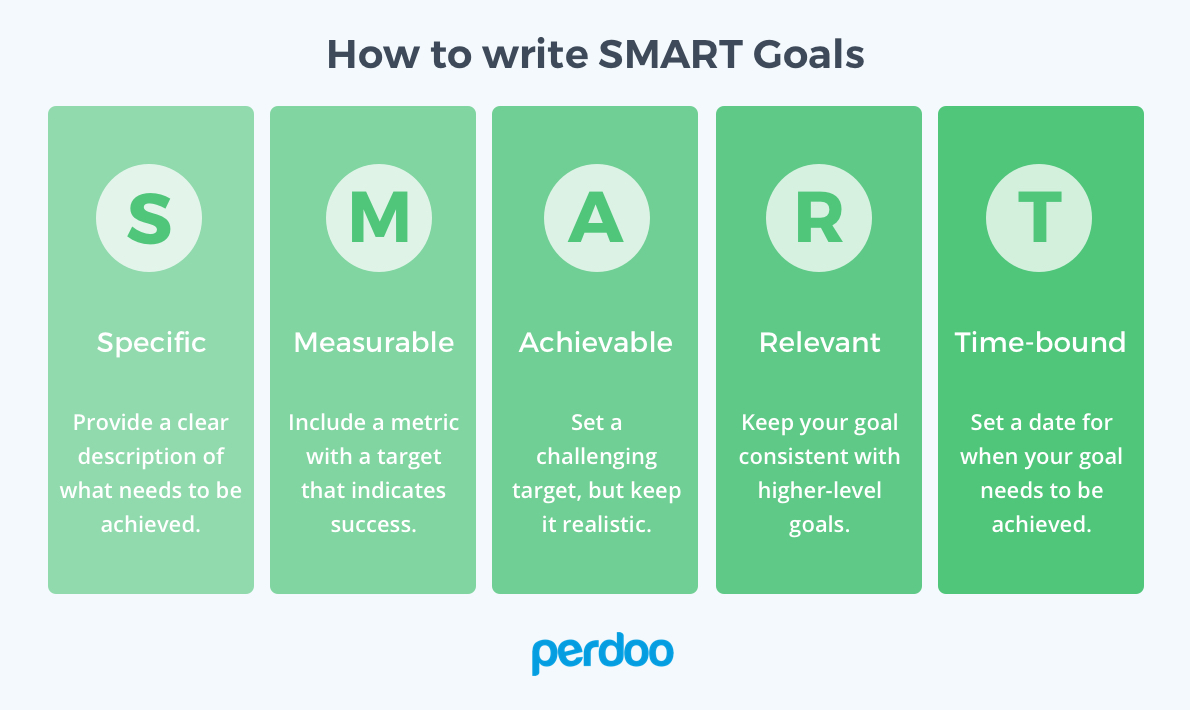
While there are plenty of systems that put a number and date to goals, but for the sake of this post, we’ll stick to one that’s tried-and-true: SMART (Specific, Measurable, Achievable, Relevant, Time-bound) goal-setting.
To best position your team to work with SMART goals, you’ll need to adjust all three components of the retro. You’ll be inspecting with more data, creating a plan using SMART goals, and enacting improvements by making progress transparent to everyone on the team.
Inspect: Use data to diagnose the biggest issues
Most teams decide on goals using only qualitative feedback. A team member raises what they perceived to be a large bottleneck, and the whole team immediately starts trying to mitigate that issue. This method gives precedence to what individuals remember and feel, not necessarily the largest and most pressing problems. While personal and anecdotal experience is vital to understanding how a problem affects the whole team, it doesn’t tell the whole story.
If you bring more data points into diagnosing the problem, however, you’re more likely to get a holistic understanding of each bottleneck. Quantitative data helps counteract recency bias and enables you to prioritize based on actual risk that the problems present to your team’s productivity.
Let’s say a given engineering team is trying to diagnose why they didn’t get to as many features as they anticipated this sprint. One engineer, Hannah, makes the following hypothesis:
I feel like there were more pull requests than usual that were open at any one given time. I think it’s because people were too busy to get to code reviews, so work piled up.
Several engineers nod their head. They also noticed that there were more open PRs than usual in GitHub.
Instead of immediately brainstorming action items, Hannah and her team investigate further. They start by looking at their Time to Review this past sprint, and realize it’s relatively low – just 6 hours. This is contradictory to Hannah’s assessment that the review process was slower than usual. From there, they see that their average number of Review Cycles is about 1.2, where most Pull Requests are approved after one review. Also, seems pretty good.
Finally, they found a red flag when they looked at their Time to Merge. They realize that many pull requests stay open for a long time after they’re reviewed as developers move on to new tracks of work. They then agreed to create a target for open lines of work, so that each team member would only work on one feature at a time.
The gut instinct of the team recognized the symptom– long running pull requests– but not the cause. Without data, they couldn’t have uncovered and addressed a deeper systemic problem.
Other data points you may consider looking at:
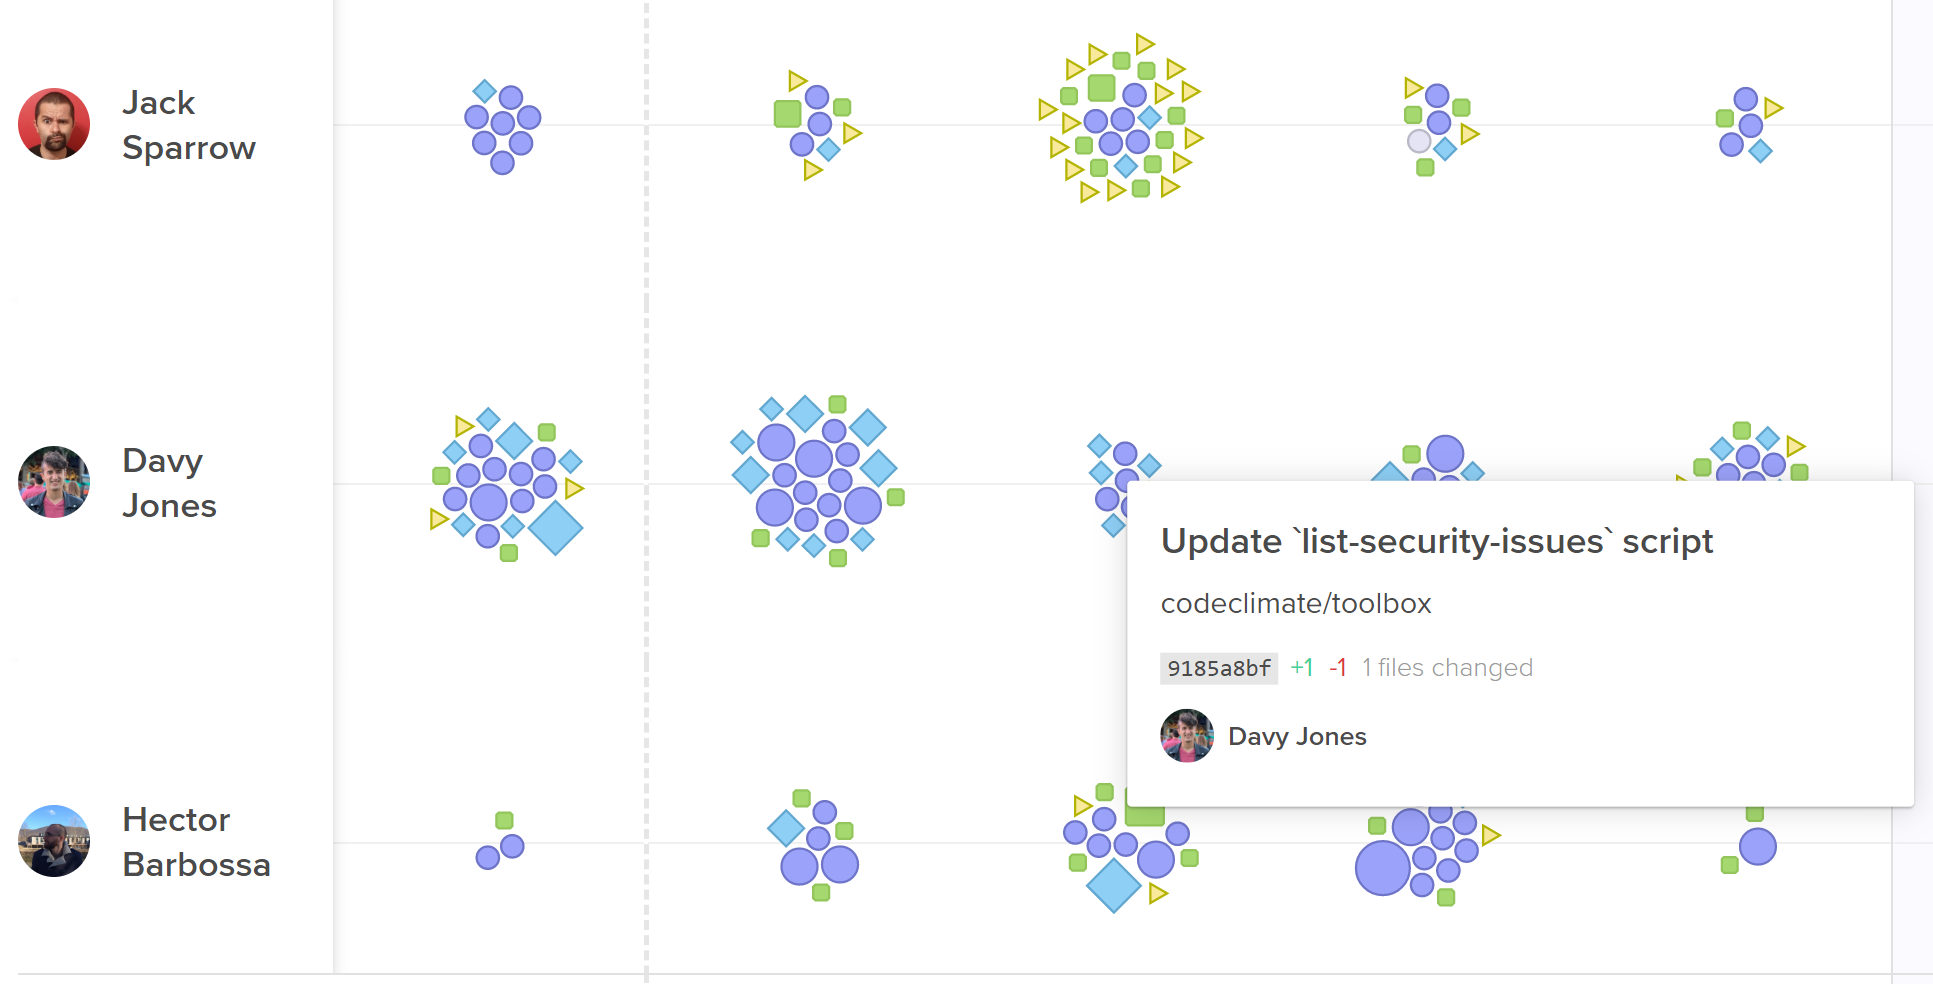
- All recent activities, including Pull Requests, Code Reviews, and Tickets, to remind your team of what they worked on last sprint, and where they might have gotten stuck.
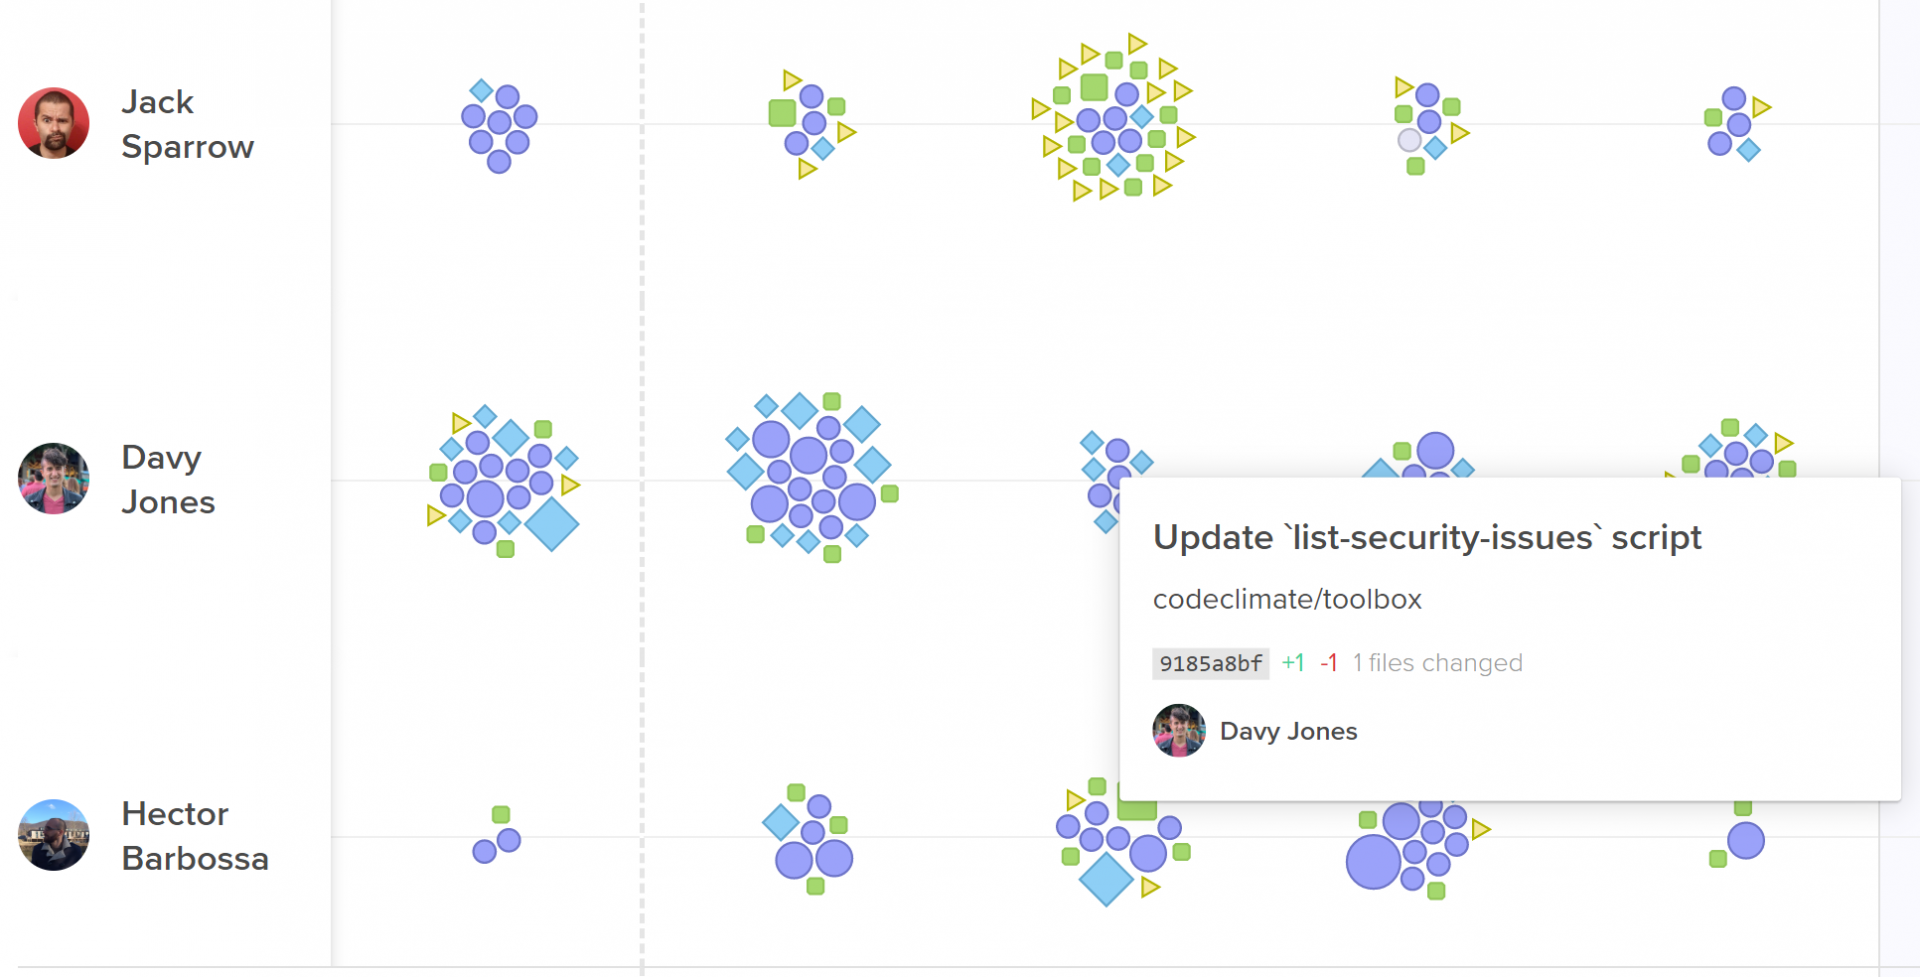
Activity Log represent every engineering activity with a shape.
- The most important pull requests last sprint. Look at pull requests that had a big effect on the codebase, as well as pull requests that were larger or older than the rest.
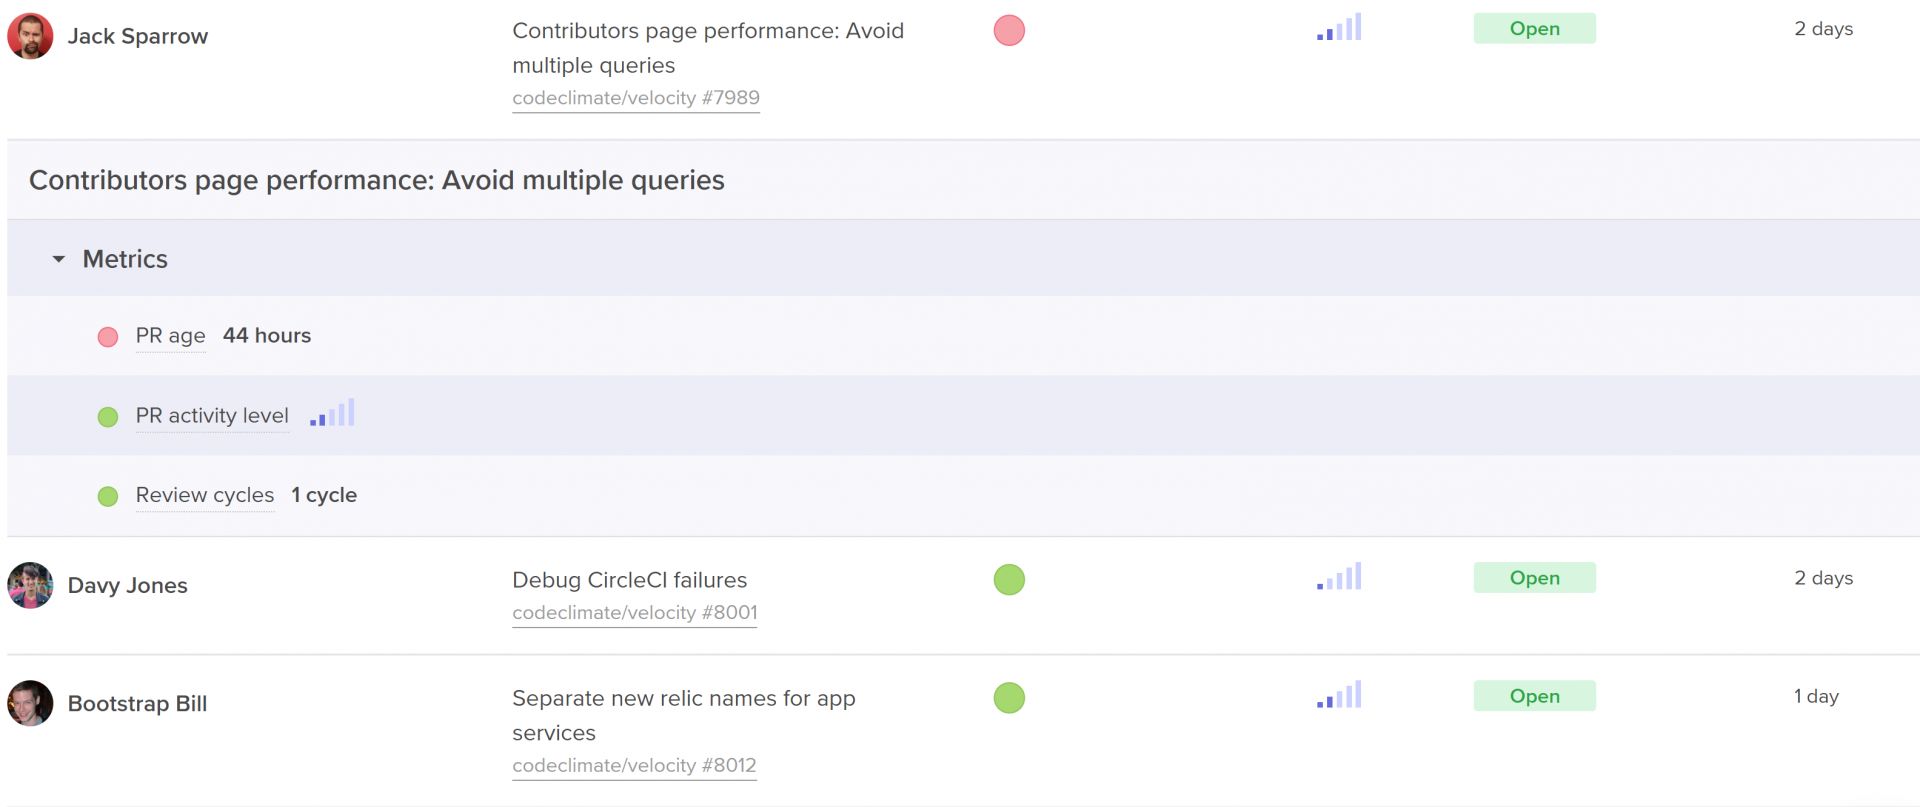
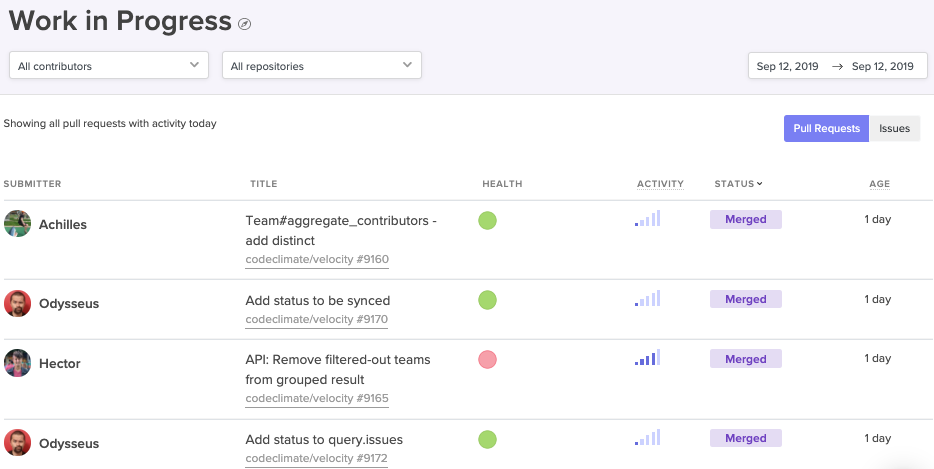
Code Climate's insights show work in progress with activity level, age, and health.
- Process metrics including outcome metrics like Cycle Time and Pull Request Throughput, but also metrics that represent more specific areas of the software development process, like Time to Open, Time to Review, and Time to Merge.
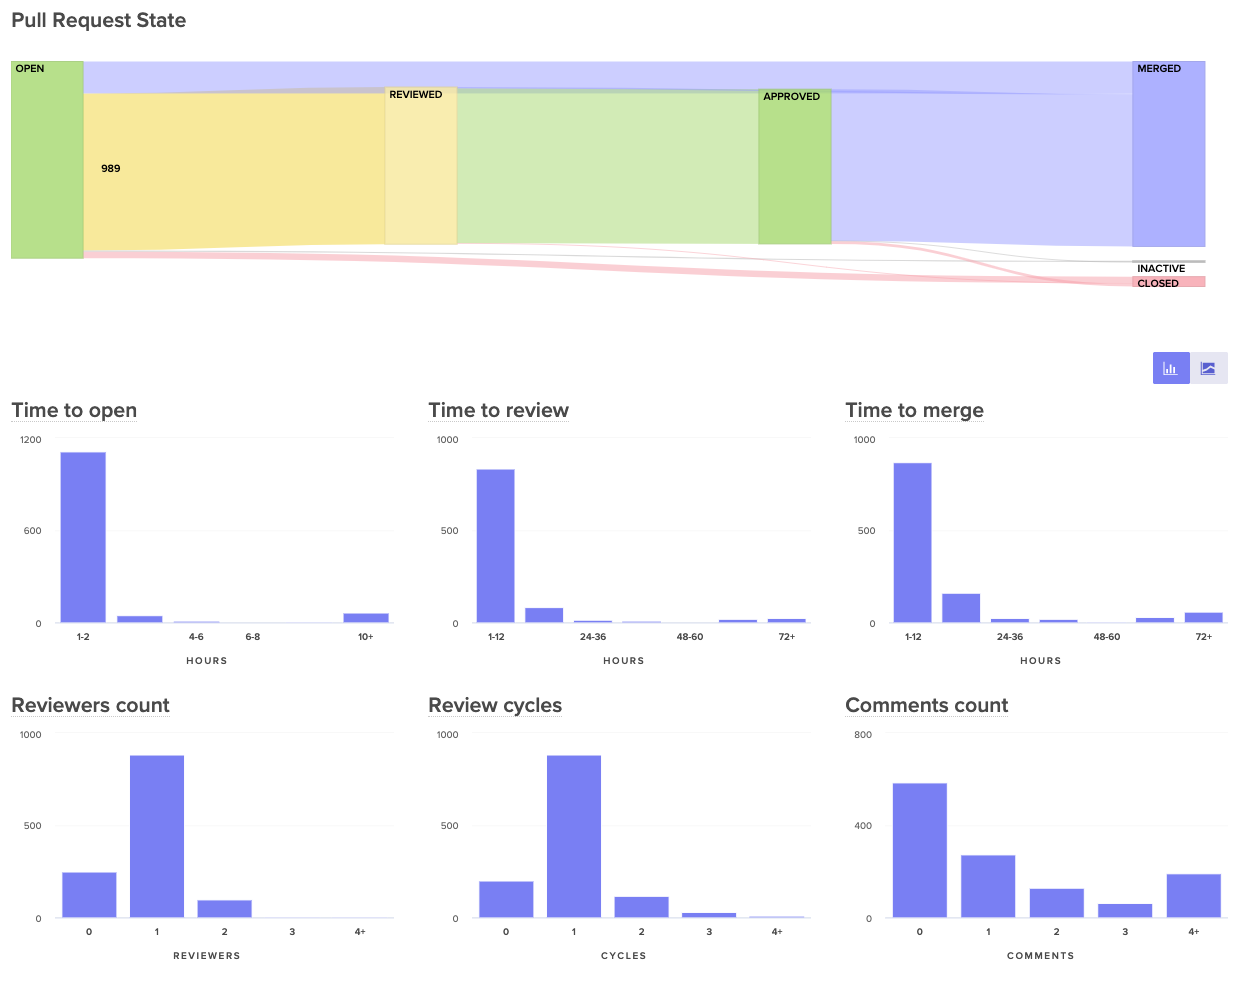
Visualize the journey of your pull requests from open to merged. Below, you can see metrics that represent constituents of this journey to better diagnose slowdowns.
Plan: Align with SMART goals
Once your team has fully diagnosed an issue using both qualitative and quantitative data, they’ll have to decide on one, specific metric that they can use as their SMART goal.
Specific
Success of hitting or missing your metric should be black or white, so you need a concrete number in your goal. “Improving our Time to Review” is vague, “Decreasing our Time to Review to under 4 hours” is specific.
Also, make sure the metric is narrow enough that the team knows which behaviors drive this metric up or down. Metrics that are too broad can obscure progress since they’re affected by many different kinds of unrelated data. Hannah’s team, for example, would want to choose a metric like Time to Merge, rather than total Cycle Time, so the team can easily self-correct when they notice the metric trending in a negative direction.
Measurable
The way in which you measure your metric depends on your objective. If you’re measuring output, for example, a simple count can do the trick. If you’re looking to adhere to specific standards– such as keeping pull requests small, or keeping downtime minimal– you’ll want to decide between tracking the simple average and tracking it as a sort of Service Level Objective (SLO) based on a percentile.
Here are a few examples:
Average Target
SLO Target
Decrease Pull Request Cycle Time to under 1 day.
90% of pull requests should have a cycle time of under 1 day.
Decrease Pull Request Size to an average of 250 lines of code.
Keep 95% of pull requests under 250 lines of code.
Reduce Review Cycles to an average of 1.5 cycles.
Keep 90% of reviews to one cycle.
Reduce Review Speed to an average of 1 hour.
Keep 90% of reviews to under 1 hour.
While averages are more commonly used in process metrics, SLOs enable your team to deviate from the goal in a few instances without hindering their ability to meet the target.
Assignable
Pick one person to own and track this goal. Research has shown that having exactly one team member check in at regular intervals drastically increases the chances that a goal will be hit. Apple championed the idea of a Directly Responsible Individual (DRI) for all initiatives, and teams at leading tech companies like Microsoft have applied the DRI model to all DevOps related functions.
Ownership will also help you secure buy-in for bringing data into retros. Consider asking the person who uncovered the problem in the first place to own the goal.
Realistic
Make sure your goal is reachable, so your team feels success if they’ve put a concerted effort into reaching the goal.
Execute: Increase visibility to keep goals front of mind
The true test of your action items come after the retro. How frequently will your team think about these metrics? Will success be known across the team? If your team is unsuccessful, will they be able to try a different adjustment?
To keep the goal front of mind, you need to make progress visible to everyone on the team. Many managers use information radars, either in shared spaces or in universally accessible dashboards.
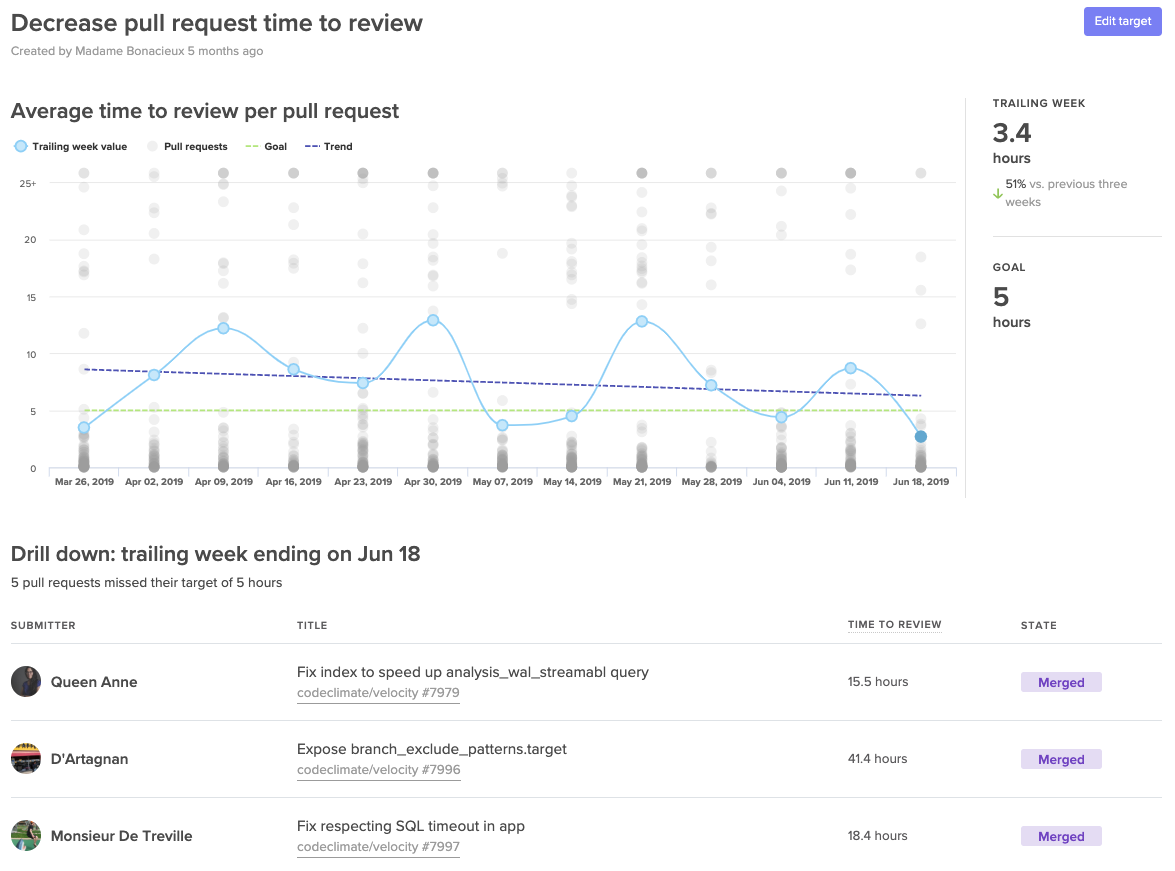
A Target dashboard that lets you visualize progress towards your SMART goals.
Making progress transparent equips the team to bring the results-oriented discussions outside of their retros. Effective goals will be brought up during standups, 1:1s, and even pairing sessions. Repetition will secure focus and will further unify the team around success.
📈 makes engineers 😊
When Boaz Katz, the founder and CTO of Bizzabo, started setting concrete targets he found that sharing success motivated his team to find more ways to improve. He told us, “My team developed a winning attitude and were eager to ship even faster.”
When the whole team sees success each retro, the momentum creates a flywheel effect. Team members are eager to uncover more improvement opportunities creating a culture around enacting positive change to your processes.

“The daily stand up meeting is not another meeting to waste people’s time. It will replace many other meetings giving a net savings several times its own length” –XP Rules
One of three things happens at every standup:
- Issues are omitted.
- Issues are delayed.
- Issues are glossed over.
It may be because a developer doesn’t want to look bad in front of their peers. Or, perhaps, they’d rather have the satisfaction of working through the challenge on their own. Regardless, all developers are subject to biases that sway their decision on whether and when they share critical problems.
One person in the room, however, is usually too far from the codebase to recognize all the issues that are at risk of derailing the sprint. And that person–whether it’s a manager, a team lead, or a scrum master–is usually the one responsible for making sure the team stays on track.
This creates an undesirable dynamic. Those who are closest to the problems don’t have the time to step back and see the forest for the trees. The manager, who is responsible for keeping the sprint on track, doesn’t have the visibility to uncover roadblocks and bottlenecks.
Developers end up inadvertently serving as gatekeepers to critical issues.
To change this dynamic, the manager needs to do a bit of research. Before stepping foot into stand-up, they need to understand early warning signs of risks to the sprint.
Identify the signals through the noise
The first thing the manager should look at is: how fast is the team moving? Is this pace faster or slower than normal?
Currently, most managers track some version of Planned vs. Completed work. They might look at story points or tickets closed. While these are useful for assessing planning effectiveness, they’re not diagnostic. You can’t tell whether the issue is with capacity or efficiency.
A more accurate reflection of pace is an activity metric, such as a Pushes or Commit Count. When activity is lower than normal, the manager knows that there are obstacles holding back the engineers from coding.
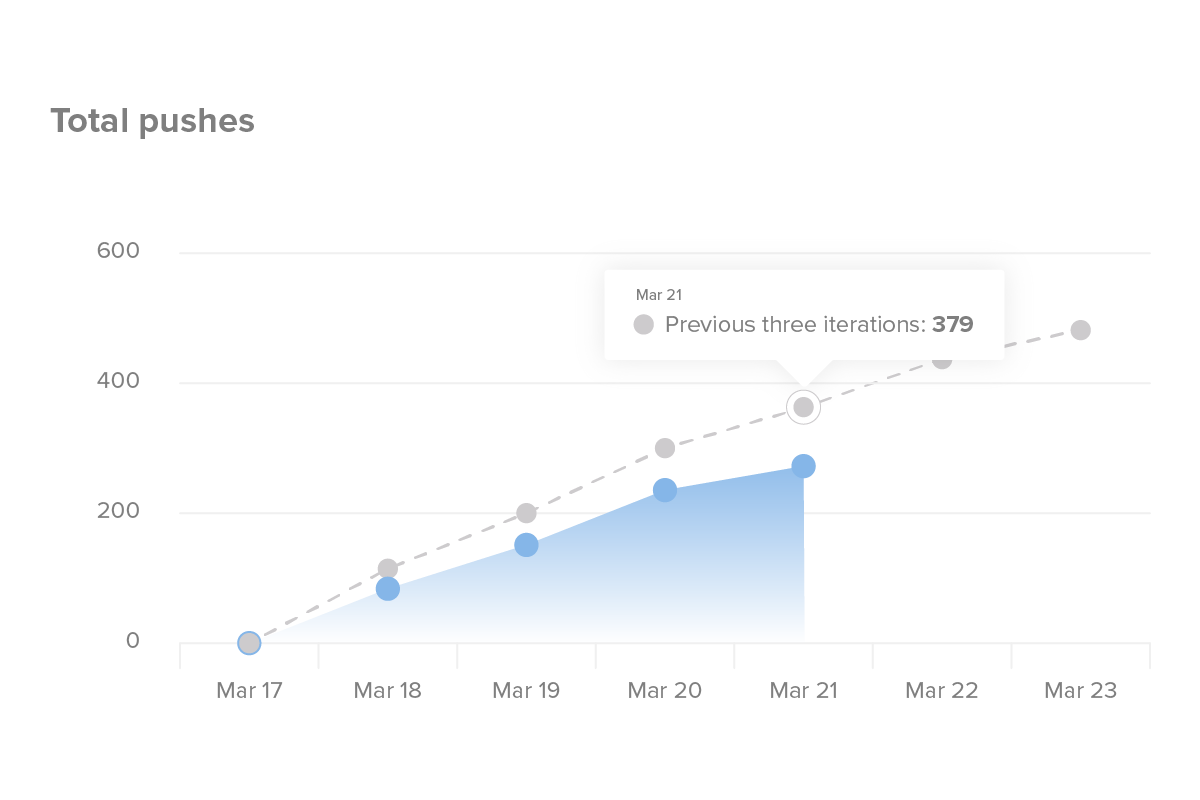
Code Climate’s insights show a burn-up each sprint based on push volume.
If this activity count is low, the manager will want to further investigate where developers might be stuck. They should look out for three red flags:
- Long-running pull requests: Are there pull requests that have been open for more than three business days? If so, who can help get it out the door, or break it up into smaller chunks?
- High review cycles: Is there a pull request that has been passed back and forth between the reviewer and the author several times?
- Large pull requests: Are contributors opening pull requests in small, easy-to-review units? If not, those pull requests are harder to review and at greater risk of causing an issue when they are merged.
Code Climate's insights show work in progress with activity level, age, and health. See at-a-glance the pull requests that are most likely to impede your team.
If pace is slow, yet no pull request is growing unwieldy, you’ll want to pull a list of engineering activities. Check tickets, commits, merges, and reviews to ensure that the team’s work aligns with what was planned and expected.
Activity Log represent every engineering activity with a shape. Hover over to get context on what a team member is working on.
You can surface this information by setting up a Git history statistics tool, like GitStats, and then pull the data before each standup. Or, you can use a Software Engineering Intelligence (SEI) solution like Code Climate to see all of these risks in one place.
Regardless of how you pull the data, spending fifteen minutes to catch up on all the important work in progress ensures that no time is wasted catching up during actual standup.
Shift the conversation toward action
With more shared context, the conversation shifts from talking about problems to talking about solutions. Here are two scenarios played out side by side:
What did you do yesterday?
Dev: Yesterday, I worked on the Activity Log feature. I’m almost done, should be good to ship Friday.Engineering Manager:Great! Anything, in particular, that’s giving you trouble?Dev: Nope.
Dev: Yesterday, I worked on the Activity Log feature. I’m almost done, should be good to ship Friday.Engineering Manager: I saw that you and Dev2 were going back and forth during the code review about how to implement that. It made me realize we haven’t spent enough time talking about the architecture. Let’s grab a whiteboard after standup, and get on the same page.Dev: Yes, that’d be great.
What are you working on today?
Dev: Today, I’m finishing up the Health Check feature. Dev2 had been working on it all week, but they passed it on to me before taking their vacation. Should have everything I need.Engineering Manager:Great, let me know if there’s anything you’re missing.
Dev: Today, I’m finishing up the Health Check feature. Dev2 had been working on it all week, but he passed it on to me before taking their vacation. Should have everything I need.Engineering Manager: I saw that you’re also helping the PM with the feature he’s getting ready to put to design. Let’s touch base about how to fold both of these things into planning.
Anything blocking you?
Dev: Nope.
Dev: Nope.Engineering Manager: I saw that you’ve been working on a PR for a couple of days now. If you’re still having trouble with it, pair with Dev2 to see if you can ship that in a smaller increment.Dev: Sounds great, thanks!
The opportunity to offer support is much greater when you start the conversation with actual data. It takes the onus off of each developer to ask for help and transforms the meeting into a constructive way to keep the team on pace.
Standup is not roll-call
The value in disrupting developers for face-time is to identify and plan for addressing bottlenecks– not for proving that they’re working.
Once time is re-allocated toward identifying risks and ensuring the team is on track to hit this sprint’s goals, you’ll find that finally, the stand-up is providing more value than a meeting that is several times its length.
All that’s required is a bit of preparation.

“I tried everything in the industry: planning vs. execution, burndown charts, story points, time estimation. Finally, this product opened my mind. ” –Boaz Katz, CTO at Bizzabo
When welaunched Velocityabout a year ago, we were driven by our theory that the happiest engineers work on the most productive teams and vice versa. Our analytics tool gave managers an understanding of engineering speed and exactly when slowdowns occur.
After getting the product into the hands of thousands of early users, we were thrilled to discover that customers wanted ways to apply their new insights. They had the visibility to see when something went wrong, but not yet the diagnostic tools to determine the best remedy.
We also uncovered a wide range of priorities and needs across engineering teams. Data that was insightful to a large team was less valuable to a small team. Metrics that revealed coaching opportunities to managers of engineers were less useful to managers of managers. We knew early on that we had to build flexibility into the heart of Velocity.
One year and hundreds of meaningful conversations later, we’ve completely revamped the product.
Today, we’re proud to introduce Velocity 2.0, the most powerful Engineering Intelligence platform ever built.The all-new platform empowers any development team to eliminate bottlenecks and make lasting improvements to their team’s productivity.
Here’s how it works.
Actionability with deeper insights and concrete goals
Velocity 2.0 gives users the ability to drill down to the individual unit of work or habit that makes up a trend. This enables engineering teams to understand the underlying drivers of their productivity, so they can work together to improve the speed of innovation and the quality of software delivered.
With Velocity 2.0, engineering leaders can empower the entire engineering organization to participate in a culture of continuous improvement:
- Engineering Executivescan gauge engineering speed over months or quarters but also slice and dice that same data however they’d like. They can see ROI across various initiatives such as restructuring teams or investing in new technologies.
- Engineering Managershave the visibility to see slowdowns and drill down into precisely why engineers are stuck. This helps them keep current sprints on track, and work with engineers to create optimizations that prevent future bottlenecks.
- Individual Developerswill now have concrete success metrics to track their individual and team progress. This allows them to grow as engineers while supporting team and org objectives.
After engineering teams uncover opportunities for improvement, they can quickly translate them to action by setting measurable Targets within the application. They can then visualize and track progress to hit all their continuous improvement goals.
The industry’s first Targets feature lets you and each team member check in on your goal and how much progress you’ve made as a team.
Flexibility for teams to track what matters most
No two engineering teams are alike.
Some teams are heads-down, trying to ship as many features a possible before a target date, while others are trying to buckle down and prepare for scale. All-remote engineering teams require more communication and check-ins than teams in open offices. Velocity 2.0 is the only engineering analytics platform flexible enough to accommodate any software engineering team.
While Velocity 2.0 works right out of the box, it’s fully configurable. Users have the power to turn on and off whatever reports they care about and set their own definitions of success. Teams can customize:
- Metrics:Any metrics that aren’t currently a focus for your team, you can simply turn off. If your team prefers to not measure activity metrics, like commits or pushes, turn those off to focus more on metrics that represent value delivered, like pull requests merged or deploy volume.
- Algorithms:Build your own health checks based on the metrics you care about most. If “healthy” means a team that pushes small commits, gets through the review process quickly and deploys weekly, then Velocity 2.0 will adjust alerts based on those parameters.
- Thresholds:Mark anything you consider a red flag for the org, a team or an individual, and Velocity will highlight anything that might merit your attention, such as a large pull request, an overburdened developer, or a troublesome code review.
- Reports and Dashboards:Ask any questions that aren’t answered out of the box within the Reports Builder, then save within your own custom designed dashboards.
- Permissions:Some teams prefer to keep reports on a need-to-know basis only, based on role or user. This is particularly useful in cases where new team members are still working on their engineering chops. Set limited permissions so only you and the team member knows how a metric is trending.
Velocity 2.0 allows you to gauge success by your own organization’s definition, not our’s.
The new completely programmable Health Check report enables you to see at a glance how your team is doing this iteration compared to the previous three.
The future of engineering analytics
Velocity 2.0 is just the next step on our mission to create a more data-driven engineering world. With more visibility and the tools to take action, every software engineering team can boost their speed innovation, which, in turn, allows us as an industry, to overcome some of our biggest challenges, faster.
We’re incredibly grateful to our early users whose feedback was integral to the development of Velocity 2.0. Here’s what some of them had to say about it:
“Velocity’s Reports Builder has helped our team gain new insights into any potential bottlenecks in our sprints allowing us to definitively track our team progress, accelerate code reviews, pull data to match insights in retros and one-on-ones, and ultimately ship value to our customers significantly faster.” – Jacob Boudreau, CTO at Stord
“Thanks to Velocity, we’ve been able to actually get to a point where we’re doing atomic commits, everyone is committing more frequently, and reviews are easier.” – Chelsea Worrel, Software Engineer at Tangoe
“I’ve never seen anything quite like Velocity.” –Josh Castagno, Engineering Manager at Springbuk
Velocity 2.0 is most powerful when you can see it with your own data. Request a demo here.