Resources & Insights
Featured Article
Navigating the world of software engineering or developer productivity insights can feel like trying to solve a complex puzzle, especially for large-scale organizations. It's one of those areas where having a cohesive strategy can make all the difference between success and frustration. Over the years, as I’ve worked with enterprise-level organizations, I’ve seen countless instances where a lack of strategy caused initiatives to fail or fizzle out.
In my latest webinar, I breakdown the key components engineering leaders need to consider when building an insights strategy.
Why a Strategy Matters
At the heart of every successful software engineering team is a drive for three things:
- A culture of continuous improvement
- The ability to move from idea to impact quickly, frequently, and with confidence
- A software organization delivering meaningful value
These goals sound simple enough, but in reality, achieving them requires more than just wishing for better performance. It takes data, action, and, most importantly, a cultural shift. And here's the catch: those three things don't come together by accident.
In my experience, whenever a large-scale change fails, there's one common denominator: a lack of a cohesive strategy. Every time I’ve witnessed a failed attempt at implementing new technology or making a big shift, the missing piece was always that strategic foundation. Without a clear, aligned strategy, you're not just wasting resources—you’re creating frustration across the entire organization.
Sign up for a free, expert-led insights strategy workshop for your enterprise org.
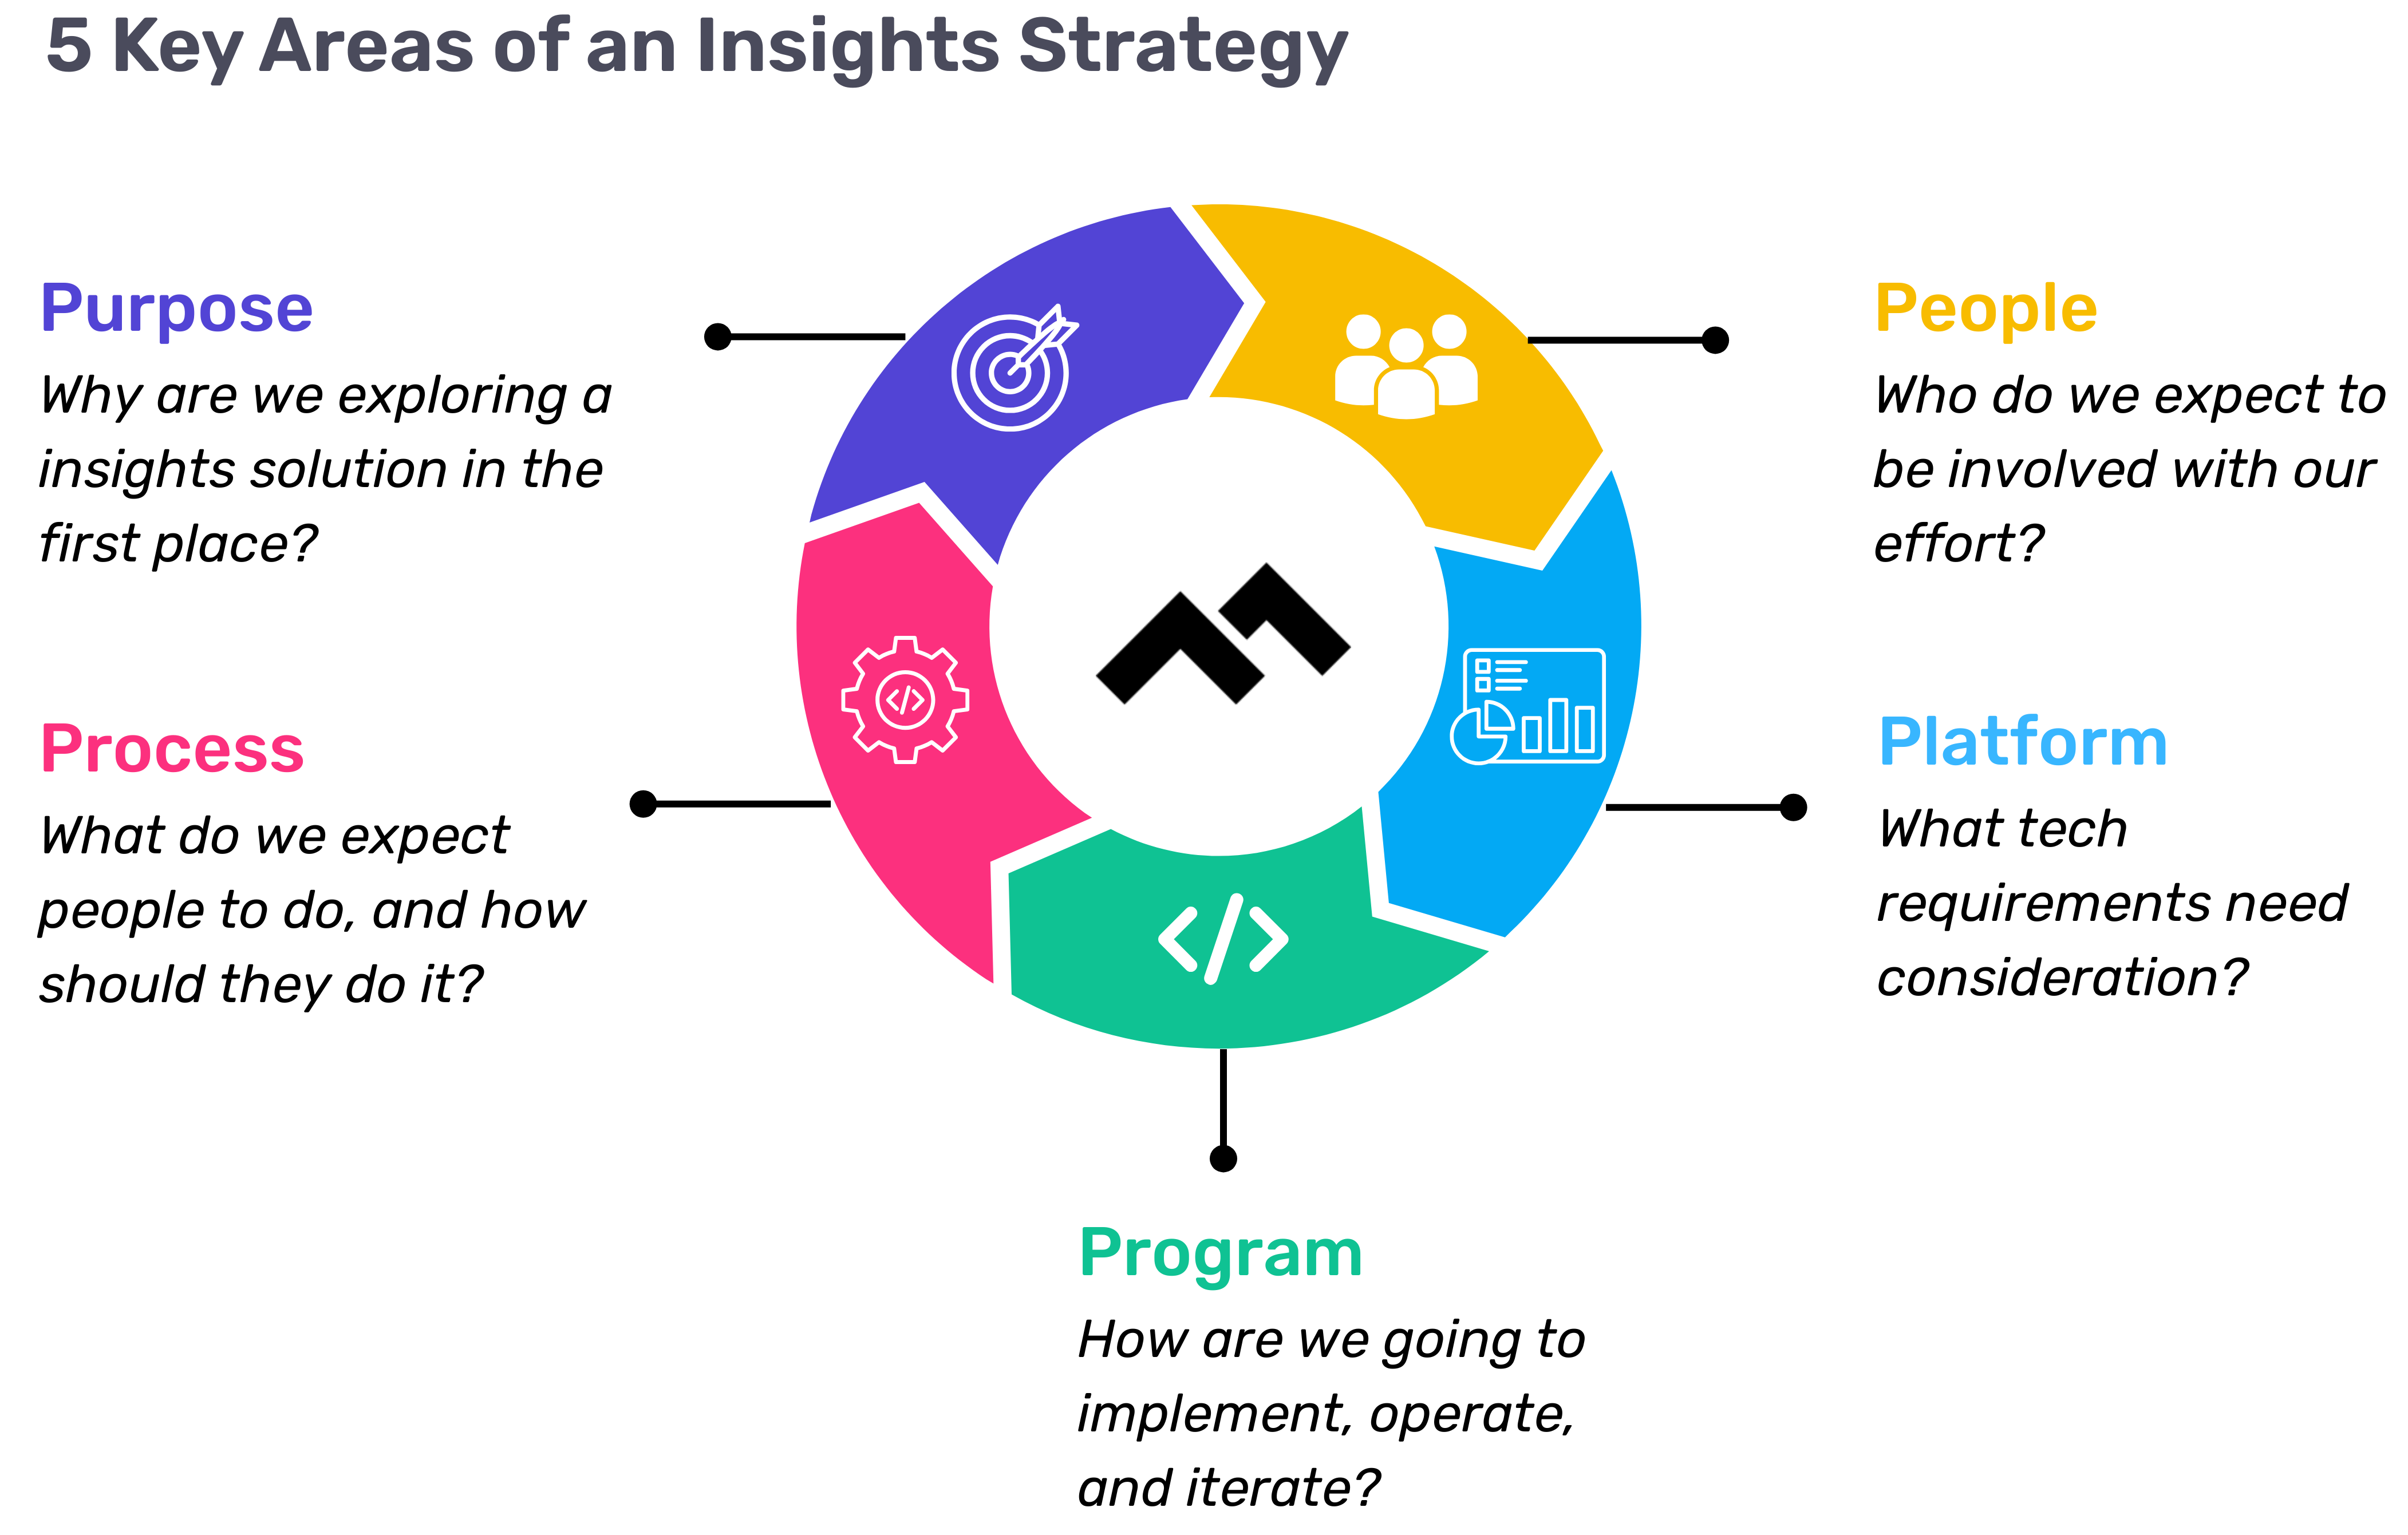
Step 1: Define Your Purpose
The first step in any successful engineering insights strategy is defining why you're doing this in the first place. If you're rolling out developer productivity metrics or an insights platform, you need to make sure there’s alignment on the purpose across the board.
Too often, organizations dive into this journey without answering the crucial question: Why do we need this data? If you ask five different leaders in your organization, are you going to get five answers, or will they all point to the same objective? If you can’t answer this clearly, you risk chasing a vague, unhelpful path.
One way I recommend approaching this is through the "Five Whys" technique. Ask why you're doing this, and then keep asking "why" until you get to the core of the problem. For example, if your initial answer is, “We need engineering metrics,” ask why. The next answer might be, “Because we're missing deliverables.” Keep going until you identify the true purpose behind the initiative. Understanding that purpose helps avoid unnecessary distractions and lets you focus on solving the real issue.
Step 2: Understand Your People
Once the purpose is clear, the next step is to think about who will be involved in this journey. You have to consider the following:
- Who will be using the developer productivity tool/insights platform?
- Are these hands-on developers or executives looking for high-level insights?
- Who else in the organization might need access to the data, like finance or operations teams?
It’s also crucial to account for organizational changes. Reorgs are common in the enterprise world, and as your organization evolves, so too must your insights platform. If the people responsible for the platform’s maintenance change, who will ensure the data remains relevant to the new structure? Too often, teams stop using insights platforms because the data no longer reflects the current state of the organization. You need to have the right people in place to ensure continuous alignment and relevance.
Step 3: Define Your Process
The next key component is process—a step that many organizations overlook. It's easy to say, "We have the data now," but then what happens? What do you expect people to do with the data once it’s available? And how do you track if those actions are leading to improvement?
A common mistake I see is organizations focusing on metrics without a clear action plan. Instead of just looking at a metric like PR cycle times, the goal should be to first identify the problem you're trying to solve. If the problem is poor code quality, then improving the review cycle times might help, but only because it’s part of a larger process of improving quality, not just for the sake of improving the metric.
It’s also essential to approach this with an experimentation mindset. For example, start by identifying an area for improvement, make a hypothesis about how to improve it, then test it and use engineering insights data to see if your hypothesis is correct. Starting with a metric and trying to manipulate it is a quick way to lose sight of your larger purpose.
Step 4: Program and Rollout Strategy
The next piece of the puzzle is your program and rollout strategy. It’s easy to roll out an engineering insights platform and expect people to just log in and start using it, but that’s not enough. You need to think about how you'll introduce this new tool to the various stakeholders across different teams and business units.
The key here is to design a value loop within a smaller team or department first. Get a team to go through the full cycle of seeing the insights, taking action, and then quantifying the impact of that action. Once you've done this on a smaller scale, you can share success stories and roll it out more broadly across the organization. It’s not about whether people are logging into the platform—it’s about whether they’re driving meaningful change based on the insights.
Step 5: Choose Your Platform Wisely
And finally, we come to the platform itself. It’s the shiny object that many organizations focus on first, but as I’ve said before, it’s the last piece of the puzzle, not the first. Engineering insights platforms like Code Climate are powerful tools, but they can’t solve the problem of a poorly defined strategy.
I’ve seen organizations spend months evaluating these platforms, only to realize they didn't even know what they needed. One company in the telecom industry realized that no available platform suited their needs, so they chose to build their own. The key takeaway here is that your platform should align with your strategy—not the other way around. You should understand your purpose, people, and process before you even begin evaluating platforms.
Looking Ahead
To build a successful engineering insights strategy, you need to go beyond just installing a tool. An insights platform can only work if it’s supported by a clear purpose, the right people, a well-defined process, and a program that rolls it out effectively. The combination of these elements will ensure that your insights platform isn’t just a dashboard—it becomes a powerful driver of change and improvement in your organization.
Remember, a successful software engineering insights strategy isn’t just about the tool. It’s about building a culture of data-driven decision-making, fostering continuous improvement, and aligning all your teams toward achieving business outcomes. When you get that right, the value of engineering insights becomes clear.
Want to build a tailored engineering insights strategy for your enterprise organization? Get expert recommendations at our free insights strategy workshop. Register here.Register here.
Andrew Gassen has guided Fortune 500 companies and large government agencies through complex digital transformations. He specializes in embedding data-driven, experiment-led approaches within enterprise environments, helping organizations build a culture of continuous improvement and thrive in a rapidly evolving world.
Navigating the world of software engineering or developer productivity insights can feel like trying to solve a complex puzzle, especially for large-scale organizations. It's one of those areas where having a cohesive strategy can make all the difference between success and frustration. Over the years, as I’ve worked with enterprise-level organizations, I’ve seen countless instances where a lack of strategy caused initiatives to fail or fizzle out.
In my latest webinar, I breakdown the key components engineering leaders need to consider when building an insights strategy.
Why a Strategy Matters
At the heart of every successful software engineering team is a drive for three things:
- A culture of continuous improvement
- The ability to move from idea to impact quickly, frequently, and with confidence
- A software organization delivering meaningful value
These goals sound simple enough, but in reality, achieving them requires more than just wishing for better performance. It takes data, action, and, most importantly, a cultural shift. And here's the catch: those three things don't come together by accident.
In my experience, whenever a large-scale change fails, there's one common denominator: a lack of a cohesive strategy. Every time I’ve witnessed a failed attempt at implementing new technology or making a big shift, the missing piece was always that strategic foundation. Without a clear, aligned strategy, you're not just wasting resources—you’re creating frustration across the entire organization.
Sign up for a free, expert-led insights strategy workshop for your enterprise org.
Step 1: Define Your Purpose
The first step in any successful engineering insights strategy is defining why you're doing this in the first place. If you're rolling out developer productivity metrics or an insights platform, you need to make sure there’s alignment on the purpose across the board.
Too often, organizations dive into this journey without answering the crucial question: Why do we need this data? If you ask five different leaders in your organization, are you going to get five answers, or will they all point to the same objective? If you can’t answer this clearly, you risk chasing a vague, unhelpful path.
One way I recommend approaching this is through the "Five Whys" technique. Ask why you're doing this, and then keep asking "why" until you get to the core of the problem. For example, if your initial answer is, “We need engineering metrics,” ask why. The next answer might be, “Because we're missing deliverables.” Keep going until you identify the true purpose behind the initiative. Understanding that purpose helps avoid unnecessary distractions and lets you focus on solving the real issue.
Step 2: Understand Your People
Once the purpose is clear, the next step is to think about who will be involved in this journey. You have to consider the following:
- Who will be using the developer productivity tool/insights platform?
- Are these hands-on developers or executives looking for high-level insights?
- Who else in the organization might need access to the data, like finance or operations teams?
It’s also crucial to account for organizational changes. Reorgs are common in the enterprise world, and as your organization evolves, so too must your insights platform. If the people responsible for the platform’s maintenance change, who will ensure the data remains relevant to the new structure? Too often, teams stop using insights platforms because the data no longer reflects the current state of the organization. You need to have the right people in place to ensure continuous alignment and relevance.
Step 3: Define Your Process
The next key component is process—a step that many organizations overlook. It's easy to say, "We have the data now," but then what happens? What do you expect people to do with the data once it’s available? And how do you track if those actions are leading to improvement?
A common mistake I see is organizations focusing on metrics without a clear action plan. Instead of just looking at a metric like PR cycle times, the goal should be to first identify the problem you're trying to solve. If the problem is poor code quality, then improving the review cycle times might help, but only because it’s part of a larger process of improving quality, not just for the sake of improving the metric.
It’s also essential to approach this with an experimentation mindset. For example, start by identifying an area for improvement, make a hypothesis about how to improve it, then test it and use engineering insights data to see if your hypothesis is correct. Starting with a metric and trying to manipulate it is a quick way to lose sight of your larger purpose.
Step 4: Program and Rollout Strategy
The next piece of the puzzle is your program and rollout strategy. It’s easy to roll out an engineering insights platform and expect people to just log in and start using it, but that’s not enough. You need to think about how you'll introduce this new tool to the various stakeholders across different teams and business units.
The key here is to design a value loop within a smaller team or department first. Get a team to go through the full cycle of seeing the insights, taking action, and then quantifying the impact of that action. Once you've done this on a smaller scale, you can share success stories and roll it out more broadly across the organization. It’s not about whether people are logging into the platform—it’s about whether they’re driving meaningful change based on the insights.
Step 5: Choose Your Platform Wisely
And finally, we come to the platform itself. It’s the shiny object that many organizations focus on first, but as I’ve said before, it’s the last piece of the puzzle, not the first. Engineering insights platforms like Code Climate are powerful tools, but they can’t solve the problem of a poorly defined strategy.
I’ve seen organizations spend months evaluating these platforms, only to realize they didn't even know what they needed. One company in the telecom industry realized that no available platform suited their needs, so they chose to build their own. The key takeaway here is that your platform should align with your strategy—not the other way around. You should understand your purpose, people, and process before you even begin evaluating platforms.
Looking Ahead
To build a successful engineering insights strategy, you need to go beyond just installing a tool. An insights platform can only work if it’s supported by a clear purpose, the right people, a well-defined process, and a program that rolls it out effectively. The combination of these elements will ensure that your insights platform isn’t just a dashboard—it becomes a powerful driver of change and improvement in your organization.
Remember, a successful software engineering insights strategy isn’t just about the tool. It’s about building a culture of data-driven decision-making, fostering continuous improvement, and aligning all your teams toward achieving business outcomes. When you get that right, the value of engineering insights becomes clear.
Want to build a tailored engineering insights strategy for your enterprise organization? Get expert recommendations at our free insights strategy workshop. Register here.Register here.
Andrew Gassen has guided Fortune 500 companies and large government agencies through complex digital transformations. He specializes in embedding data-driven, experiment-led approaches within enterprise environments, helping organizations build a culture of continuous improvement and thrive in a rapidly evolving world.
All Articles

Velocity now features a comprehensive view of developer work-in-progress, performance, and skill development — all in one place.
The information required to lead an engineering team is increasingly scattered.
To answer even simple questions like ‘How is my team performing?’ and ‘Is our current sprint on track?’ an engineering manager may need to check as many as ten different systems — version control, project management, feature flags, DevOps tools, and incident management, to name a few. Even so, this fragmented means of information seeking often doesn’t provide a clear answer.
What’s more, a lack of visibility upstream can lead to significant negative effects downstream, like:
- Broken sprints and missed milestones
- Burnt-out developers and high employee turnover
- Inability to actively manage developer performance and achieve excellence as a team
We believe that in order to create a culture that both motivates engineers and improves their ability to drive innovation, managers need a comprehensive picture of where their team members are succeeding and where they can improve.
Our mission at Code Climate is to empower leaders with tools to drive high-performance. Today, as the next step in this mission, we’re launching Velocity’s newest feature, Developer360, to enable managers to build elite organizations with data-driven insights.
Support engineering excellence with a comprehensive view of developer work, performance, and skills — all in one place.
What’s Developer360?
In order to empower their team to achieve excellence, every manager needs a quick way of knowing:
- What are engineers on my team working on? Is anyone stuck right now?
- How are junior team members developing their foundational skills? What challenges have they been facing?
- What’s in each developer’s technical toolbox? Are there any language gaps on my team?
Developer360 gives you instant visibility into your developer’s active work, improvements along key metrics, and skills.
Identify High-Risk Pull Requests
Frontline managers typically rely on stand-ups to check in on work-in-progress. But despite great intentions, even the best engineering teams don’t always bring up issues early.
The Snapshot report brings potential WIP issues to your attention before they derail one of your sprints.
The all-new Velocity Feed (far right) provides a chronological visualization of all an engineer’s recent work, including commits, requested changes, and opened or closed PRs.
With a scan of this report, you can start each day already aware of what’s been taking up a developer’s attention as well as what challenges they’ve been facing.
Scope the Opportunity for Improvement
The more time engineering managers spend providing engineers with proper guidance, the more they’re investing in their team’s future.
The Foundations tab is a source of quantitative data managers can bring to coaching sessions. At a glance, a manager can see each contributor’s average over a given time period, how they’ve trended over that period, and their percentile performance.
Dig into a capacity metric like Impact, which measures the magnitude of changes to the codebase over a period of time. This metric can help you uncover high performers who may deserve recognition, or serve as an early warning sign that this team member may be in need of some coaching.
Incorporate this data into 1:1s and performance conversations to check your biases, come to a shared understanding of where strengths and weaknesses lie, and set quantitative, actionable goals.
Support Your Engineers’ Professional Growth
Part of an engineering manager’s job is knowing what coding languages each developer has been working in so that they can distribute upcoming work, track migrations, and support professional development.
The Skills tab provides a visual summary of a developer’s technical toolbox, so that managers can come to planning and coaching sessions already aware of what skills each engineer has mastered (and what they’re still learning).
Get a sense of an engineer’s language gaps, and work with them to improve their expertise.
Data-Driven Coaching for High-Performance Teams
Engineering is only as strong as its contributors, and as such, building a culture of excellence starts on the individual level. Establishing a complete and shared understanding of how contributors are performing on a micro level will allow you to level-up the way your team is working on a macro level.
When developers are empowered to perform at their best, the entire organization benefits:
- Product is happy when changes can be deployed at a predictable pace.
- Sales can more effectively drive revenue with new features to show prospects.
- Stakeholders see value delivered to customers more frequently.
We’re excited to build on top of Developer360 in our mission to provide engineering leaders with the visibility required to level up their teams. This is just the start of our undertaking to establish Velocity as the single source of truth for software engineering.
Sign up for Velocity to drive high-performance on your team with a 360° view into developer work.

“Meetings are expensive in person, and they’re even more expensive remotely. There’s a psychological overhead to bringing people together in a remote setting,” told us Noah Davis in his webinar on how engineering leaders can use data to run more effective remote meetings.
As teams go remote, the function of meetings changes. Team members lack context and use meetings to play catch-up rather than to discuss and make critical improvements. But when managers use remote meetings as status updates, they’re squandering the opportunity to help their team in the long-term.
In addition to advising hundreds of customers on data-driven best practices, Code Climate Co-Founder and VP of Customer Success, Noah Davis has nearly a decade of experience helping both developers and managers improve the speed and quality of engineering work.
"Assume best intentions of your engineers. Focus on the work, not the individual. Look for ways you can help."
In this webinar, Noah explained how to dig into engineering data from Velocity reports to get your team on the same page and keep meetings focused and productive. He shared actionable tips for spotting daily, weekly, and monthly trends in your data, so you can ensure that:
- Stand-ups are about unblocking engineers, not catching managers up
- Retros are about helping your team diagnose problems and process fault lines, not venting
- 1:1s are about constructive feedback and career development, not micromanaging
Noah pointed out that by walking into meetings already context-aware, you can replace check-ins with more informed conversations about how the team can stay on track.
In light of current global circumstances, our annual one-day conference for engineering leaders is going virtual, with a new, more interactive format. Over the course of six weeks, we’ll be hosting a series of remote fireside chats with senior engineering leaders from a range of industries. Each session will be followed by a Q&A with our guest, as well as a topical discussion moderated by our sponsor, LaunchDarkly.
The series kicks off on June 18th with our first session. From there, we’ll present a new chat every week, featuring leaders from Buffer, Netflix, Stripe, and more. Conversations will focus on ways to succeed in senior leadership by driving high performance in your organization. Topics include driving continuous improvement, upleveling managers with data, fostering a culture of diversity and inclusion, and maintaining engineering tempo at scale.
Follow us on Twitter and LinkedIn to learn more about our featured guests.
The Engineering Leadership Summit: Virtual Edition is sponsored by LaunchDarkly, the feature management platform developers and operations teams use to eliminate risk from their software development cycles.

When global circumstances required our team to go completely remote, we knew things would be tough. Team members wouldn’t just be working from home; they’d be working from home during a time of intense fear and uncertainty, with a myriad of new concerns and distractions. We expected that engineering activity would decline as a result, and we were understanding — as our VP of Engineering, Ale Paredes, explained during a panel on working remotely through the crisis, “We’re not trying to behave as if it’s business as usual, because it’s not business as usual.”
But when Ale checked the team’s productivity metrics, she was surprised by what she found. After we made the switch to a distributed workflow, many engineers actually started working more. Still, despite logging more time in the codebase, they were getting less done.
To find out why the team wasn’t making progress, Ale dug deeper into the data. Not only did she find answers, she used that information to develop better ways to support the team.
Engineering Metrics Served as a Diagnostic Tool
Ale and the engineering team regularly track certain key metrics, using data about Pull Request Throughput, Cycle Time, and Incidents to get a sense of how they’re doing. They review this information on a bi-weekly basis, so they can address red flags as early as possible or replicate processes that are having a positive impact.
When something appears to be trending in a concerning direction, the team drills down deeper into the data, then uses that information as a starting point for troubleshooting conversations.
After the team transitioned to a fully-distributed workflow, they noticed that their Pull Request Throughput was significantly lower than usual.
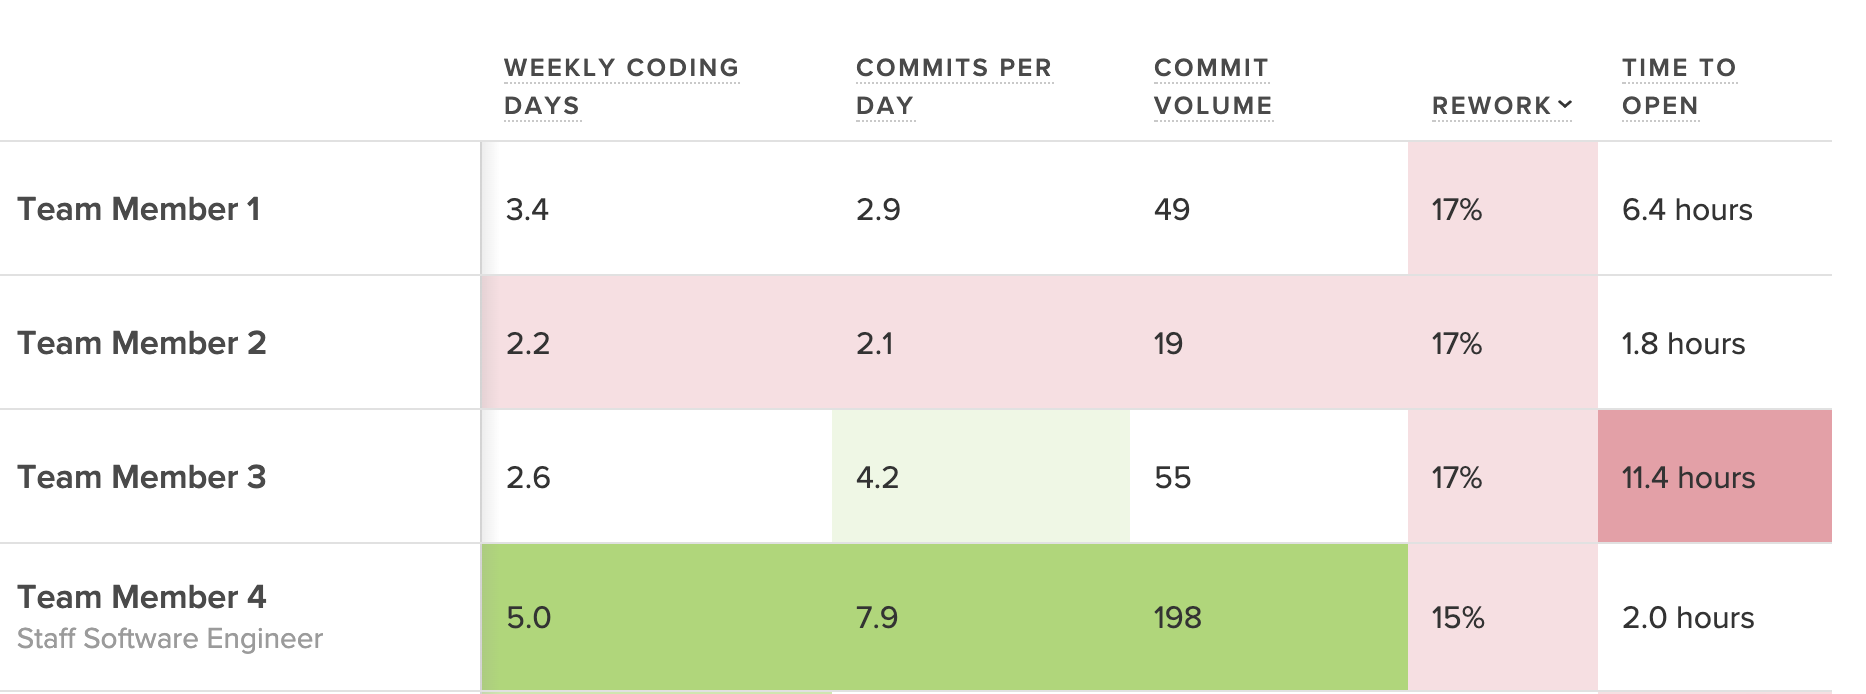
Knowing that the team was merging fewer Pull Requests than expected, Ale took a closer look at the stages of the coding process to find out why. This investigation included a look at:
- Time to Open: The time between a developer’s first commit and the opening of an associated Pull Request. If the team simply wasn’t pushing commits in the first place, it could be a sign that their attention was focused elsewhere, or that they were being sidelined by anxiety or emotional stress. If developers were coding but not opening PRs, they could be confused about project specifications.
- Time to First Review: The period between when a Pull Request is opened, and when it’s picked up for review. A slowdown here could mean that physical distance was causing engineers to focus on their own work and deprioritize assisting their teammates.
- Time to Approve: The period of time a PR spends in the code review process. If PRs were getting stuck in code review, it could indicate a lack of alignment between members of the team.
- Time to Deploy: The actual deployment process. A holdup at this phase could be the result of technical issues or a lack of confidence in new code.
As she dug into the metrics, Ale saw that Time to Open was the source of the slowdown. The engineering team was clearly working — they were pushing commits, and actively coding — but they were completing a higher than usual percentage of Rework. Something was keeping the team writing and rewriting the same pieces of code, which concerned Ale. “Beyond the waste itself, which is not great, I worried that if we didn’t address the issue right away, it could impact team morale.”
Improved Communication Helped Decrease Levels of Rework
With this information, Ale approached the engineering team’s squad leads “to try to understand what was blocking the team, and to identify how we could work together to create a process that was more streamlined.” Through these conversations, Ale discovered that individual developers were getting hung up as a result of miscommunications and unclear specs.
Though the team was having regular remote meetings, developers still lacked the information they needed to do their work. “People didn’t have the same amount of context,” Ale found. “We used to rely on the fact that we were all together in the office so that if I had something to say, the person next to me would hear it…our team is small enough that usually, everyone on the team has context.”
Without a process in place for sharing this big-picture information, engineers were getting left in the dark. They didn’t always know how their work fit into the project as a whole, so they were making assumptions, some of which were incorrect. At the same time, “we noticed that people were using direct messages to communicate, so everyone had slightly different bits of information,” and developers were forced to continually revise their work as new information came to light.
Armed with these realizations, Ale and the team were able to create new processes to combat misinformation and enhance transparency:
- They created systems for intentional public communication. Discussions were moved to a team public Slack channel, with particularly complex conversations happening in groups over Zoom. Decisions were logged in Jira, with each engineer responsible for adding relevant comments to any issues they own, so the rest of the team could reference them when needed.
- They leaned more heavily on documentation. For each new feature, the team worked with Product to draw up a detailed spec document. These documents were then discussed at kickoff meetings for each new track of work so that everyone could see the details and ask questions. For projects that required more in-depth technical design, engineers would write a Request for Comment document and store it in markdown format in GitHub, so teammates could leave comments as part of the code review process.
- They wrote down and shared their plans. Each week, the team wrote down their plans for the next few days and shared them with the rest of the team.
- They fostered a culture of sharing. Though she’s always done it, Ale made a continued effort to encourage senior engineers to use the team public Slack channel to discuss challenges and think through solutions, so that team members feel safer raising questions and admitting confusion.
With the new processes in place, the team kept an eye on the metrics to evaluate their success.
The Productive and Human Benefits of Increased Transparency
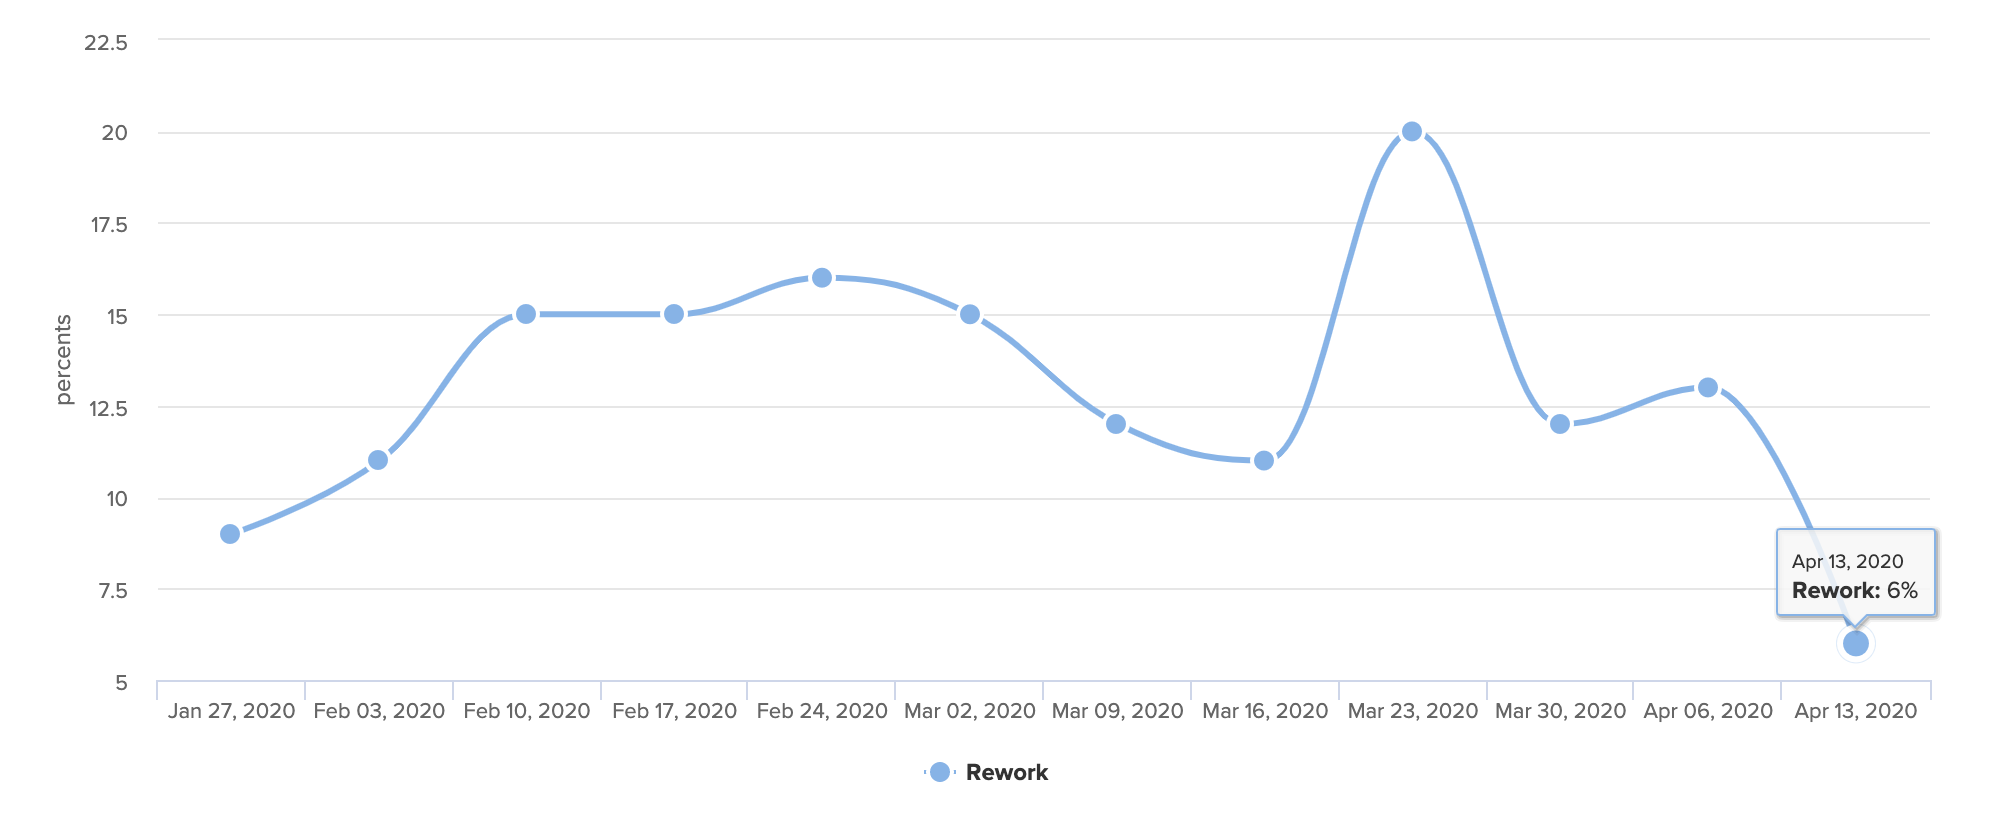
The new processes helped increase transparency, reduce confusion, and boost productivity.
In a span of four weeks, Rework fell from a high of 20% to just 6%.
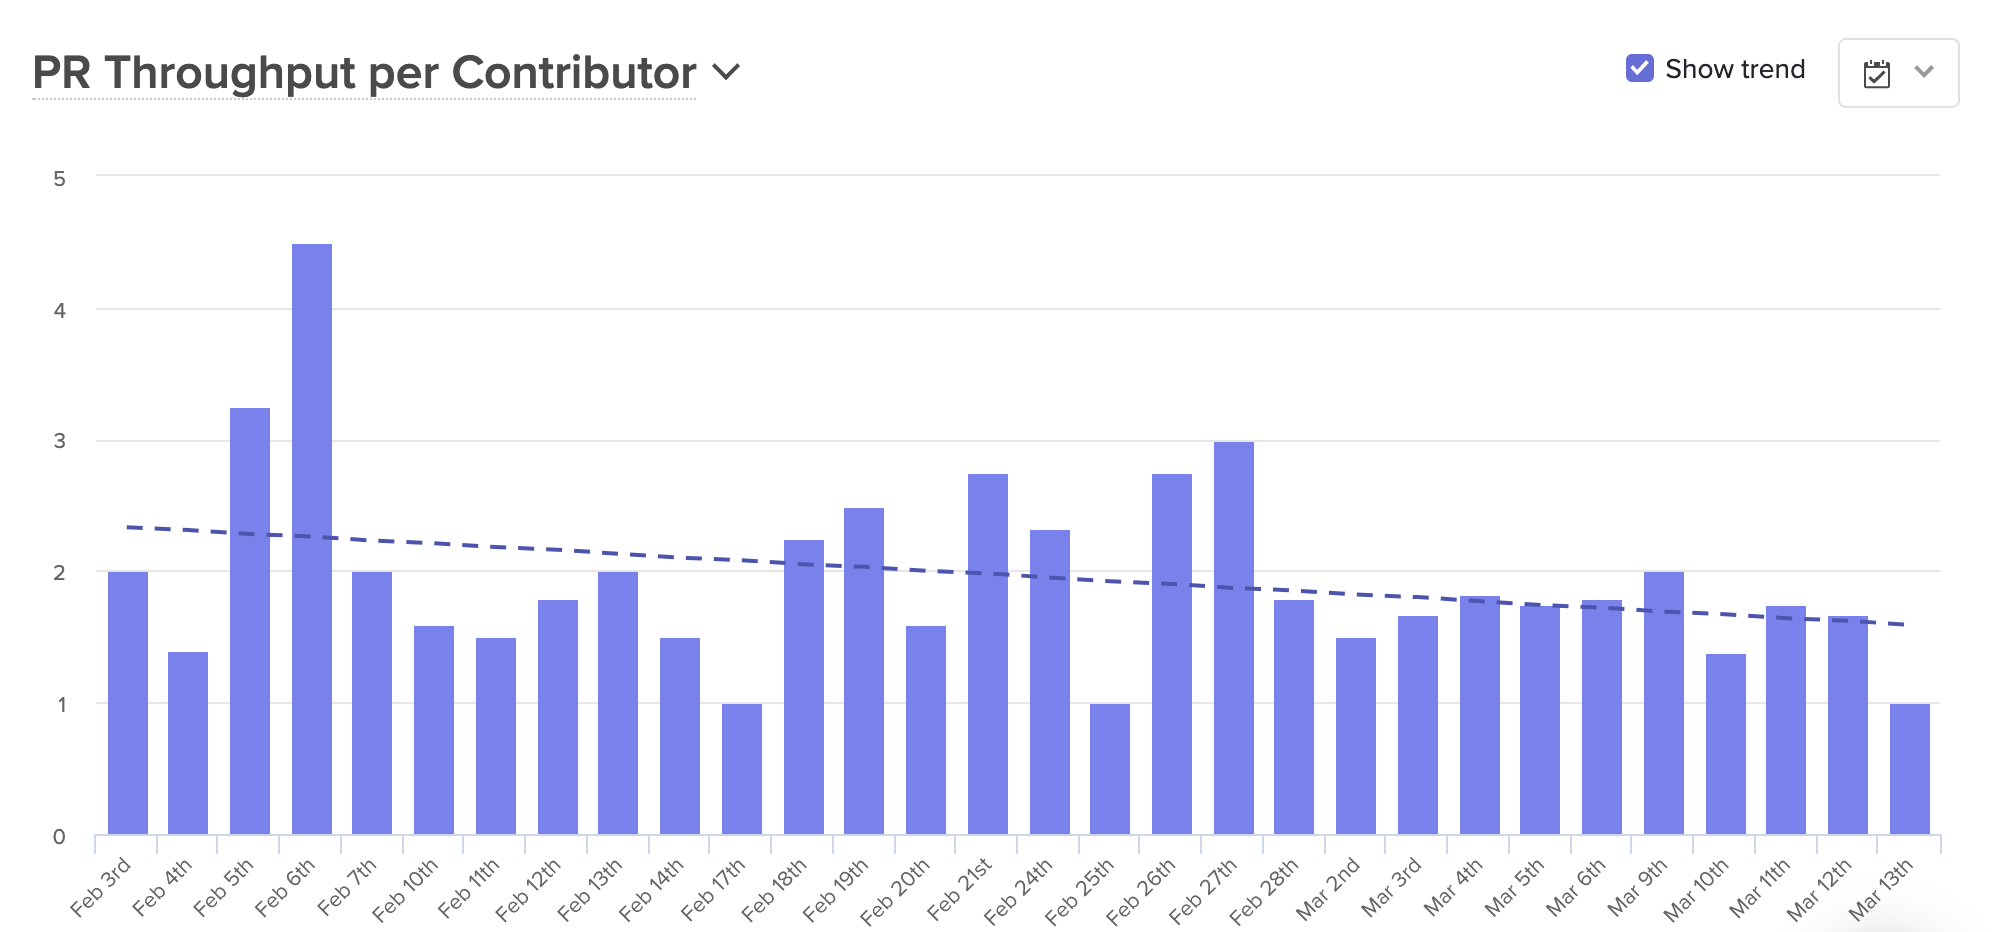
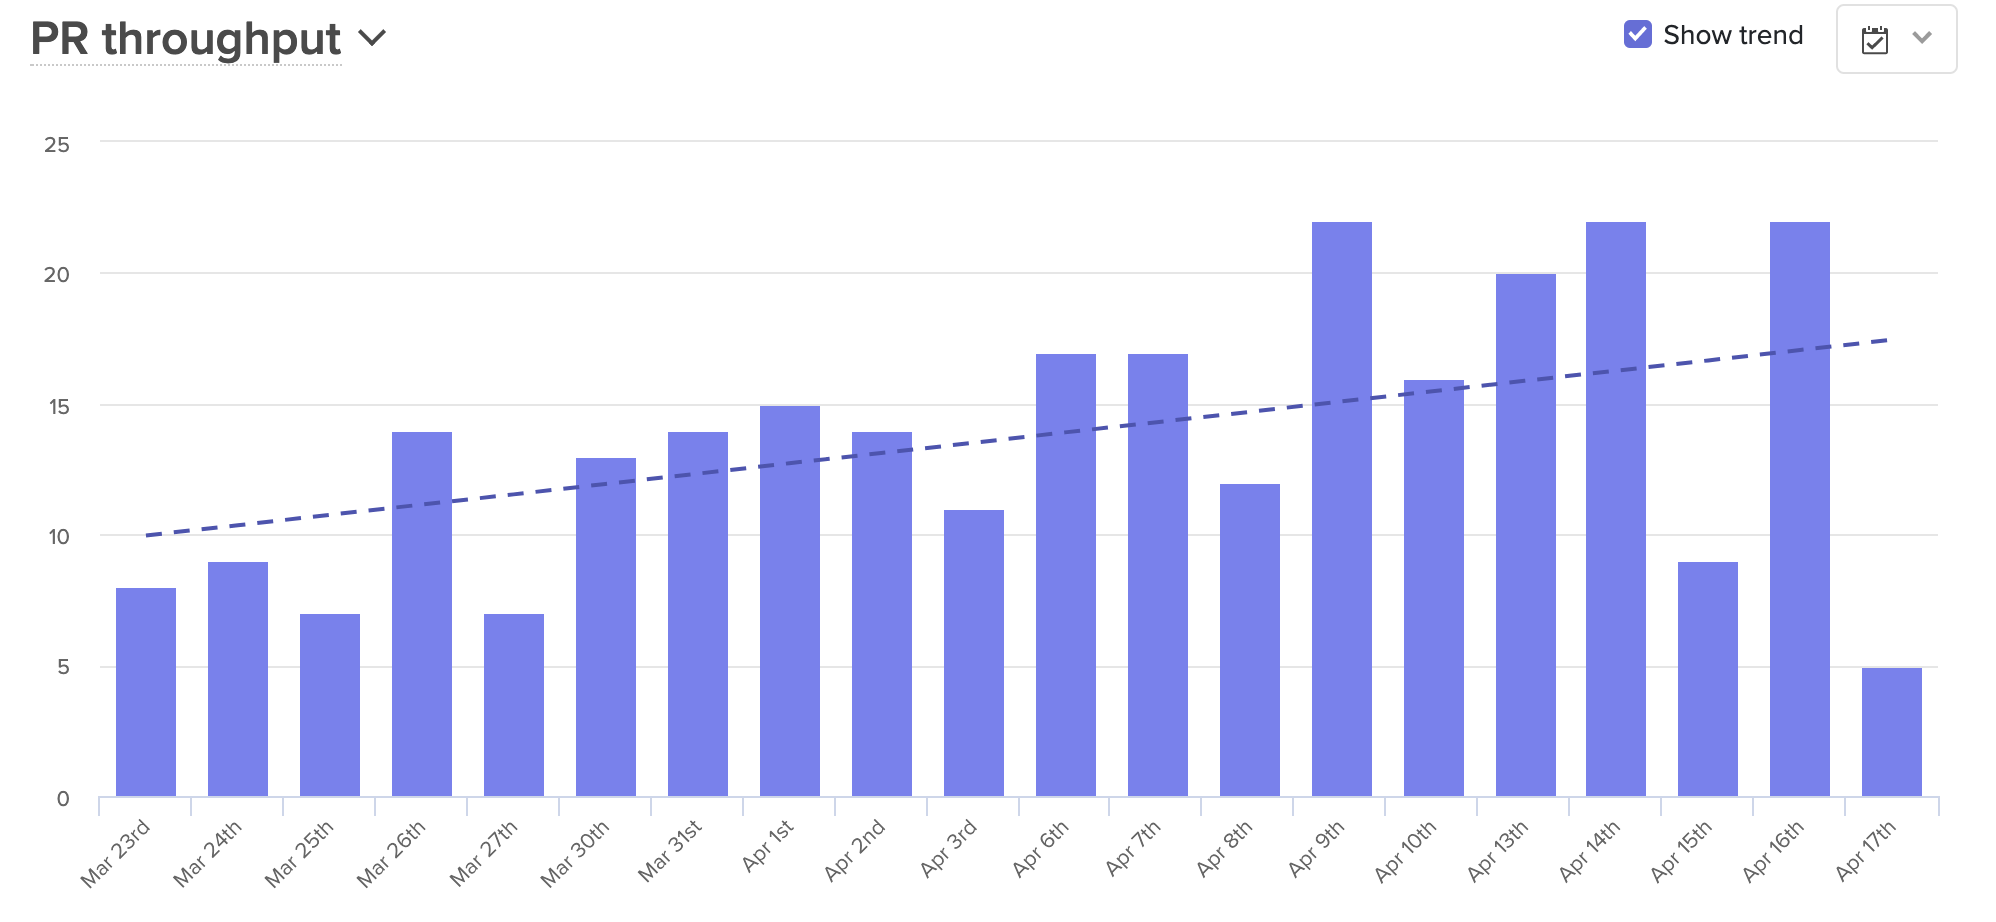
Over that same period, average PR Throughput went up almost 70%.
But most importantly, engineers are now less confused and are finding more opportunities to collaborate. The emphasis on documentation and written plans offer the opportunity to ask questions at every stage of the process. And with everyone looped in, developers can lend a hand to people on other teams, something that frequently occurred when everyone was together in the office.
Writing things down also has an unforeseen benefit — it’s helping the team avoid unnecessary meetings. While the team is remote, they’re using that extra time to connect on a more human level, building time into each standup to check in with each other, and carving time out of retros to talk about how they’re coping with the current situation. As Ale explained, “We were able to adapt our last retro to how we were feeling, instead of just focusing on the product process. We understood that was not what we needed to be talking about right now, that we need to talk about how we’re feeling and how we’re coping.”
Ale expects the team will continue to see benefits from these new processes, even once they return to the office. Alignment has increased, communication has improved, and enhanced documentation will make it easier to onboard new team members. Plus, when the team reverts to their partially-distributed structure, they’ll do so with a greater sense of unity. As Ale explained, “We now have a lot more empathy for our remote team members.”

When your team is building a software product, the majority of the work that they do is invisible. As a manager, you have to rely on in-person cues for blocked work or frustrated engineers. When they move to a remote workflow—your team also becomes invisible, and all those critical signals are dropped.
In-person, you might notice:
- Nonverbal clues during stand-ups or retros
- Frequent interruptions as developers are pulled into meeting after meeting
- Tension between team members as they work through problems
Acting on these signals is one of the most important ways you can help your team. You might say: “I noticed you seem frustrated each time you worked with Jack—is everything okay?” Or “I noticed that you’ve been helping the marketing team a lot, do you have too much on your plate right now?”
When you transition to a remote workflow, you lose indicators that anyone is stuck, demotivated, or overworked. To adjust, you have to find new ways to broaden the now-limited purview that remote work allows.
Signals to Remain Context-Aware From Afar
When thinking about productivity or output, many software leaders think in terms of features or story points. They get a general sense of how things are moving (or not moving) based on whether these features are getting completed. But these metrics are lagging indicators, and they’re not diagnostic. If you know that you’ve shipped fewer features one sprint than you did in the previous, you have no insight into what you can do to improve things.
Fortunately, we can derive much more granular signals for the speed and effectiveness of software development from the systems in which engineers already work. Data from how a developer works in their version control system, such as Commit Volume, Code Churn, or Pull Request Cycle Time, better clues you into how your team is working in real-time.
These metrics are imperfect (as all metrics are), but they give you much more to work with in terms of diagnosing process problems within your newly-distributed workflow. Below, we’ve recommended a set of metrics that you can look at on a daily, weekly, and monthly basis to stay connected with how your team is working.
Daily Signals for Stuck Work
The most imminent threat to an efficient and happy remote team is stuck work.
An engineer might be stuck because they are unsure of how to implement a change, because they’re unfamiliar with a portion of the codebase or for a number of other reasons. Any unit of work that isn’t moving through the Software Delivery Process quickly enough is a signal for you to check in. Look out for:
- Infrequent pushes: Are team members working incrementally? Are they working on a particularly tough portion of the codebase?
- Rework: Are team members reworking the same lines of code over and over again? Is there clear communication surrounding feature implementation?
- Long-running Pull Requests: Are there Pull Requests that have been open for more than three business days? Is this causing multi-tasking?
- Pull Requests with 3+ participants: Is a single Pull Request taking up the attention of several engineers who may be in disagreement?
- Pull Requests stuck in code review: Are there Pull Requests that have been passed back and forth between the reviewer and the author several times?
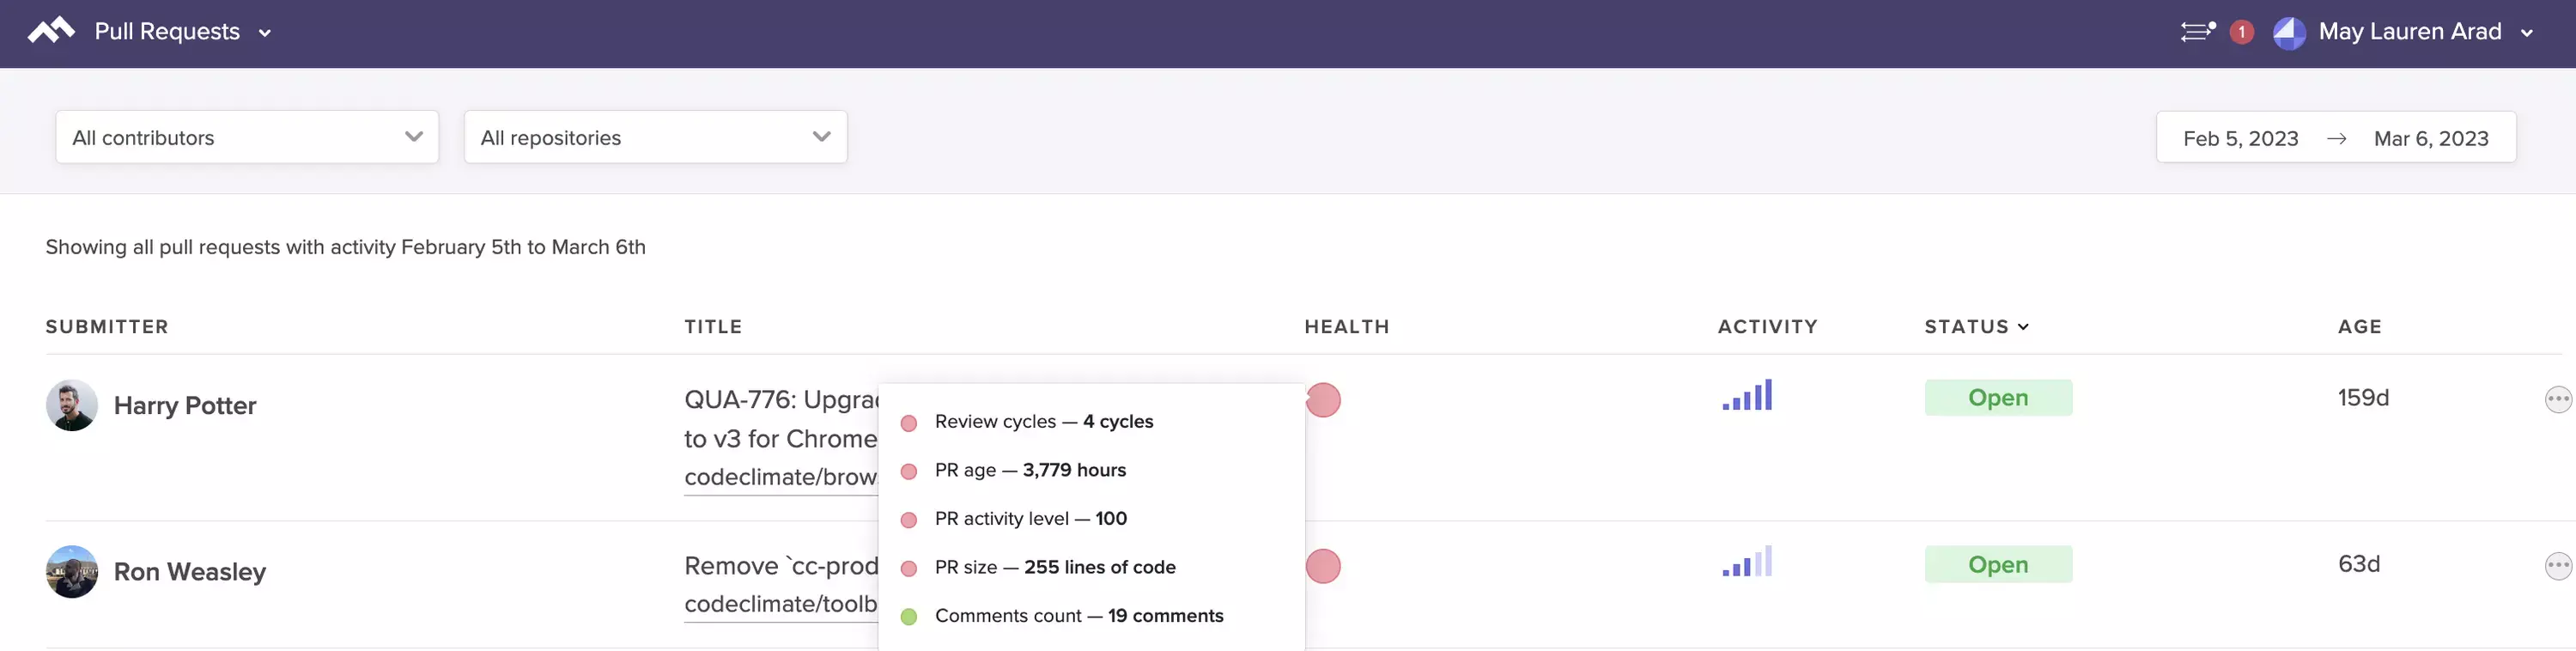
See at-a-glance the Pull Requests that are most likely to impede your team.
If you look at these signals with your team, you’ll have a shared understanding of how things are moving and where someone might be stuck. This data will take the pressure off developers to raise their hand during daily stand-ups when something’s off track, and enable you, as a manager, to know when you can step in and help.
Weekly Signals for Goal Setting
Once you’ve started tracking daily signals to keep your team on track, you can take a step back and start looking at how your engineers are working. If individual engineers are spending days working through a problem on their individual device, then opening huge Pull Requests that are perpetually getting stuck in the review process, your team will constantly feel stuck and frustrated.
Agile and Continuous Delivery workflows demand that team members commit frequently, work in small batches, and limit work in progress. These habits set in motion what we call the Virtuous Circle of Software Delivery:
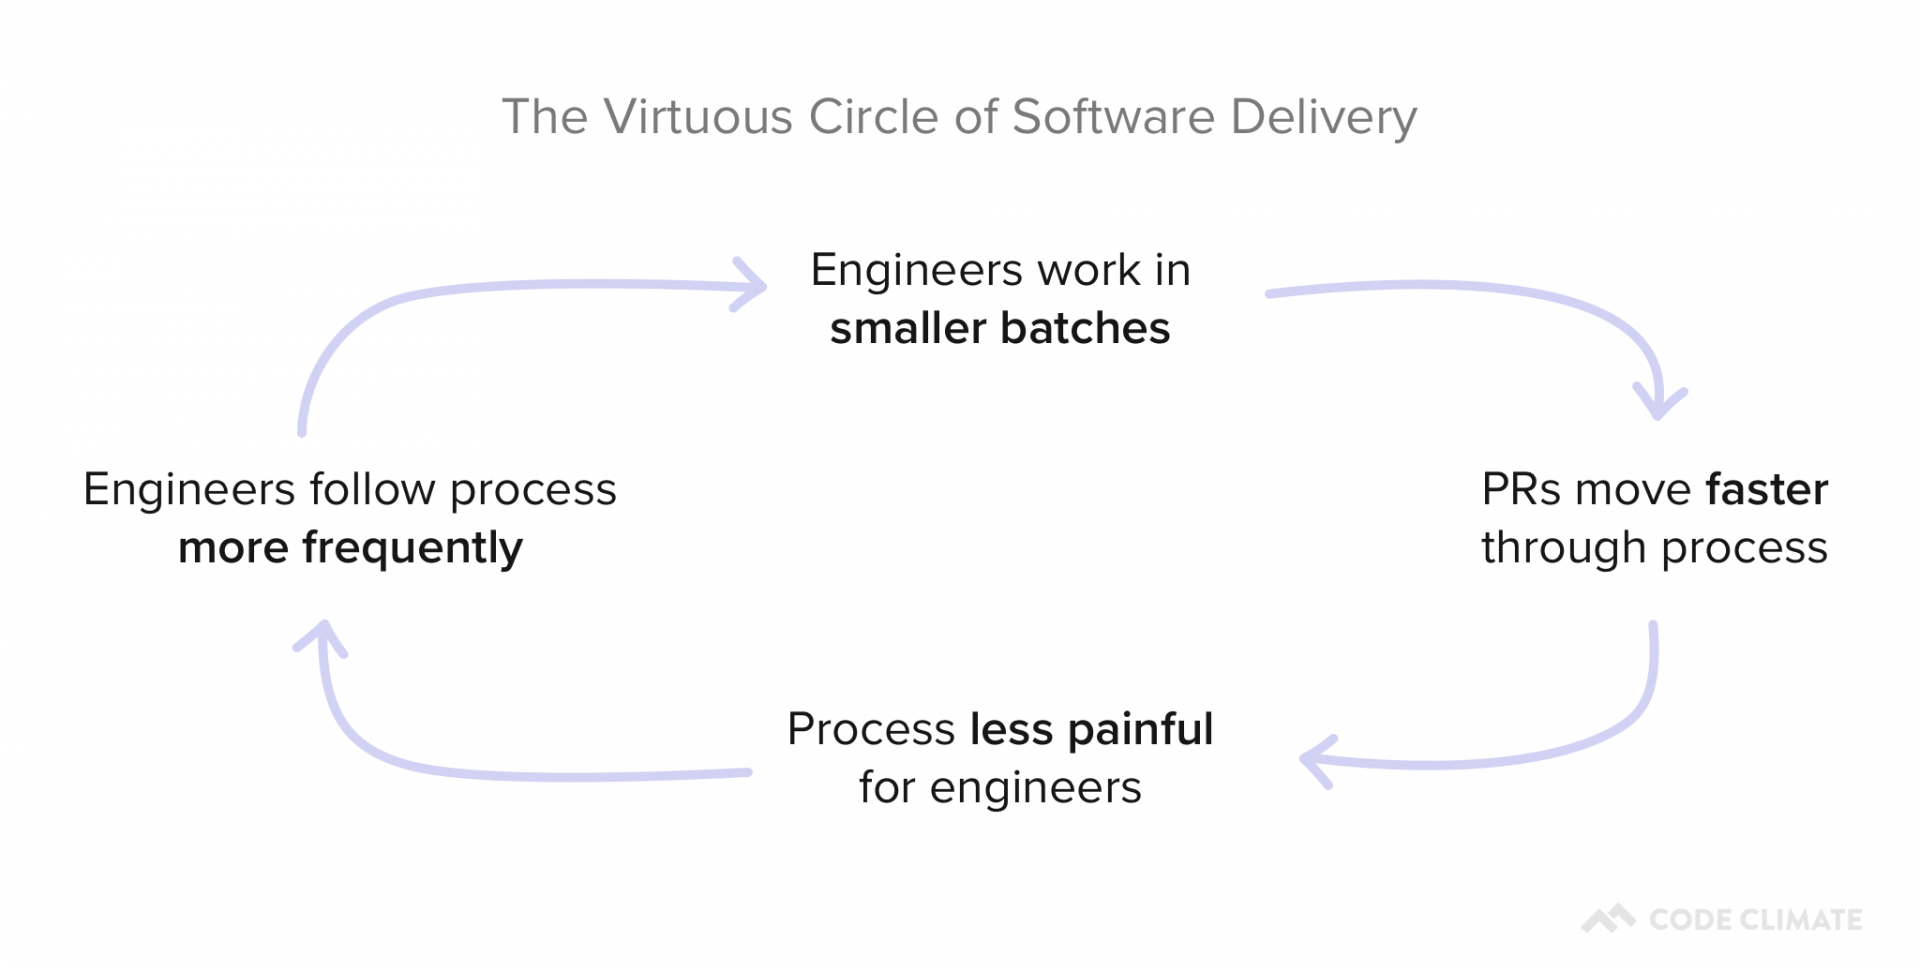
Building these habits is crucial to minimize the risk associated with merging a PR and decrease the chances that an individual unit of work will get stuck in the process.
For this, we recommend working with team members to set up process SLAs for good collaborative practices every week. Then, during retros and 1:1s, developers can work through concrete examples of when something went off track.
You can set targets for things like:
- Pull Request Success Rate: Can we agree that 95% of PRs should be successfully merged? We’ll investigate PRs that were closed or abandoned.
- Pull Request Time to Review: Can we agree to get to code reviews within 8 hours for 80% of Pull Requests? We’ll look deeper into PRs that couldn’t be reviewed quickly.
- Pull Requests Review Cycles: Can we agree to keep Review Cycles under 2 for 95% of Pull Requests? We’ll look into any PRs that get passed back and forth between author and reviewer multiple times.
- Workload Balance: Can we agree that 70% of the work should be done by at least 50% of the team? We’ll investigate deeper if just a few individuals seem to be doing most of the work.
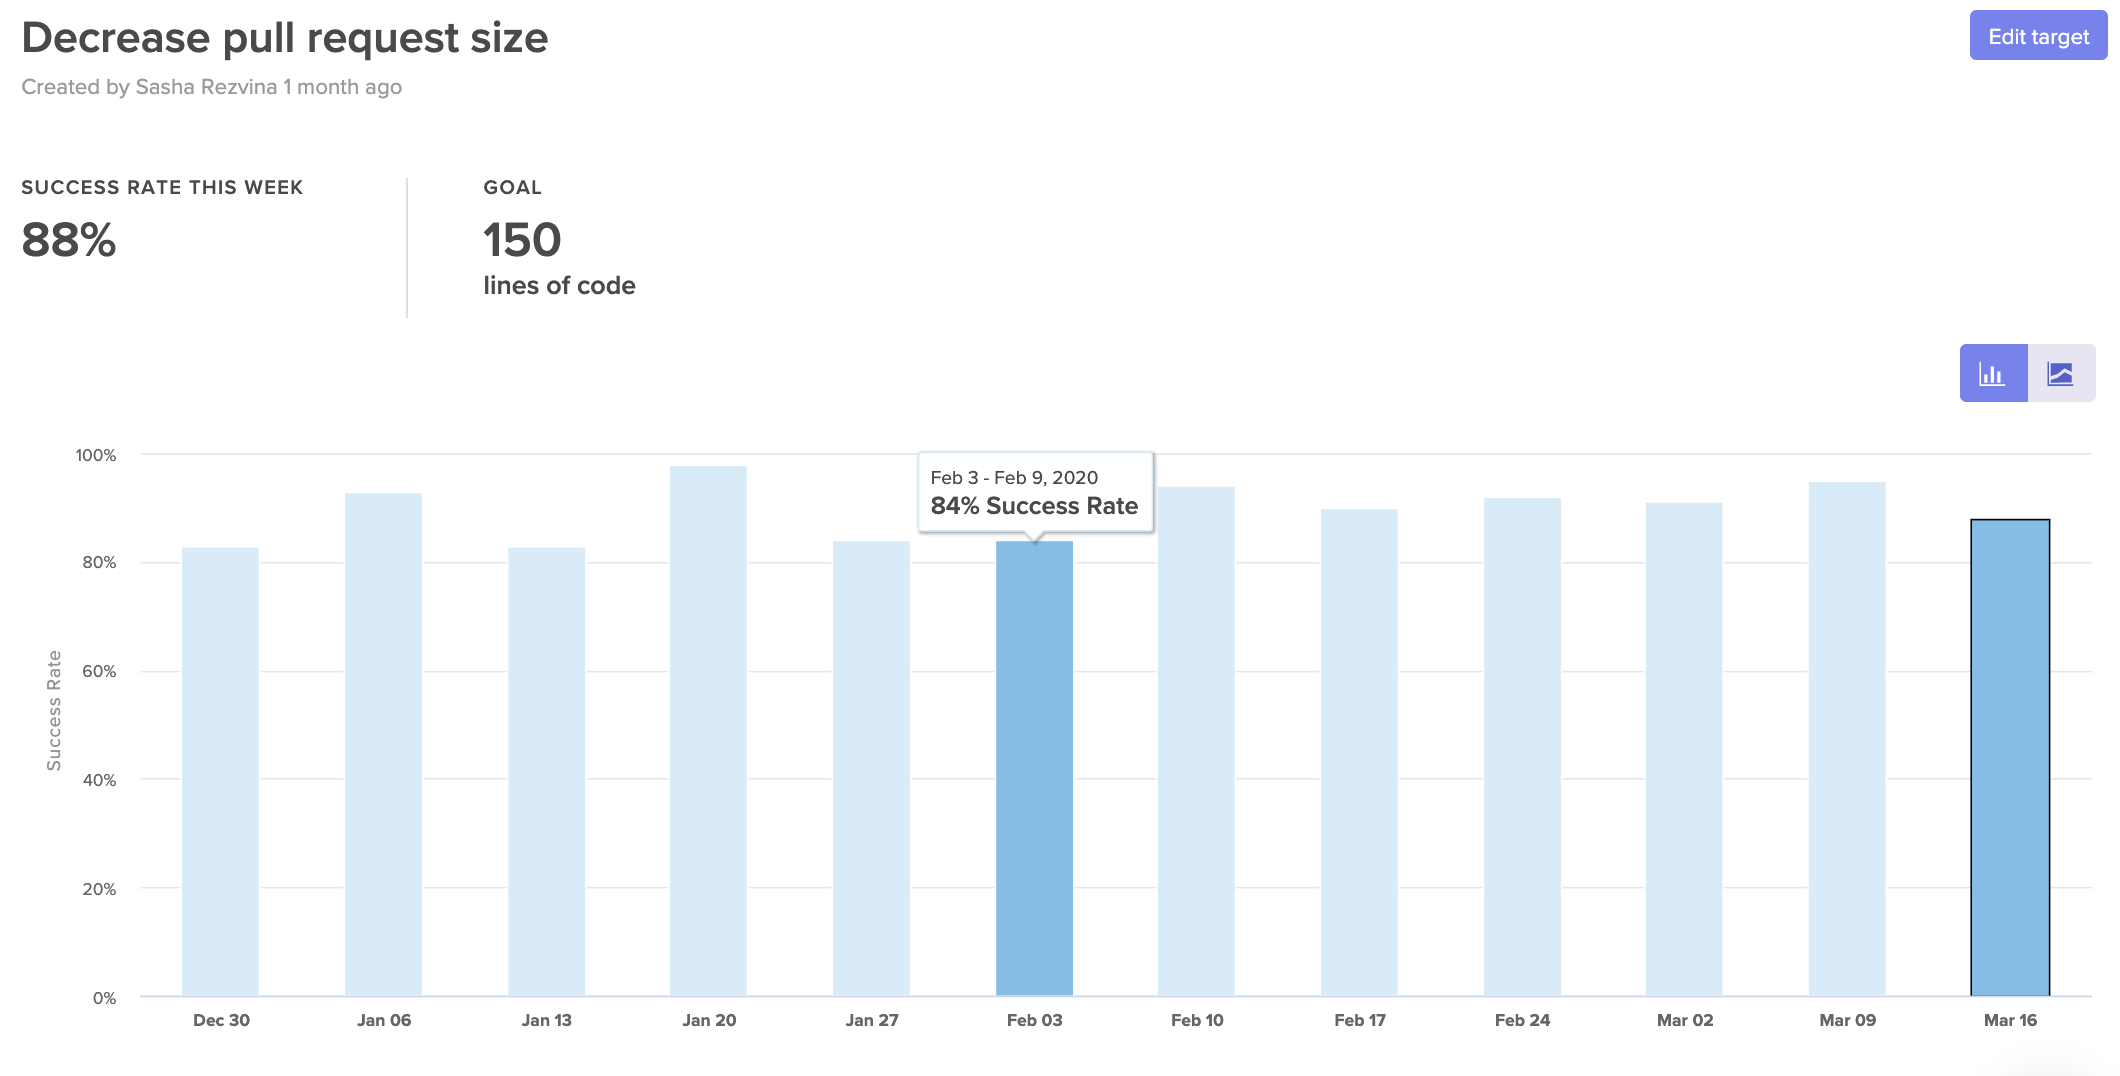
Set SLAs to help hold your team accountable to their goals.
Naturally, you don’t need to look at all of these metrics right away—just pick one or two that represent commonly reported issues. Selecting a granular metric, like Workload Balance, will be a much more effective indicator of what’s going amiss than a metric like Features Completed.
Over time, your team can build habits that minimize the opportunity for work to get stuck and slow down the team.
Monthly Signals for Continuous Improvement
Once you’ve identified signals that can point you towards daily and weekly improvement opportunities, you’ll want to start looking at your processes end-to-end to ensure that they’re working for, not against, your team members.
First, you’ll want to make sure your processes work. If you’re working in a traditional Git workflow, you’ll want to make sure that PRs are moving along the “happy path” from Open to Reviewed to Approved to Merged. Any PRs that skip steps are working outside your process and represent opportunities for deeper investigation.
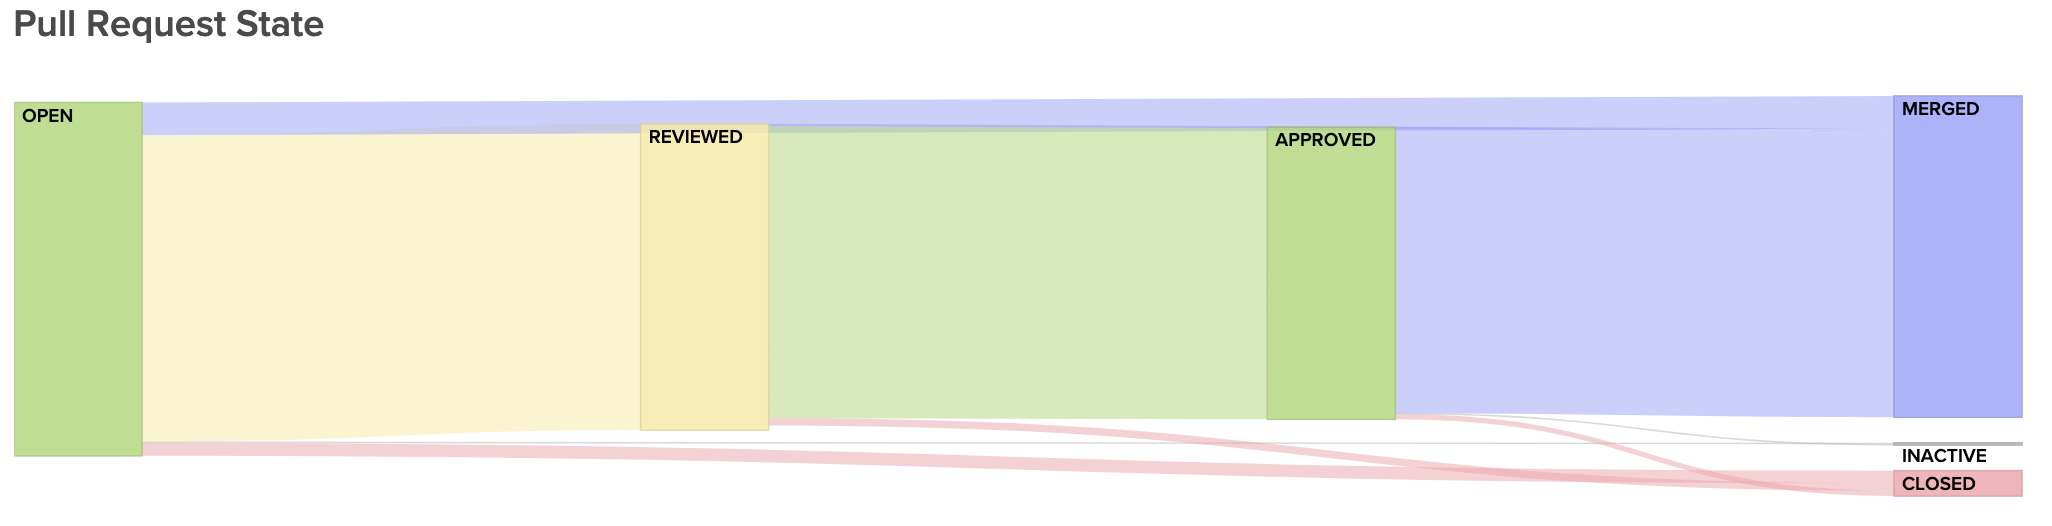
Visualize the journey of your Pull Requests from open to merged. Below, you can see metrics that represent constituents of this journey to better diagnose slowdowns.
Next, you’ll want to see how well this process is enabling a low time-to-market. If it takes days or weeks for changes to get into the hands of customers, your team will have a hard time quickly mitigating issues in production, and, ultimately, keeping up innovation.
For this, you’ll want to keep an eye on your team’s delivery Cycle Time, or how long, on average, it takes PRs to go from a developer’s laptop to being merged to production.
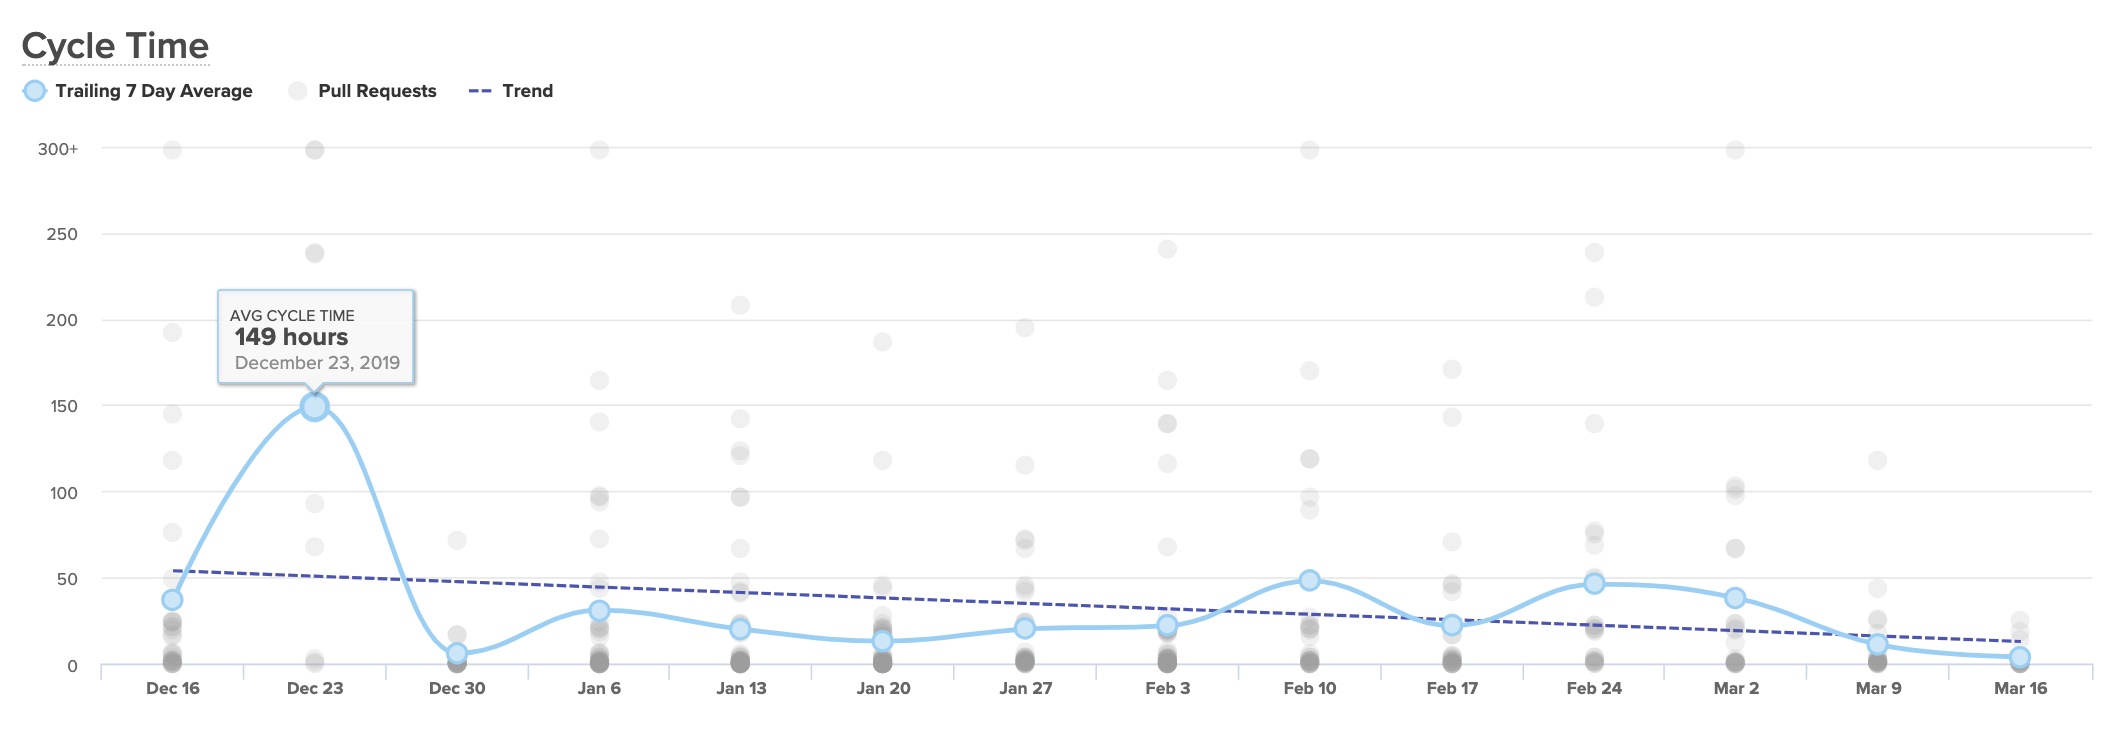
A Cycle Time that’s short and consistent is an indicator that your team is working with little friction, and your processes are enabling rapid innovation. If your Cycle Time is spikey, you’ll know to look into the units of work that make up a particularly high week.
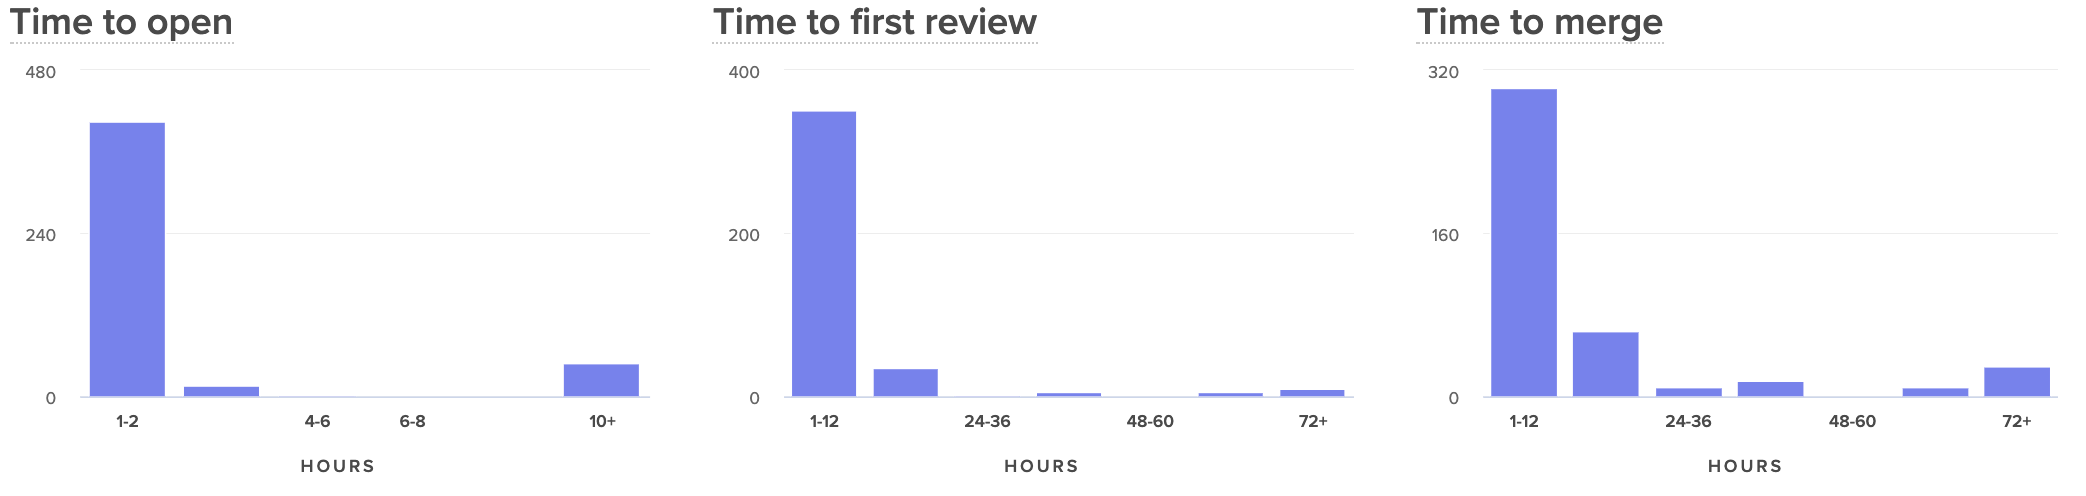
If your Cycle Time seems consistently high, you’ll want to break it up into components to see, specifically, which processes or practices are dragging down your speed. We recommend looking at:
- Time to Open: How much time passes between the earliest commit and the opening of a Pull Request?
- Time to First Review: How much time passes between when a PR is opened and when it is first reviewed?
- Time to Merge: How much time passes between when a PR is opened and when it is merged to production?
Comparing these side by side will help you see where in your process your developers are being slowed down.
When your team moves the needle and improves Cycle Time, it means you’re working together to boost the efficiency of the development process and to accelerate innovation. It’s important to communicate and celebrate success surrounding this metric to encourage continuous improvement on your team.
Remote Engineers Deserve Great Leaders
An unexpected transition to remote work is one of the most trying experiences for many software engineers. The already-isolating job of writing code becomes even harder when team members can’t chat or take breaks together. Leadership that is disconnected or not aware of all the challenges that they’re facing can be the final nudge that can disengage a team member.
Fold in just a few extra signals to stay aligned with engineers and lend a hand when they need it most.
Request a consultation to learn more.Request a consultation to learn more.

As the COVID-19 (coronavirus) outbreak has evolved rapidly, we want to take a moment to share updates with our customers about the precautions we’re taking to keep our services up and running, while ensuring the safety of our team.
Our leadership team is carefully monitoring and assessing the situation and we do not foresee a major impact to the delivery of our services due to COVID-19. We’re following the advice of the World Health Organization, the Centers for Disease Control, and other local authorities to be prepared to mitigate any potential disruptions to our business if necessary.
Our team
First and foremost, the safety and health of all Code Climate employees and the broader community is something we take very seriously. To that end, we have been taking proactive measures to help reduce the spread of the virus by following the advice of medical experts and the authorities:
- Remote work – Our team has been telecommuting since March 10th and this policy will continue until at least April 20th. We’re ensuring that all employees have the tools and equipment to perform their responsibilities securely from home.
- Travel – We’ve restricted all domestic and international business travel except for trips that are strictly necessary.
Our customers
We have plans and processes in place to ensure we can maintain business functions and our services are available.
- Security and reliability – Our systems were designed and built with disaster recovery in mind. Our infrastructure and data are spread across three AWS availability zones. In addition to that, we have automated backup processes for all data stores that contain customer data. Read more about our approach in our Security page. A real-time view of our uptime and availability is tracked on status.codeclimate.com.
- Support – Our team continues to remain available to address all your commercial and support needs. If you have any questions, please feel free to contact info@codeclimate.com.
We will be providing additional updates as the situation evolves. If we can support you or your team in any way, please don’t hesitate to let us know.
Introducing the first open platform for software engineering data
The data necessary to understand the entire software delivery process is increasingly fragmented. To ship a single feature, a team may take advantage of 10+ tools, from project management, to version control, CI/CD, feature flags and more.
At Code Climate, we’ve learned that combining data from different sources enables higher-level insights. For example, PagerDuty can tell you how often your developers are getting woken up—but it can’t tell you the impact on innovation. Adding Jira data enables you to understand the delays those incidents have on feature initiatives.
To unlock the full value from these data sources, we need:
- A standard language for understanding DevOps concepts
- A simple way to connect to the wide array of engineering tools
And that’s exactly what we’re excited to be announcing today.
We’re launching the Code Climate Engineering Data Platform with:
- A standard Data Schema, representing 50+ common software development units, like epics, pull requests, builds, incidents and more
- An open Connector specification for integrating with DevOps tools
- A SDK (and scaffolding template) to enable anyone to rapidly build new Connectors
Each Connector requests data from a DevOps tool’s API and outputs a set of records conforming to the data schema. Here’s how it works:
To kick things off, we’re open sourcing Connector reference implementation for PagerDuty, CircleCI and Codecov, all written in Node.js.
We believe that the future of DevOps data is open, and today, we’re taking the first step towards making this vision a reality.
The Code Climate Community
We created the first extensible ecosystem for code quality four years ago. There are now 50+ static analysis and test coverage tools available, developed by thousands of community contributors, benefiting millions of engineers. Companies like GitLab have used it as the foundation for their code quality solutions.
With the new Engineering Data Platform, we’re helping the broader software development community build the first open standards for all engineering and DevOps data. We’d love your feedback or contributions on everything we are announcing today (it’s all in draft form!).
Here’s how you can get involved:
- Explore our Data Schema and Specification docs on GitHub
- Join the conversation on Slack with hundreds of community contributors
- Subscribe to our Developer Program mailing list to stay up-to-date
We look forward to building the next generation of Velocity and Quality features using this new, open standard. We’re also excited to see how others will take advantage of the Code Climate Engineering Data Platform to build products and tools we haven’t even thought of yet.

“Our analysis is clear: in today’s fast-moving and competitive world, the best thing you can do for your products, your company, and your people is institute a culture of experimentation and learning, and invest in the technical and management capabilities that enable it.” – Nicole Forsgren, Jez Humble, and Gene Kim, Accelerate.
After finishing the Accelerate book, many engineering leaders are determined to build a high-performance team. Readers go to the ends of the internet looking for the right tools and processes to facilitate speed and stability.
Lucky for us, to summarize every area that can be improved and move the needle, the authors put together this simple flowchart:
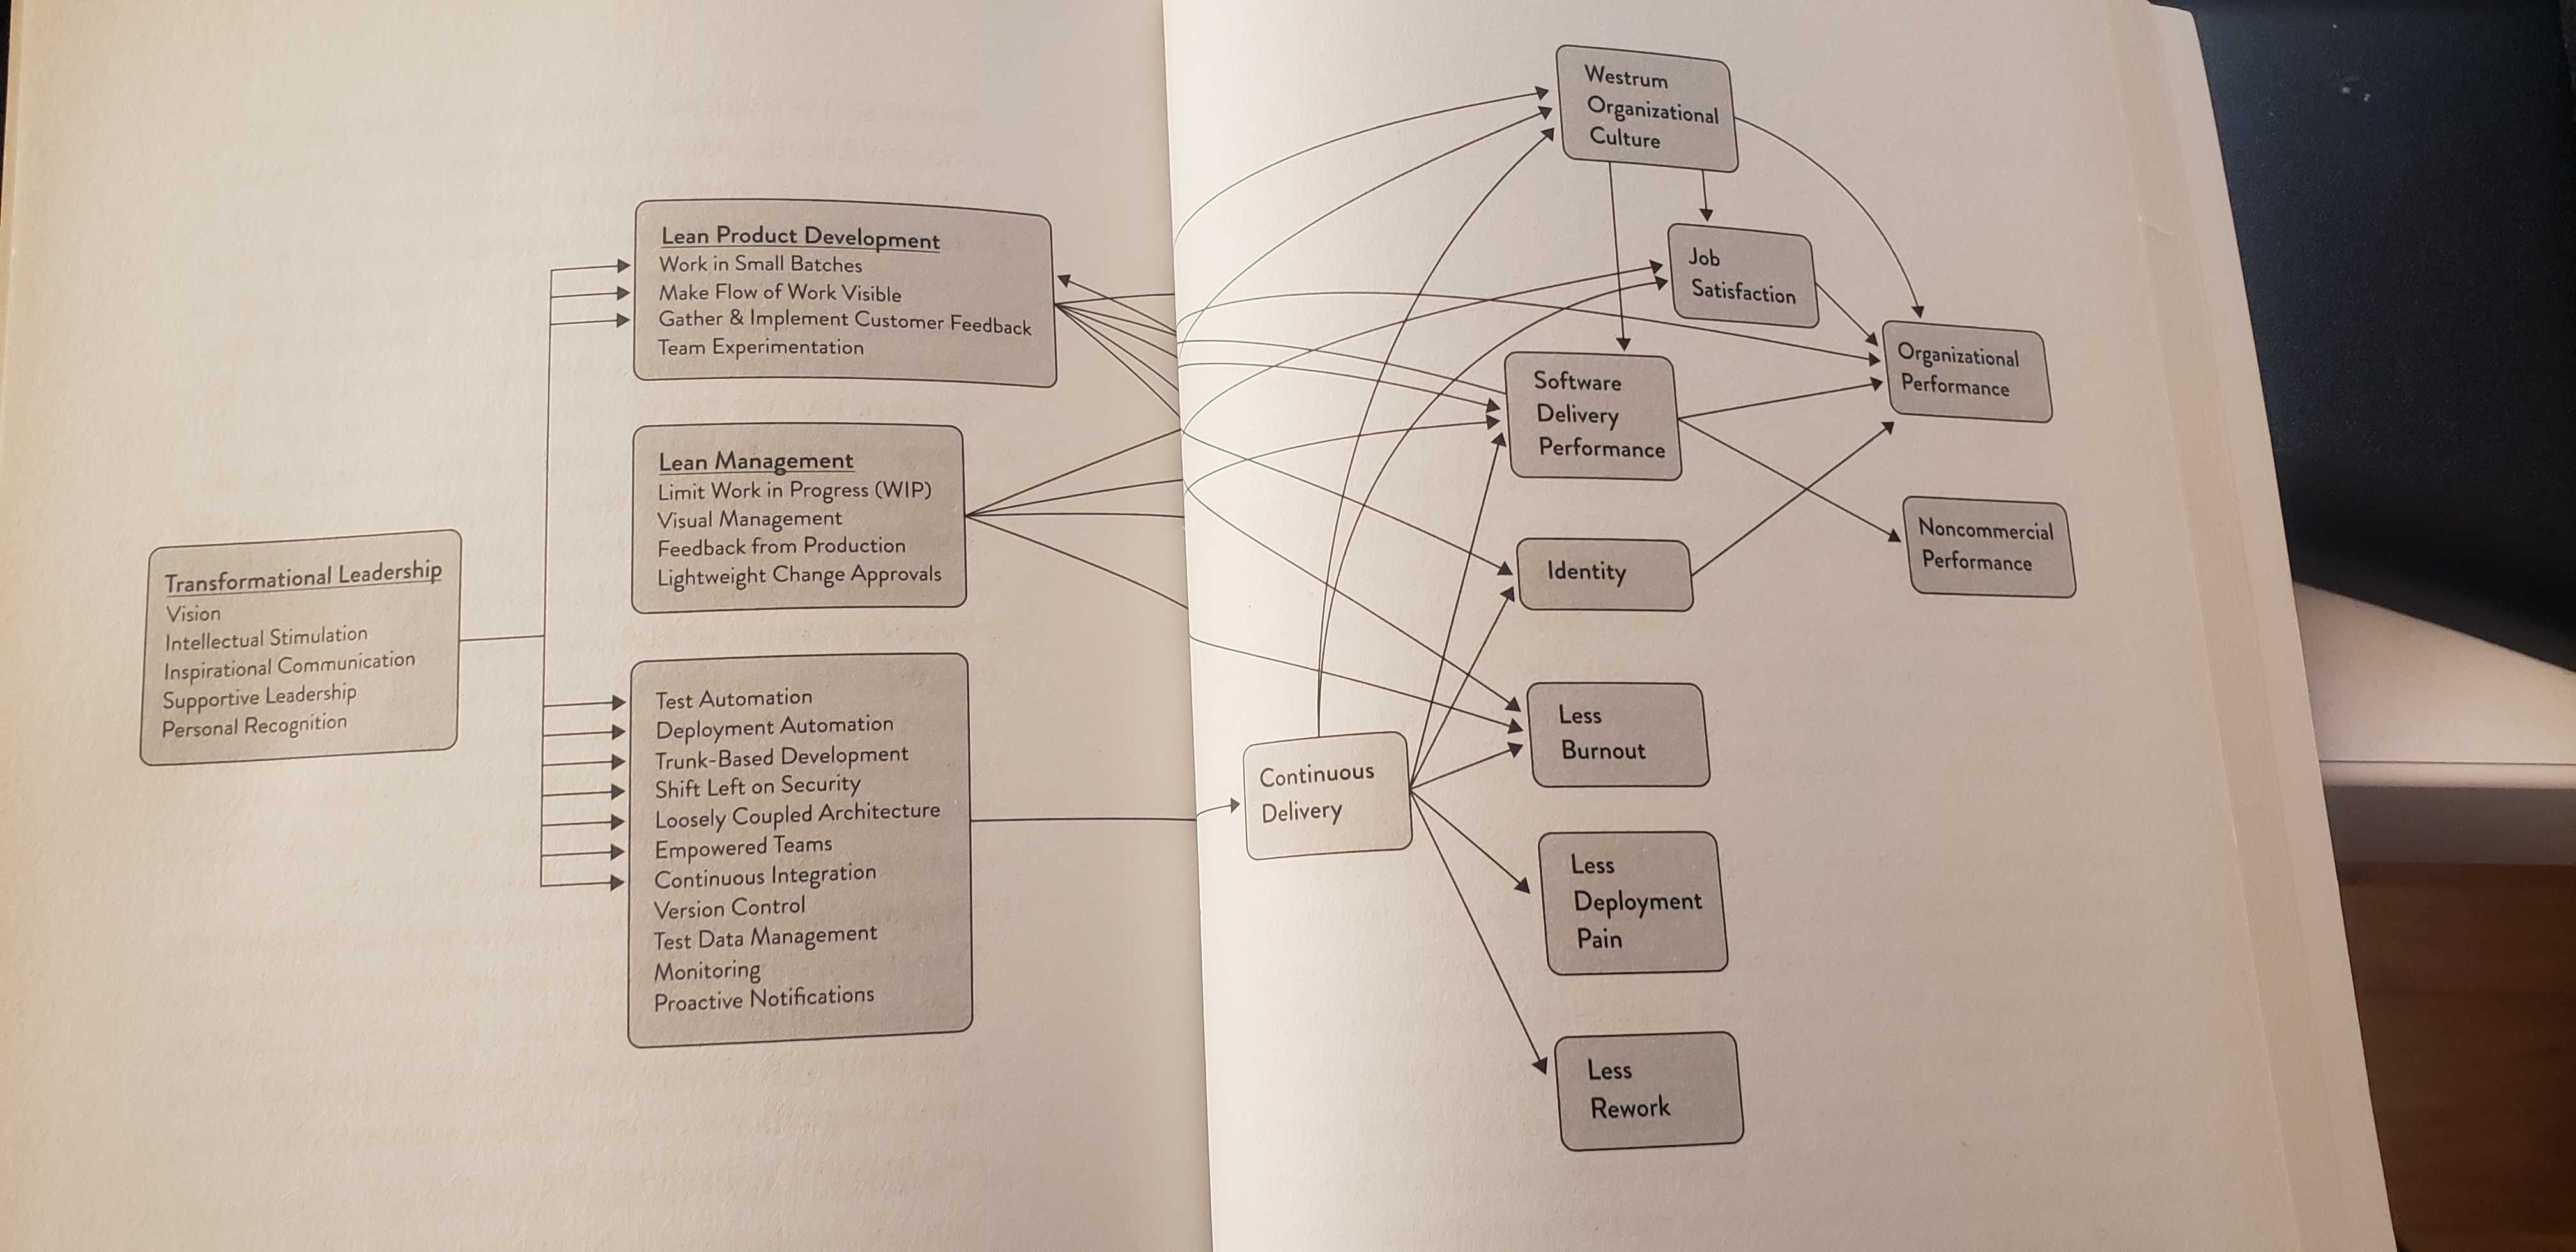
Just kidding. It’s not simple at all.
The tl;dr of the chart above is that changes to behaviors, processes, and culture influence several outcomes, such as burnout, deployment pain, or overall organizational performance. So while the book gives you a comprehensive explanation of everything that can be done, it doesn’t answer the most important question: if I want to improve how my team works, where do I start?
Metrics != Strategy
Ever since we built a Software Engineering Intelligence (SEI) platform, many engineering leaders have come to us and asked: “What metrics should I track?” And more recently: “How do I track Accelerate metrics within the platform?”
The Accelerate metrics, specifically, are valuable in giving engineering executives an understanding of where their organization stands, compared to the rest of the industry. They’re not:
- Specific to the problem you’re trying to solve.
- Diagnostic to indicate when you should take action.
While engineering teams can track Accelerate metrics in their custom-designed SEI platform, powered by Code Climate (along with 40+ other metrics), we always advise leaders to first take a step back and consider what they’re trying to improve. Quantitative measures are a powerful tool to measure progress toward objectives—but these objectives can vary drastically between organizations or even between teams. Measuring metrics with no end goal in mind can lead to poor decision-making and a focus on the wrong priorities.
Instead, we recommend starting by determining your team’s objectives and then pairing them with the appropriate metrics. Then you can use metrics as a means to an end: measuring progress toward a clear direction. This will ensure your metrics are more actionable in the short term and will be received more favorably by the team.
Specific: Start with the Pain
We always recommend that engineering leaders begin with qualitative research. Prioritize conversations before looking at quantitative measures to work through the most immediate and painful issues.
Through stand-ups, retrospectives, and 1:1s, work to understand what feels broken to the engineers. To avoid exposure or recency bias, collaborate with peers in management or lead engineers to gather this data to find repeat points of friction.
Based on your team’s observations, record your hypothesis:
Our code review process is often painful. I’ve heard that some reviewers “always approve PRs,” and often overlook defects. Other team members complain that specific individuals consistently ask for multiple rounds of changes, regardless of the magnitude of the change.
Try to include concrete details to make sure you’ve completely and accurately captured your team’s shared sentiment. Once you’ve worked to understand the day-to-day friction, only then should you begin to look at quantitative measures. The example above might call for the following metrics:
- Code Review Speed: How quickly do reviewers pick up PRs?
- Time to Merge: Once a PR is opened, how long does it take to merge?
- Review Cycles: How many times, on average, does a PR go back and forth between its author and reviewer?
- Code Review Involvement: How is Code Review distributed among Reviewers?
- Code Review Influence: How often do reviews lead to a change in the code or a response? (e.g., How valuable are these reviews?)
Look at these metrics historically to see whether they’ve been increasing or decreasing. You can also look at them in tandem with overall Cycle Time (time between the earliest commit and when a PR is merged to master) to see which have the biggest impact on the team’s speed.
Diagnostic: Distinguish Drivers from Outcomes
A common mistake leaders make when first implementing metrics is looking at outcome metrics and then making assumptions about their Drivers. Often, however, an output metric, such as Cycle Time, is spiking due to an upstream issue. Unclear technical direction, big batch sizes, or a single nit-picky reviewer can all contribute to a high Cycle Time.
Drivers are typically leading indicators. They’re the first quantitative sign that something is going the right direction, and they will, in turn, affect your outcome metrics, which are your lagging indicators. Your leading indicator is representative of an activity or behavior, whereas your lagging indicator is usually a count or a speed, which is the result of that behavior.
In the example we’re using for the piece, here’s how you would split up your metrics:
- Leading Indicator (Driver): Review Cycles, Code Review Involvement, Code Review Influence
- Lagging Indicator (Outcome): Time to Merge
While you diagnose your issue, you’ll want to look at both the Drivers and Outcomes.
Over time, you may discern certain patterns. You might notice that as Code Review Involvement goes up, Code Review Influence goes down. From those data points, you may want to investigate whether overburdening a reviewer leads to undesirable results. Alternatively, you might want to look into teams whose Review Cycles are much higher than others’ (with seemingly no difference in outcome).
Once your team has improved, you can step back from looking at Drivers. Outcomes for your team will serve as at-a-glance indicators for whenever a team or individual is stuck and may warrant your support as a manager.
The Path to High-Performance
The research found in Accelerate suggests that quantitative measures are important—but it also argues that the most successful leaders take a thoughtful and deliberate approach to improving how their organizations work:
“Remember: you can’t buy or copy high performance. You will need to develop your own capabilities as you pursue a path that fits your particular context and goals. Doing so will take sustained effort, investment, focus, time. However, our research is unequivocal. The results are worth it.” – Nicole Forsgren, Jez Humble, and Gene Kim, Accelerate.
The following article is based on a talk Juan Pablo Buriticá, VP of Engineering at Splice, gave at our annual Engineering Leadership Conference and a subsequent interview. Watch the full talk here, and see the slides here.
“The most shocking thing is that software engineering is one of the least rigorous practices that exists,” says Splice’s VP of Engineering, Juan Pablo Buriticá. After graduating with a degree in Pharmaceutical Chemistry, he eventually taught himself to code and transitioned to a career in software. Juan Pablo was astonished to find software engineering to be a much more fragmented discipline. Few standards exist around even the most common software production methods, like Agile and Continuous Delivery.
When managing a small team, the lack of industry standards was rarely an issue for Juan Pablo. Whenever something felt inefficient, he’d get the whole engineering team in a room, identify the source of friction, adjust, and move on. After Juan Pablo scaled his team from 15 to 80 distributed developers, however, all their processes broke. “I had to go back and fix the mess I created by growing the team so fast,” said Juan Pablo.
But fixing them wasn’t so easy anymore. So, Juan Pablo turned to engineering measuring tools and the Scientific Method.
Experiment 1: Applying Metrics to Engineering
Forming a Hypothesis
Before experimenting to determine which actions would yield improvement, Juan Pablo and the rest of the management team agreed that they needed to determine what specific outcome they were optimizing for. The team agreed that everything felt slow— but a gut feeling wasn’t enough to start making changes in the team.
They wanted to:
- First, decide what they were working towards. They weren’t willing to settle for a vague anti-goal of “slowness”— they wanted a clear vision of what the team should look like.
- Second, decide how they would measure progress. Within the newly agreed-upon context and direction of the team, they wanted a system to measure how far away they were from their goals.
Thus, their hypothesis was: A Defined Direction + A Focus on Success Metrics = Increased Tempo.
The product and engineering leadership spent an offsite deliberating on what was next for Splice. They came up with the following vision for the organization: Shipping working code is one of the fastest, safest, and most effective ways to learn and to test new ideas. This meant that engineers were confident enough in their processes and tooling to take risks. And they also felt able to mitigate issues when invariable something did break.
To test how they were doing and how far they had to go, they leveraged engineering measuring tools to investigate three metrics: Time to Merge, Deploy Frequency, and End to End Test Coverage. Combined, the team believed optimizing for these metrics would give their team confidence in the stability and speed of their processes.
Conducting the Experiment
Juan Pablo and the leadership team communicated this new vision and supporting metrics to the team. They were careful to note that this was an experiment designed to help improve collaborative processes— not a change in response to performance issues.
These are the goals they communicated:
- Time to Merge: 100% of pull requests should be merged within 36 hours (or 3 days)
- Deploy Frequency: All product teams had to deploy once a day
- End to End Test Coverage: 100% of engineers had to write an end-to-end test in an improved testing environment
The specific targets they chose for each metric were a guess. “I picked 36 hours, because why not?” says Juan Pablo. The team was experimenting with metrics for the first time, so they had to start with a number. He predicted that enabling his team to track and measure these metrics alone would be enough to create change.
Analyzing the Results
After one quarter, Juan Pablo didn’t observe the results he anticipated.
Although one engineer did put in work to make staging less of a blocker to production, there were few other changes to how the team worked. Pull Requests were not being merged within 3 days, and product teams were not deploying once a day.
These metrics revealed that they hadn’t moved the needle, but didn’t reveal what to do about it.
Experiment 2: Applying Actionable* Metrics to Engineering
Forming a Hypothesis
Juan Pablo had a conviction that their direction was right, but he realized the metrics that they had chosen weren’t actionable. It wasn’t clear what could be done by any individual engineer or manager to improve how the process works. “I knew I needed better metrics and measurements,” Juan Pablo told us.
So he scoured the internet for all the reading material he could find. Two sources moved him toward finding more better measurements:
- State of DevOps reports, which regularly surveys 1,000s of engineers to identify positive work patterns and the best indicators of improvement.
- Accelerate, in which the authors of the DevOps reports distilled their findings after four years and identified four crucial metrics to measure and improve engineering tempo.
These resources were based on research that had been conducted over several years with scientific rigor— exactly what Juan Pablo was looking for.
One major pattern that the researchers promoted was to distinguish product design from product delivery. Juan Pablo had been thinking of all of product and engineering as a single entity— but the process could be separated into predictable and unpredictable portions of the workflow.
Product design and planning are, by nature, unpredictable. They often involve scoping work that has never been done before, so it often results in imprecise estimation of scope and effort. Delivery, on the other hand, can be made predictable. Engineers can ship changes incrementally, irrespective of the scope of the feature they’re working on.
Thus Juan Pablo’s new hypothesis was: Decoupling Engineering from Product + Actionable Deliverability Metrics = Increased Engineering Tempo. The metrics they chose were Cycle Time, Mean Time to Restore and Deploy Frequency.
With a new hypothesis and a “plan for the plan,” as Juan Pablo calls it, the engineering team was ready to try again.
Conducting the Experiment
Decoupling engineering from product would take some heavy lifting, so Juan Pablo put together a Production Engineering team. “Their job was to build the tooling, services, and expertise that enables teams to deliver and operate high quality, production-level software and services,” says Juan Pablo.
This team was responsible for owning improvement on key metrics:
- Cycle Time (commit to production), targeting less than one hour.
- Mean Time to Restore (MTTR), targeting less than one hour.
- Deploy Frequency, targeting more than once a day.
To be able to track Cycle Time and Deploy Frequency, Juan Pablo found an engineering analytics tool, Velocity. Out-of-the-box, it shows three years of historical data, so Juan Pablo could measure how scale impacted the team, and whether they were trending in the right direction.
To start trending in the right direction, they had to work towards giving engineering more ownership over product delivery. Decoupling meant a few major transitions:
- Engineers were responsible for deploying code, while product would decide when to release features to customers.
- Testing is shifted left and becomes integrated into the developers’ responsibilities. Developers, therefore, don’t have to wait for a QA team to ship changes.
- The department invests in more testing and monitoring tooling, so the team can ship with more confidence.
Over the next quarter, the Production Engineering team worked with the organization to bring down Cycle Time.
Analyzing the Results
At the end of that quarter, the results spoke for themselves. On his Velocity dashboard, Juan Pablo saw Cycle Time had decreased by 25%. Even more importantly, however, it had become consistent:
The team’s throughput had increased 3x without a significant change in headcount:
“We saw results—and we also finally had the language to talk about performance,” said Juan Pablo.
The actionable metrics Juan Pablo had discovered monitored within Velocity gave the whole team a means to communicate how far away they were from their goals. When an engineer was blocked for any reason, they could point to the effect it had on Cycle Time. This focus helped them solve the immediate problem of increasing tempo, but also equipped the team with the visibility to solve upcoming problems.
Building Scientific Rigor into Continuous Improvement
While the metrics and practices in Accelerate aren’t quite industry standards yet, the researchers have applied a level of scientific rigor that has yielded predictable results for organizations of all sizes. The DevOps report has shown that over the past 4 years, an increasing number of organizations are practicing Continuous Delivery. More of the industry is using engineering measuring tools to look at metrics like Cycle Time and Deploy frequency, and seeing tangible improvements in engineering speed.
Through these recent studies and his own research, Juan Pablo had the unbiased data to finally approach software engineering like a scientist.
Thanks to the hard work of the Splice engineering team and their investment in engineering measuring tools like Velocity, Juan Pablo told us: “We have created a culture of continuous systems and process improvement. We also have a language and a framework to measure this change.” Sign up for Velocity demo to see how your team can benefit from similar visibility.