Productivity

This post is the first article in our Tactical Guide to a Shorter Cycle Time five-part series.
Low Cycle Time is a characteristic of high performing teams–and the authors of 9 years of DevOps Reports have the data to prove it. In their book, Accelerate, they’ve found a direct link between Cycle Time and innovation, efficiency, and positive engineering culture.
Our data analysis of over 500 engineering organizations corroborates their findings. It also reveals helpful benchmarks for teams to gauge how they compare to the rest of the industry. We’ve uncovered that:
- The top 25% achieve a Cycle Time of 1.8 days
- The industry-wide median is 3.4 days
- The bottom 25% have a Cycle Time of 6.2 days
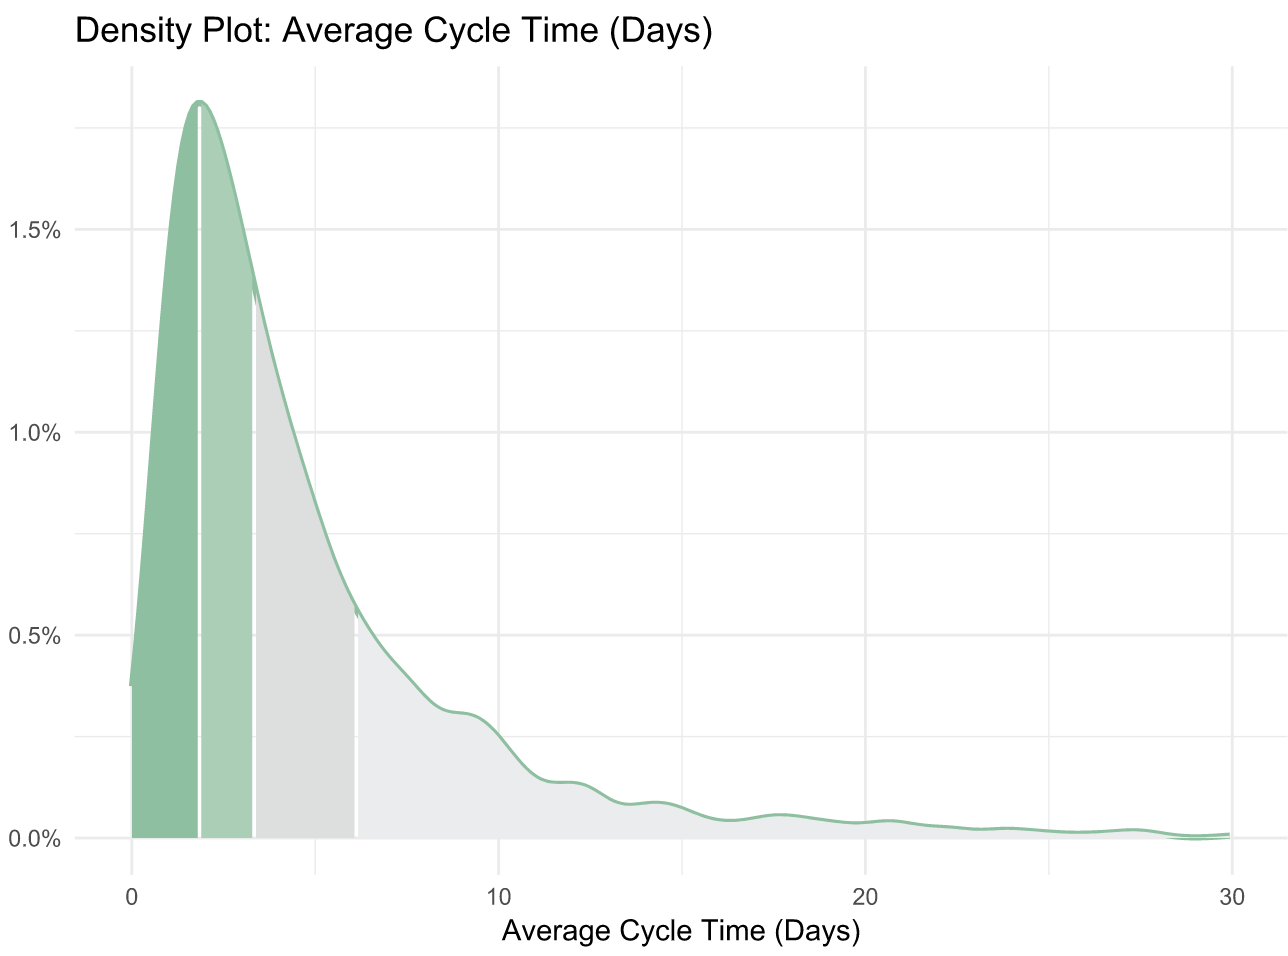
The Accelerate authors discovered the “elite” performers (making up just 7% of the industry) reach a Cycle Time of less than one hour. This means that the median Cycle Time is 80 times higher than that of the best performing organizations. This spread suggests that the majority of the industry either doesn’t measure Cycle Time, doesn’t know what a good Cycle Time is, or doesn’t know how to fix it.
This is why today, we’re kicking off our Tactical Guide to a Shorter Cycle Time, a 5-part series to help you accomplish all of the above.
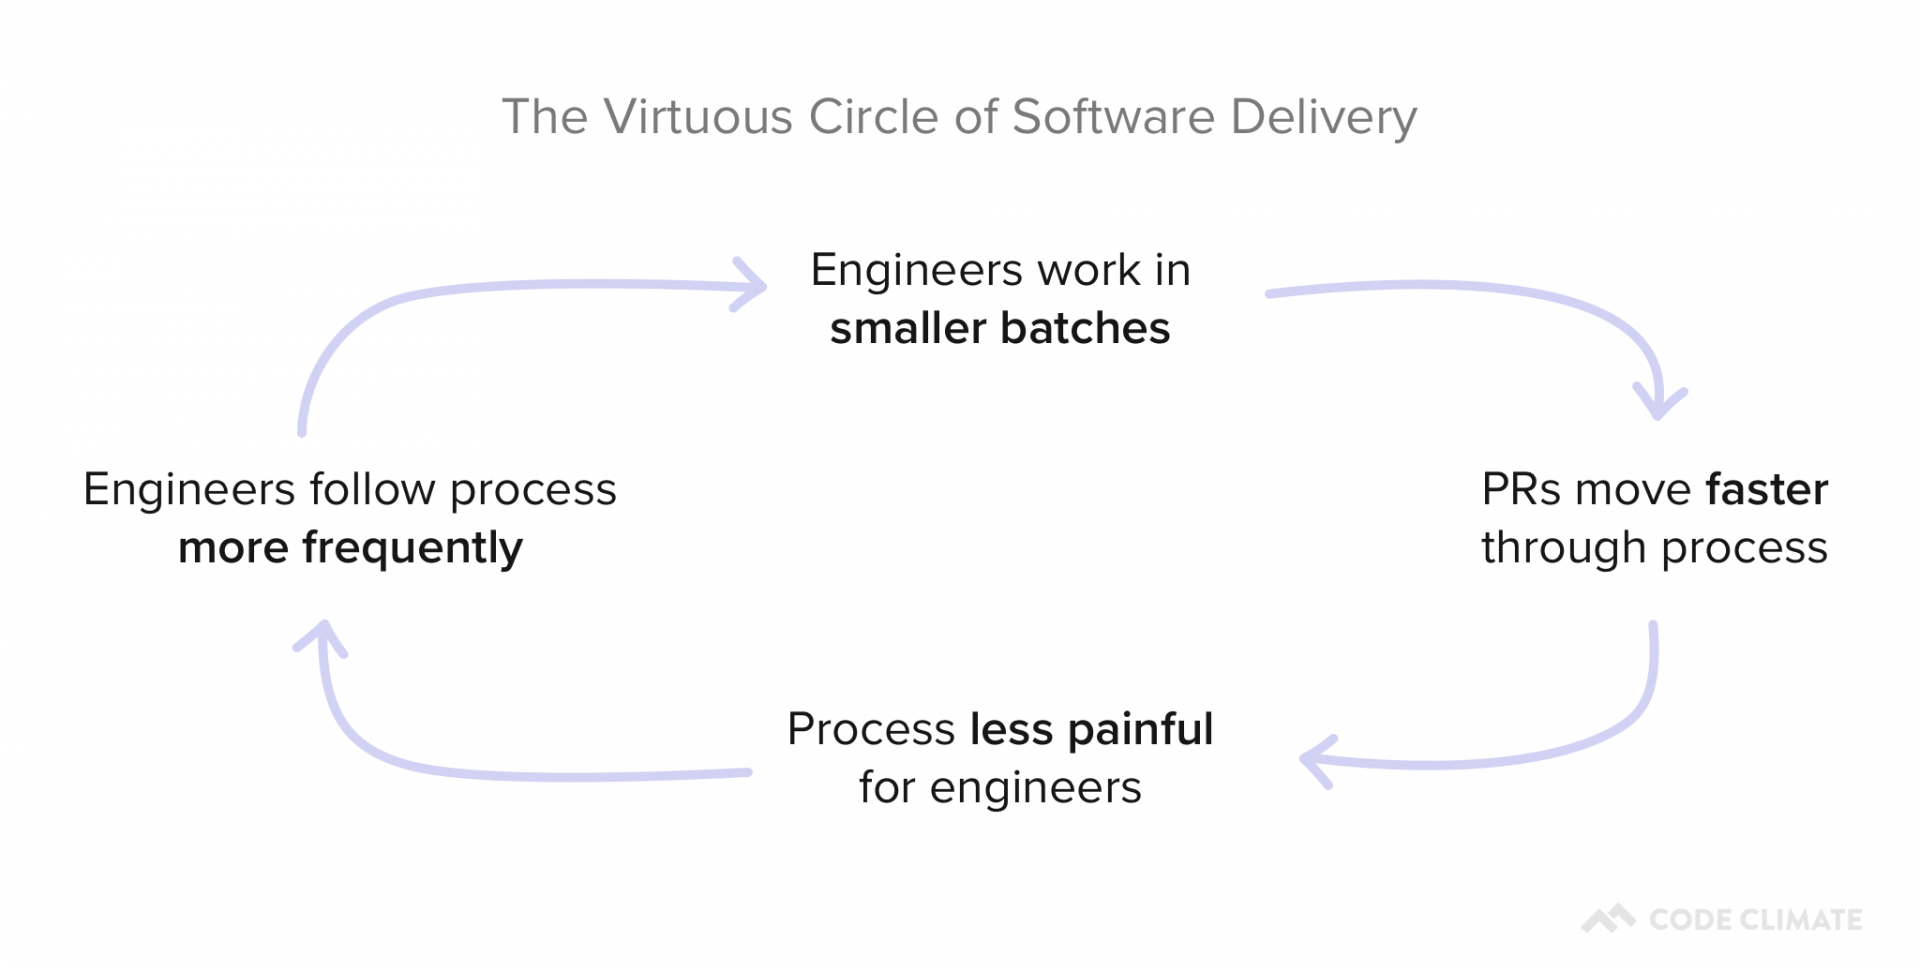
The Virtuous Circle that Spurs Continuous Improvement
We define Cycle Time as the time between first commit and deploy of a changeset. Whether or not your definition matches ours precisely, optimizing the amount of time between these two events will significantly improve your engineering team’s efficiency (we’ve observed increases of at least 20%).
Measuring and improving this metric has a long term effect that’s even more significant than the initial bump in productivity. It sets in motion a Virtuous Circle of Software Delivery, in which optimization that encourages better engineering practices, paired with the positive reinforcement that comes from unblocking, encourages more optimization that sparks better coding practices, and so on.
The process of improving each portion of your Cycle Time will create a culture of Continuous Improvement on your team.
Where to Start
First, you’ll want to know what your Cycle Time is and how it compares to the industry average.
Cycle Time with 3 years of historical data out of the box.
At face value, Cycle Time is a great metric to gauge success, but it isn’t diagnostic. To understand why your Cycle Time is high or low, you’ll want to look at its four constituents:
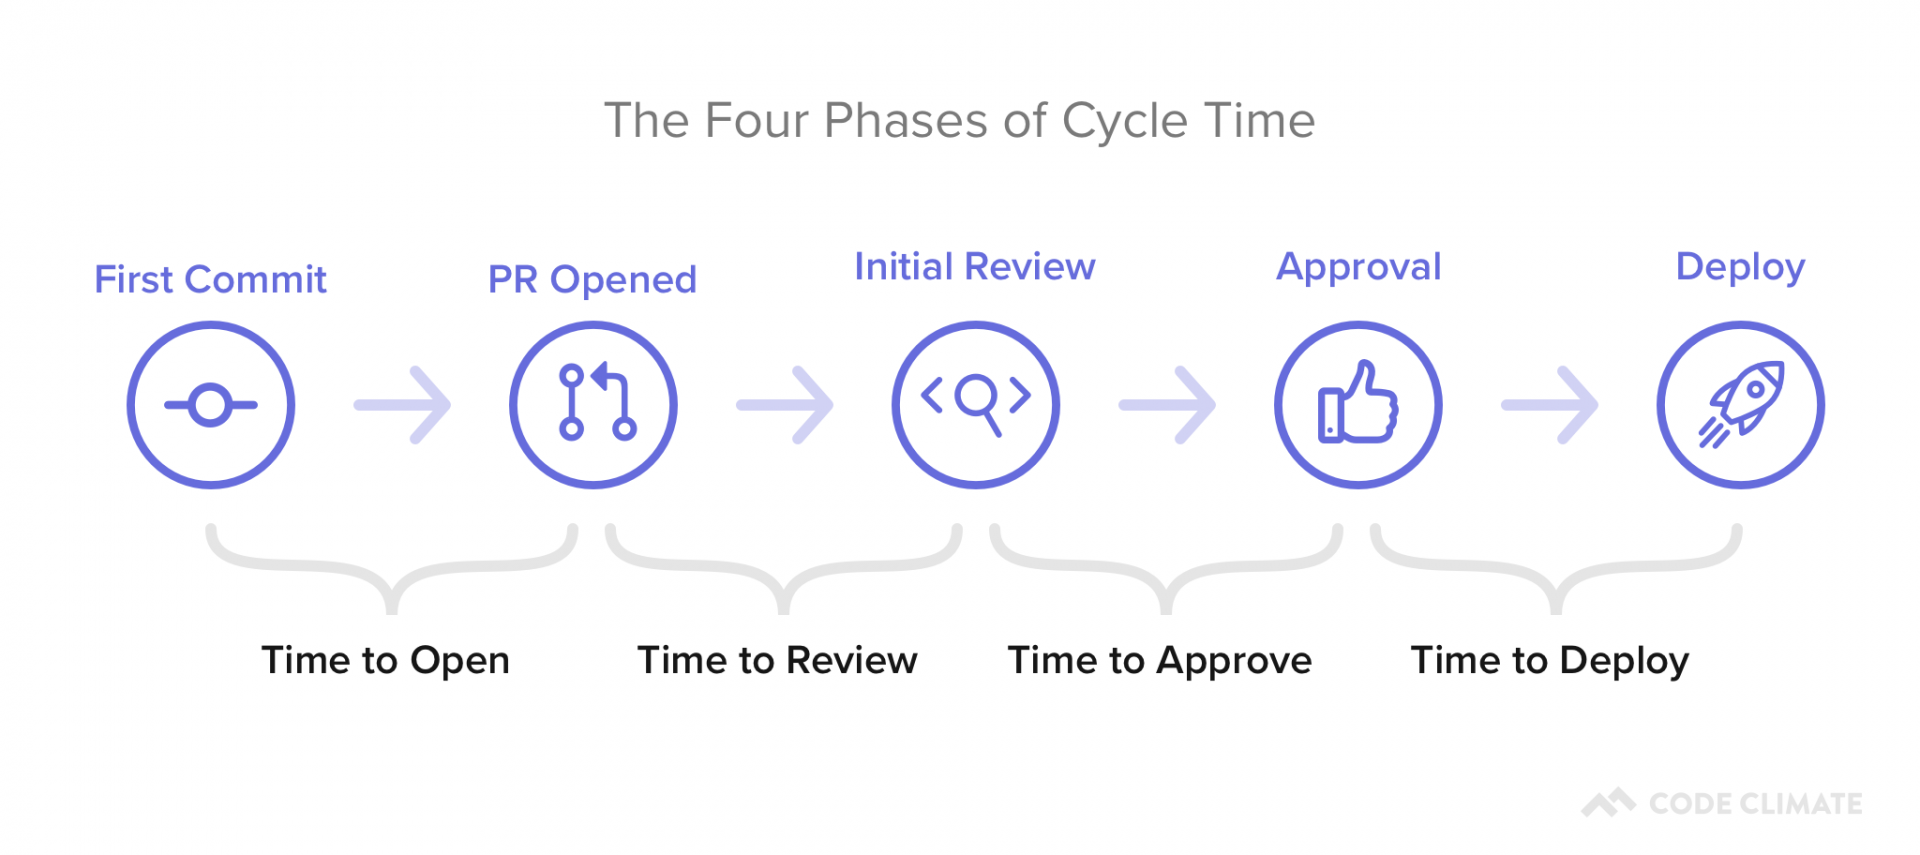
- Time to Open: The time between an engineer’s first commit and when they open a pull request in their version control system. Our data shows that this metric has the highest correlation with Cycle Time, so this is a great place to start optimizing.
- Time to Review: The time between when a pull request is opened and when it receives its first review. Delays at this stage incentivize multi-tasking, so you’ll want to minimize the time a PR is left waiting for review.
- Time to Approve: The time between when a pull request receives its first review and when it is approved, also known as the Code Review process. You don’t want to completely minimize the time spent in this phase, but you do want to make sure you reduce inefficiencies while still getting the value on Code Review you anticipate.
- Time to Deploy: Any additional time following the pull request approval, before the change reaches production.
You can plot these metrics side-by-side and look at them in terms of hours or percentage of time spent, so you know what your team’s starting point is before optimizing.
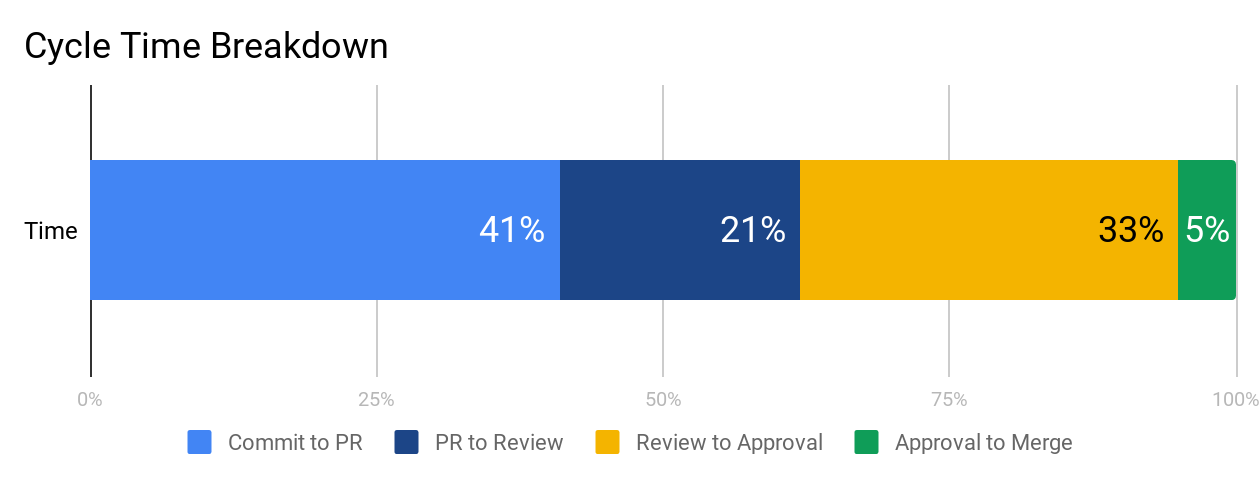
We recommend working on each phase from left to right because inefficiencies tend to compound from earlier stages. When a very large pull request is opened, it also affects how long it’ll wait for review and how likely it is to get stuck in the code review process. Start with Time to Open to ensure your team has streamlined individual practices before moving on to collaborative ones.
What’s Next
The next four parts of our series will dive deep into each component of Cycle Time:
- Part I: The Virtuous Circle of Software Delivery
- Part II: The Single Greatest Lever in Shortening Cycle Time
- Part III: How to Stop Code Review from Bottlenecking Shipping
- Part IV: Keep Code Review from Being a Waste of Everyone’s Time
- Part V: The Last Mile to True Continuous Delivery
We’ll include industry benchmarks, based off our analysis of 500+ engineering teams’ data, further data points to investigate, and tactical advice on how to improve each stage.

We last looked at Cycle Time for software engineering to understand what it is and why it matters. Most discussions about Cycle Time end there, leaving a lot of engineering managers frustrated and wanting more. Well-meaning and intelligent engineering managers have theories on which principles drive low cycle time, but very few actually have data to support their hypotheses.
So today we’re going to do just that – we’re going to reveal what we learned about cycle time after analyzing thousands of pull requests from hundreds of teams. In a field full of complexity and nuance, our analysis results were strikingly simple. The primary conclusion we came to was that there’s a single intuitive practice that is highly correlated with low cycle time. But it’s not the one we would have guessed.
The Data
Before we get into exactly our findings, let’s talk briefly about the dataset and definitions we used.
As a refresher, Code Cycle Time (a subset of Cycle Time) represents how long code remains “in flight” – written but not yet deployed.
Our data science team analyzed 180,000 anonymized pull requests from 500 teams, representing about 3,600 contributors. We asked the team to determine what correlation exists, if any, between the following software engineering delivery metrics (we called these “drivers”) and Code Cycle Time:
- Time to Open (Days) (from commit to open)
- Time to Review (Days) (from open to review)
- PR Open to Merge (Days)
- Number of Review Cycles
- % of Abandoned Pull Requests
- Pushes per Day
- Pull Request Throughput per Week
While beyond the scope of this post, they used Locally Weighted Generalized Linear Models (GLM) to determine correlations between drivers.
The Results
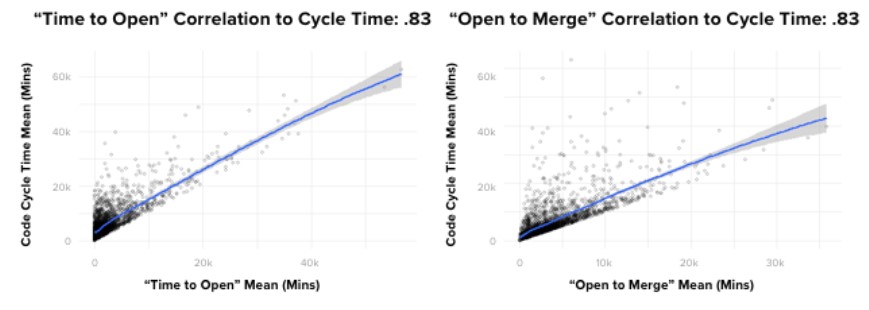
If I had been asked beforehand which of our set of metrics would prove most correlated with cycle time, I would have said, without hesitation, “PR Open to Merge”. Indeed, there is a powerful correlation between these two metrics. However, contrary to what you might think, the data showed that it’s not the most impactful one. Actually, of the drivers we looked at, the metric with the most predictive power on Code Cycle Time was, convincingly, Time to Open.
To give you a better sense of how strong the correlation is, in absolute terms, where a 0 coefficient means “no correlation” and 1 is perfectly correlated, Time to Open and Code Cycle Time had a 0.87 coefficient. This was, in fact, the strongest correlation we found between any two metrics we looked at in our analyses.
Even more striking, Time to Open is more predictive of Code Cycle Time than the length of time the pull request remains open, which means that pull requests that open faster, merge faster.
What can we do with this information?
First, as with most data-driven insights, it can be helpful to marry the results with our intuition.
Code that spends less time on someone’s laptop …
- Is likely small and therefore easier to get reviewed quickly by a single reviewer
- Gets reviewed sooner
- Gets closed sooner if it’s headed in the wrong direction (it happens)
- Signals to other team members the area of the codebase you are working, which can serve to head off painful merge conflicts before they happen
The good news is that Time to Open is a bit easier to influence and understand than the rest of Code Cycle Time, which can get mired in the complexity of collaboration.
Your team probably already hears from you about writing small pull requests, but reinforcing the message helps, and sharing data like the data presented here can help provide transparency and credibility to the recommendation.
One could also consider, carefully and judiciously, whether or not pair programming, in some cases, might improve time to open. This can be particularly helpful for engineers with a tendency (self aware or not) to overthink, overbuild and/or prematurely optimize code.
Closing
The influence of Time to Open on Code Cycle Time is striking. As software engineering professionals, we spend a lot of time discussing ways to optimize and understand the collaborative aspects of software development. This is completely understandable, and does in fact pay dividends. However, the data tells us that in some cases, for some teams, what you should be more likely looking at is your time to open.
Related Resources

Today, we’ll look at three terminal Pull Request outcomes and one way to improve abandoned Pull Requests and increase velocity in your engineering process.
Every Pull Request (PR) has one of three outcomes
Every PR has costs: engineering labor, product management, and opportunity cost, to name a few. Each also has an outcome: merged, closed without merging, or abandoned due to inactivity.
Here’s a look at how PRs fare across the industry:
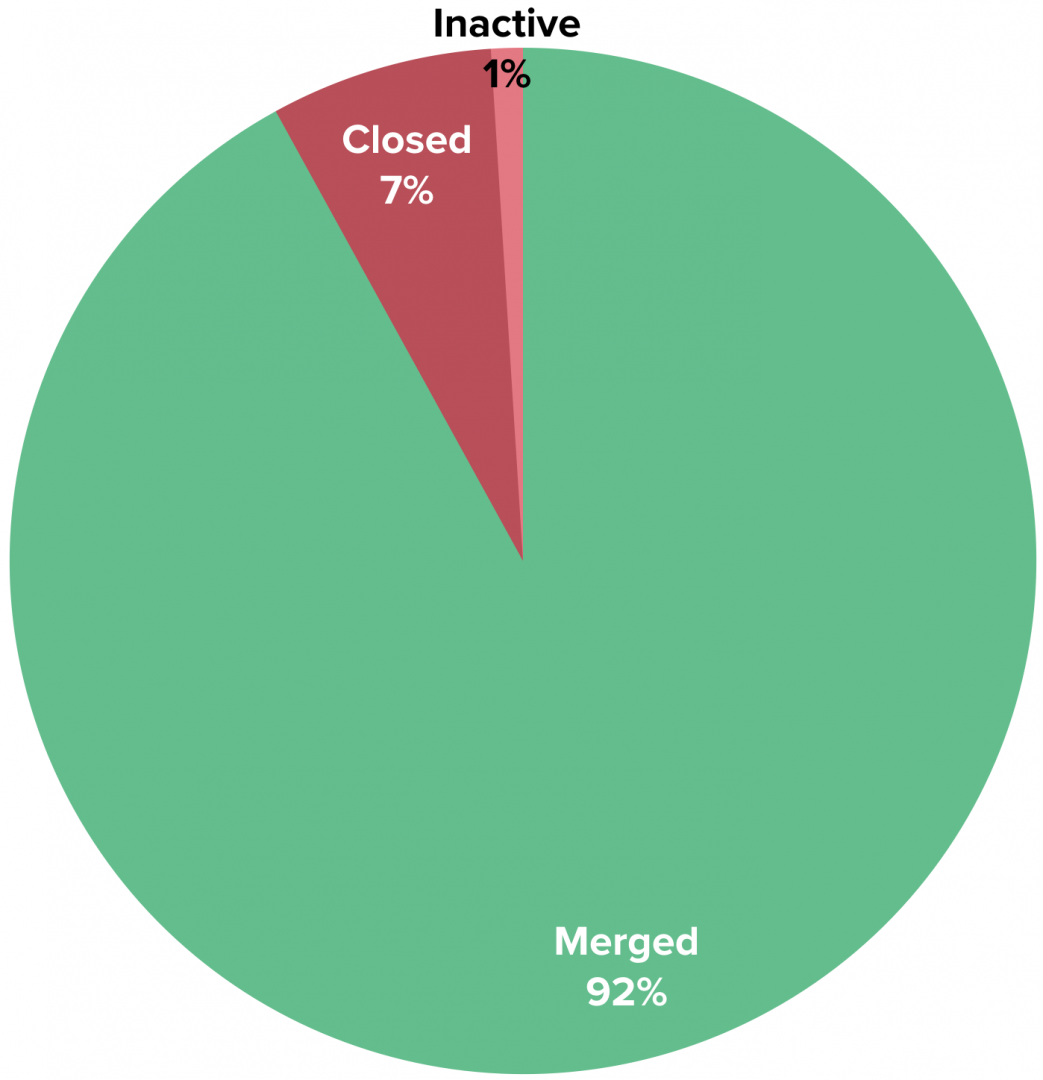
If you group closed and inactive Pull Requests together (“Abandoned PRs”), you can estimate that the average engineer abandons 8% of the Pull Requests they create, which is equivalent to a loss of $24,000 per year1, or the cost of a 2018 Toyota Camry Hybrid.
We consider PRs that have had zero activity for more than three days to be abandoned because our data shows a very low likelihood that PRs that go untouched for so long get merged later.
Achieving zero abandoned Pull Requests is an anti-goal, as it would require being extremely conservative when opening them. However, a high rate of abandoned PRs can indicate inefficiency and opportunity for improvement within an engineering process. Reducing PR loss by 20% on a team with 10 engineers could save $48,000 per year.
How does my team stack up?
Using an anonymized, aggregated analysis of thousands of engineering contributors, we’re able to get an understanding of how an engineering organization compares to others in the industry:
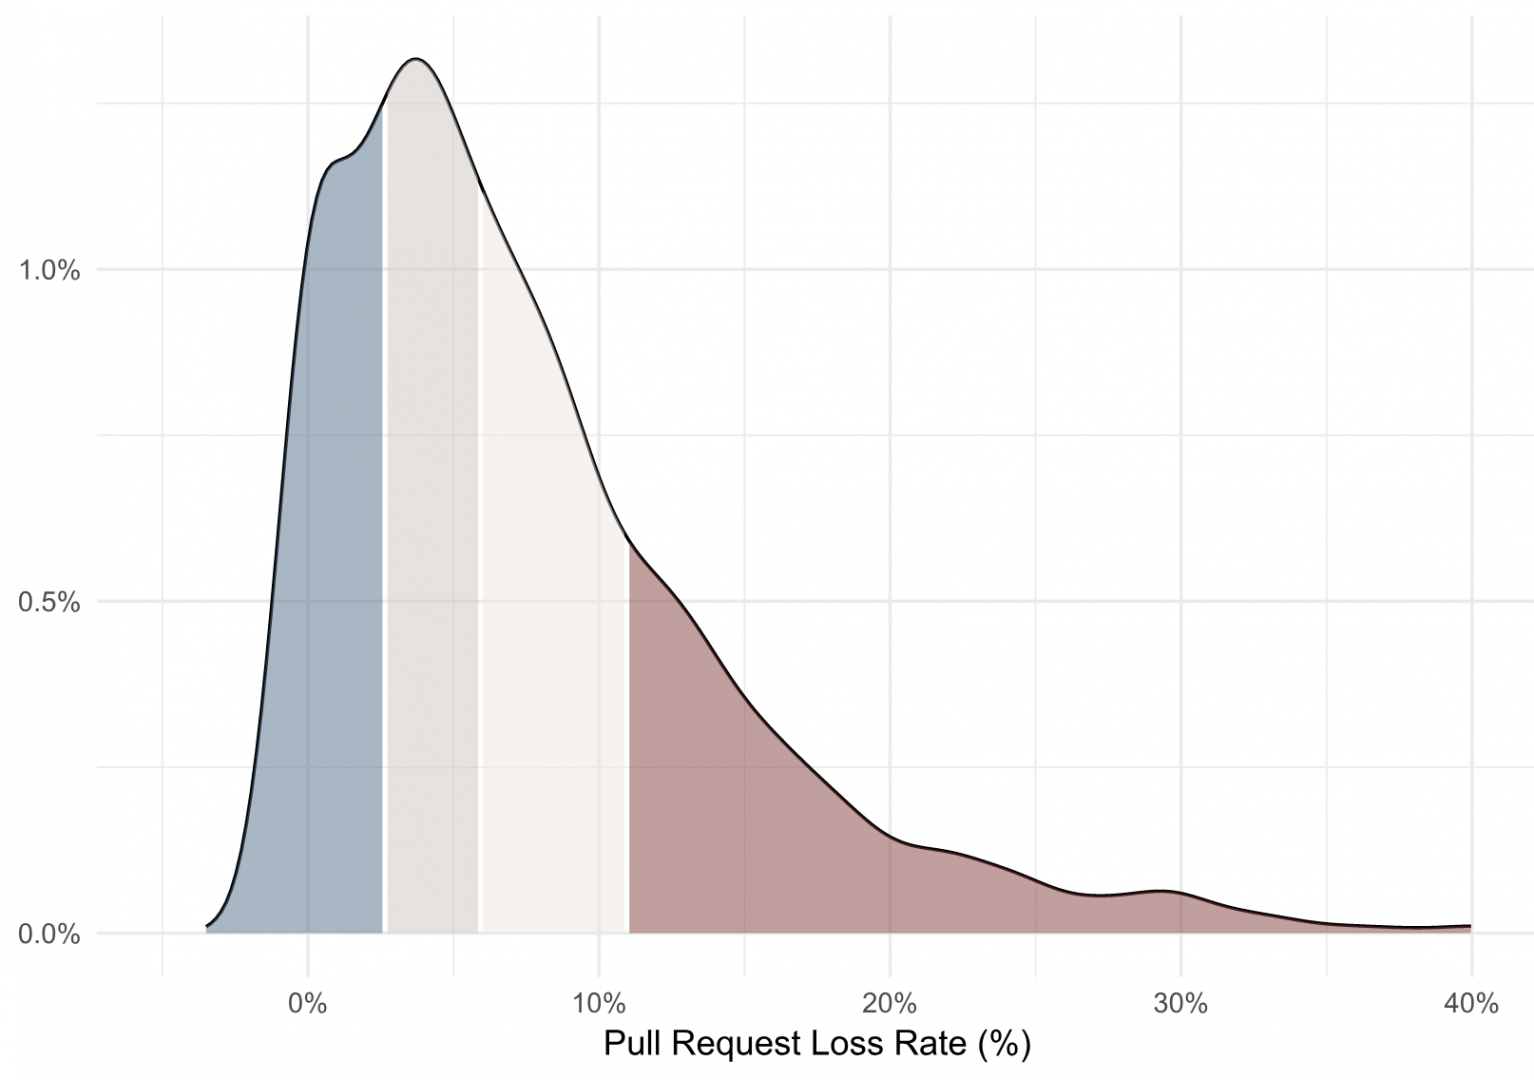
This density plot shows that the average Pull Request loss rate across our dataset is 8% (with a median of 6%). A loss rate above 11% would be in the bottom quartile, and a loss rate below 3% would be upper quartile performance.
Improving Pull Request outcomes
Abandoned Pull Requests are, of course, a lagging indicator. You can tell because it would be ridiculous to go to an engineering team and say, “All those PRs that you’re closing… merge them instead!”
Potential drivers lie upstream: late changing product requirements, shifting business priorities, unclear architectural direction and good ole’ fashioned technical debt. If you have an issue with abandoned Pull Requests, soliciting qualitative feedback is a great next step. Talk to your team. Identify something that is impacting them and talk about how you might avoid it next time. Then, rather than focus on the absolute value of your starting point, you can monitor that your abandonment rate is going down over time.
After all, you’d probably rather not send a brand new Camry to the scrap yard every year.
1 Assumes a fully loaded annual cost of $300k per developer.
Learn how a Code Climate's Software Engineering Intelligence solution can offer visibility into engineering processes and improve your team's PR outcomes. Request a consultation.

In the six years since we first introduced radically simple metrics for code quality, we’ve found that clear, actionable metrics leads to better code and more productive teams. To further that, we recently revamped the way we measure and track quality to provide a new, clearer way to understand your projects.
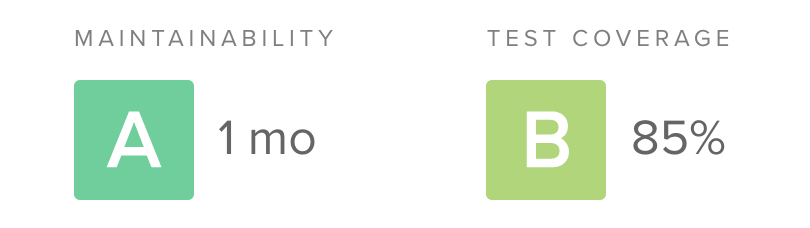
Our new rating system is built on two pillars: maintainability (the opposite of technical debt) and test coverage. For test coverage, the calculations are simple. We take the covered lines of code compared to the total “coverable” lines of code as a percentage, and map it to a letter grade from A to F.
Technical debt, on the other hand, can be a challenge to measure. Static analysis can examine a codebase for potential structural issues, but different tools tend to focus on different (and often overlapping) problems. There has never been a single standard, and so we set out to create one.
Our goals for a standardized technical debt assessment were:
- Cross-language applicability – A good standard should not feel strained when applied to a variety of languages, from Java to Python to JavaScript. Polyglot systems are the new normal and engineers and organizations today tend to work in an increasing number of programming languages. While most languages are based on primitive concepts like sequence, selection, and iteration, different paradigms for organizing code like functional programming and OOP are common. Fortunately, most programming languages break down into similar primitives (e.g. files, functions, conditionals).
- Easy to understand – Ultimately the goal of assessing technical debt with static analysis is to empower engineers to make better decisions. Therefore, the value of an assessment is proportional to the ease with which an engineer can make use of the data. While sophisticated algorithms may provide a seemingly appealing “precision”, we’ve found in our years of helping teams improve their code quality that simple, actionable metrics have a higher impact.
- Customizable – Naturally, different engineers and teams have differing preferences for how they structure and organize their code. A good technical debt assessment should allow them to tune the algorithms to support those preferences, without having to start from scratch. The algorithms remain the same but the thresholds can be adjusted.
- DRY (Don’t Repeat Yourself) – Certain static analysis checks produce highly correlated results. For example, the cyclomatic complexity of a function is heavily influenced by nested conditional logic. We sought to avoid a system of checks where a violation of one check was likely to be regularly accompanied by the violation of another. A single issue is all that’s needed to encourage the developer to take another look.
- Balanced (or opposing) – Tracking metrics that encourage only one behavior can create an undesirable overcorrection (sometimes thought of as “gaming the metric”). If all we looked for was the presence of copy and pasted code, it could encourage engineers to create unwanted complexity in the form of clever tricks to avoid repeating even simple structures. By pairing an opposing metric (like a check for complexity), the challenge increases to creating an elegant solution that meets standard for both DRYness and simplicity.
Ten technical debt checks
With these goals in mind, we ended up with ten technical debt checks to assess the maintainability of a file (or, when aggregated, an entire codebase):
- Argument count – Methods or functions defined with a high number of arguments
- Complex boolean logic – Boolean logic that may be hard to understand
- File length – Excessive lines of code within a single file
- Identical blocks of code – Duplicate code which is syntactically identical (but may be formatted differently)
- Method count – Classes defined with a high number of functions or methods
- Method length – Excessive lines of code within a single function or method
- Nested control flow – Deeply nested control structures like if or case
- Return statements – Functions or methods with a high number of return statements
- Similar blocks of code – Duplicate code which is not identical but shares the same structure (e.g. variable names may differ)
- Method complexity – Functions or methods that may be hard to understand
Check types
The ten checks break down into four main categories. Let’s take a look at each of them.
Size
Four of the checks simply look for the size or count of a unit within the codebase: method length, file length, argument count and method count. Method length and file length are simple enough. While these are the most basic form of static analysis (not even requiring parsing the code into an abstract syntax tree), most programmers will identify a number of times dealing with the sheer size of a unit of code has presented challenges. Refactoring a method that won’t fit all on one screen is a herculean task.
The argument count check is a bit different in that it tends to pick up data clumpsand primitive obsession. Often the solution is to introduce a new abstraction in the system to group together bits of data that tend to be flowing through the system together, imbuing the code with additional semantic meaning.
Control flow
The return statements and nested control flow checks are intended to help catch pieces of code that may be reasonably sized but are hard to follow. A compiler is able to handle these situations with ease, but when a human tasked with maintaining a piece of code is trying to evaluate control flow paths in their head, they are not so lucky.
Complexity
The complex boolean logic check looks for conditionals laced together with many operators, creating an exploding set of permutations that must be considered. The method complexity check is a bit of a hybrid. It applies the cognitive complexity algorithm which combines information about the size, control flow and complexity of a functional unit to attempt to estimate how difficult a unit of code would be to a human engineer to fully understand.
Copy/paste detection
Finally, the similar and identical blocks of code checks look for the especially nefarious case of copy and pasted code. This can be difficult to spot during code review, because the copied code will not show up in the diff, only the pasted portion. Fortunately, this is just the kind of analysis that computers are good at performing. Our copy/paste detection algorithms look for similarities between syntax tree structures and can even catch when a block of code was copied and then a variable was renamed within it.
Rating system
Once we’ve identified all of the violations (or issues) of technical debt within a block of code, we do a little more work to make the results as easy to understand as possible.
File ratings
First, for each issue, we estimate the amount of time it may take an engineer to resolve the problem. We call this remediation time, and while it’s not very precise, it allows us to compare issues to one another and aggregate them together.
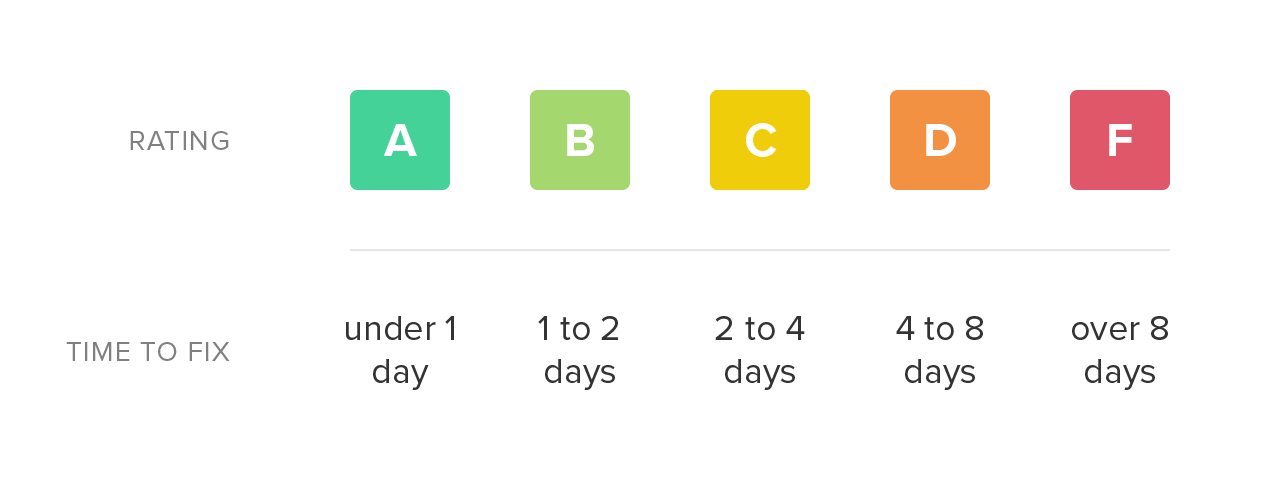
Once we have the total remediation time for a source code file, we simply map it onto a letter grade scale. Low remediation time is preferable and receives a higher rating. As the total remediation time of a file increases, it becomes a more daunting task to refactor and the rating declines accordingly.
Repository ratings
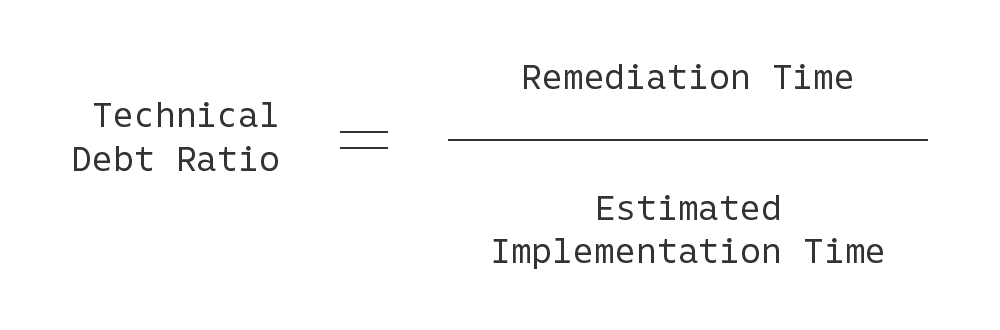
Last, we created a system for grading the technical debt of an entire project. In doing so, we’re cognizant of the fact that older, larger codebases naturally will contain a higher amount of technical debt in absolute terms compared to their smaller counterparts. Therefore, we estimate the total implementation time (in person-months) of a codebase, based on total lines of code (LOC) in the project, and compute a technical debt ratio: the total technical debt time divided by the total implementation time. This can be expressed as a percentage, with lower values being better.
We finally map the technical debt ratio onto an A to F rating system, and presto, we can now compare the technical debt of projects against one another, giving us an early warning system when a project starts to go off course.
Get a free technical debt assessment for your own codebase
If you’re interested in trying out our 10-point technical debt assessments on your codebase, give Code Climate Quality a try. It’s always free for open source, and we have a 14-day free trial for use with private projects. In about five minutes, you’ll be able to see just how your codebase stacks up. We support JavaScript, Ruby, PHP, Python and Java.

Formal code review is a recognized best practice within the software industry, for good reason, including:
- Providing newer developers an opportunity to receive feedback, ask for help, and make sure they’re on the right track
- Allowing experienced developers to keep an eye on code as it’s added to the codebase, and ensure it meets their organization’s standards
- Preserving and transferring institutional domain knowledge
That said, code review also has its issues. It can be cumbersome to perform, challenging to arrange, and difficult to standardize. We certainly found it to be a headache — and we love reviewing code! That’s why we built Code Climate: to automate as much of the review process as we can, in a way that seamlessly integrates with our pull request workflow.
Why build an automated code review process around pull requests? Because they make your life easier. A page with a URL that encompasses the code changes and the technical product discussions around a feature makes the intangible more tangible. It surfaces discussion that can otherwise be hard to access. It archives conversation and can serve as a valuable reference for new team members getting up to speed on how work gets done at your shop.
Previous solutions for this workflow problem would have your artifacts scattered all over the place — code changes in your version control system, comments in an issue tracker, and, of course, tons of email. Pull requests corral everything, and this improved locality is hugely convenient. They also allow you to attach media, engage in illustrative conversation, and signal that you simply like what you see. All of this enhances the code review process by helping to flesh out the impersonal nature of online, asynchronous communication. Plus, every developer knows what a pull request is and how they work.
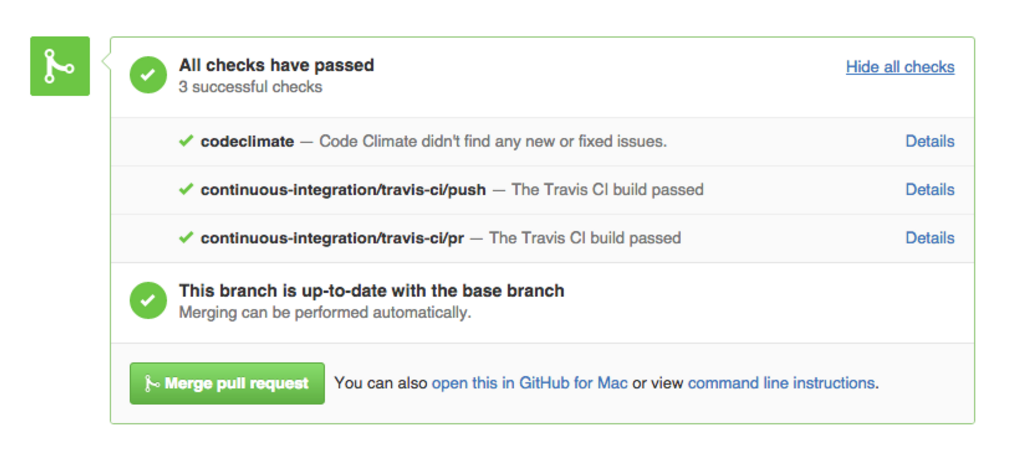
Our pull request integration automatically scans your PRs for code quality and security issues. After you open a PR, Code Climate will update its status in GitHub, as seen in the screenshot below. Our status update provides a direct link back to the relevant branch comparison page, giving you a detailed analysis of how the PR branch compares to your default branch.
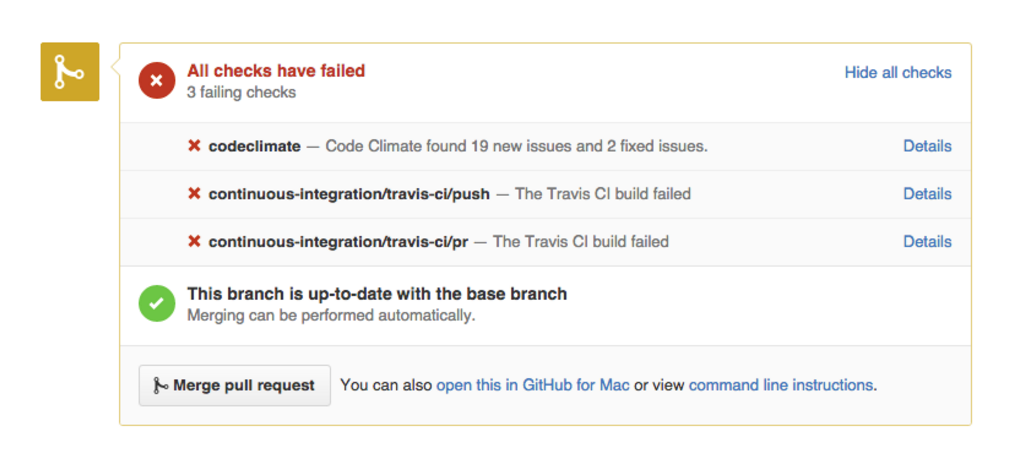
Code Climate automatically checks for consistent style, eliminating the need for developers to review this manually. In fact, your team standards will be enforced on every commit — your pull request will be marked “failed” if any new checks are found — ensuring consistency across your codebase.
Having an automated tool deliver information about code quality issues has benefits beyond time-saving. Everyone gets the same treatment from an automated analysis, and that’s a good thing for your team’s morale and for your code, with the kind of feedback that’s dismissed as “nitpicking” when provided by a team member generally well-received when delivered by a “bot”.
Combining the power of automated code review with a GitHub based pull request workflow works. When all communication is centralized, and developers aren’t sidetracked by tasks or feedback that can be automated easily, friction is reduced, confidence increases, and your output improves. Try it with your team — we think you’ll like it!

While developers love to let their opinions be known about how code should be formatted, the style of your company’s codebase isn’t something that should be left to personal taste. Even veteran code readers will experience frustration trying to mentally translate semantically equivalent statements between styles. It certainly raises the barrier to entry for new members of your team to have to learn multiple styles in order to learn or contribute to a project. The maintainability of any codebase is closely tied to how easily it can be understood, so ambiguity in this area is not desirable.
Code that adheres to a consistent style is easier to peruse, quicker to update, unlikely to start unnecessary debates, and focuses attention where it’s necessary — on the functionality and meaning.
Fortunately, style conventions are simple to mechanically enforce. That’s right, ensuring style consistency is a task that can largely be offloaded to external automated services or libraries, meaning that it’s work you and your team won’t have to do!
Here’s how you do it:
1) Choose your linter
The first step in implementing your style guide is to pick a linter. Linters provide all the benefit of style consistency with none of the wasted discussion time. Even better, the ones developed for specific programming languages — like our many linting engines — have the conventions of the community encoded right into the tool. However, because these tools offer a broad range of functionality, getting them integrated into your development process can be something of an art. Which brings us to step 2,
2) Integrate the linter into your development process
While there are several ways to manually integrate a linter, they tend to be cumbersome and require considerable ongoing effort. Command line tools which take a variety of parameters are annoying in their own right. Ensuring that developers run a tool locally is almost as burdensome as stylistic discussions. An alternative to running these tools yourself (or convincing your team to use them) is to instead take advantage of a service like Code Climate — either our hosted service or our free CLI — that allows you to configure the automated analysis to your liking and be ensured that everyone is being held to the same standard.
3) Configure your external services
Once you settle on a tool to automate style review for your chosen language, you can configure an external service to keep your pull request up-to-date with the output of this analysis. This will be the start of a tight feedback loop that will keep your team kicking ass.
4) Incorporate into your code review
A good rule of thumb for understanding how to think about code style in terms of code review is the following: Can it be automated? If the change being suggested has been agreed upon by the team, and can be trivially handled by a style linter, it’s simply not worth discussing. Just add the requirement to your linter configuration and move along.
5) Enjoy more maintainable code and a happier team that doesn’t spend each day arguing about semi-colons
Adhering to a style guide results in code that’s quickly understood and easier to maintain, and happier developers who no longer feel nit-picked over their personal style preferences. Automating that function ensures those standards are enforced consistently, and that your code’s health will continue to improve over time. It’s a win-win. If you haven’t tried it yet, we highly recommend you give it a go!

Software teams trying to improve the health of their codebase are often hindered by a lack of refactoring experience. Combine this with a mix of experience levels (both with the code and the domain), and differing style preferences, and it’s easy to understand how even well-intentioned teams find it hard to effect positive change.
There are a variety of techniques to help in these cases, but our favourite is “Mob Refactoring”. It’s a variant of Mob Programming, which is pair programming with more than two people and only one computer. This may sound like complete chaos — and we certainly don’t recommend working like this all the time — but it can be a very effective approach for leveling up the refactoring abilities of the team and establishing shared conventions for style and structure of code.
Here’s how it works:
1) Assemble the team for an hour around a computer and a projector. We recommend ordering food and eating lunch together — your long-term code quality goals will only be helped if there’s a positive association between refactoring and delicious food.
2) Bring an area of the codebase that’s in need of refactoring. Have one person drive the computer, while the rest of the team navigates.
3) Attempt to collaboratively refactor the code as much as possible within the hour.
4) Don’t expect to produce production-ready code during these sessions. The value of the exercise is in the conversations that take place, not the resulting commits.
5) Stick to your one hour timbebox and, when you’re done, throw out the changes. Under no circumstances try to finish the refactoring after the session — it’s an easy way to get lost in the weeds.
Do this a few times, and rotate the area of focus and the lead each week. Start with a controller, then work on a model, or perhaps a troublesome view. Give each member of the team a chance to select the code to be refactored and drive the session. Even the least experienced member of your team can pick a good project — and they’ll probably learn more by working on a problem that is on the top of their mind.
Mob Refactoring sessions provide the opportunity for less experienced members of the team to ask questions like, “Why do we do this like that?”, or for more senior programmers to describe different implementation approaches that have been tried, and how they’ve worked out in the past. These discussions help close the experience gap and often lead to a new consensus about the preferred way of doing things.
If you have a team that wants to get better at refactoring, but experience and differing style patterns are a challenge, give Mob Refactoring a try. It requires little preparation, and only an hour of investment, but the impact can be massive.

If you’ve spent any amount of time working with software professionally, chances are you’ve experienced the vicious cycle of development (if you haven’t, take a moment to count your blessings then read on for a cautionary tale):

High pressure situations place strain on developers, which leads to sloppy work, resulting in software being delivered late and broken – when it’s delivered at all.
Instead of being pressure-driven, as in the cycle pictured above, we’re aiming for a “virtuous cycle” which focuses on quality:
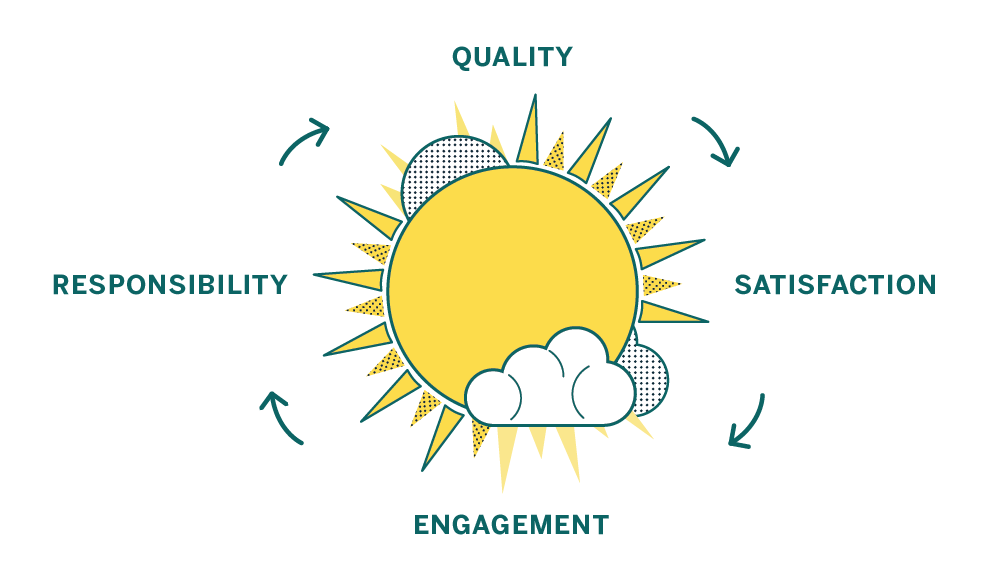
A focus on quality leaves individual contributors feeling satisfied, which makes them more engaged. That engagement leads to a sense of responsibility over the product and the code. A sense of responsibility and ownership leads to higher quality work, and the cycle starts over again.
Here at Code Climate we have experience as software engineers, engineering managers, product owners, and startup founders – and in all those roles we’ve seen evidence that a commitment to code quality has amazing benefits. Over time your codebase will become healthier, making it easier to change, more fun to work with, and your features will be easier to implement. As a result your code will be more reliable when it runs, bringing benefits to your business. Sounds good, right?
Unfortunately, breaking out of a vicious cycle is challenging because the cycle feeds on itself and doesn’t allow much time for the work needed to establish good practices. But while there is work involved, it’s definitely not impossible, and good tools and advice can help you beat the clock and replace your vicious cycle with a culture of code quality.
We’ve identified steps you can take to move toward a sustainable culture of code quality, no matter what kind of code you’re working with:
- Codify your best practices
- Automate, automate, automate
- Get the right info to the right people
- Measure your progress
- Encourage participation and ownership

In exciting programming language news (how often do you get to say that?) Apple recently released Swift, a compiled language meant to augment Objective-C for development on Desktop and Mobile iOS platforms. While Swift’s primary audience at this (very early) point is iOS developers, the language contains some interesting functionality for program design that will appeal to a wider audience, including Ruby, JavaScript, and PHP developers.
In this post I’ll take a look at three of the program design constructs that Swift provides: Classes, Structures, and Protocols. I’ll discuss how they can contribute to well-designed Object-Oriented (OO) programs in a way that might be interesting to dynamic language programmers, and show how aspects of their design reflect concerns of the platform for which they were developed.

Classes and Structures
The best source of information about Swift so far is The Swift Programming Language, a free e-book provided by Apple. It contains a first pass introduction to the language, a language reference, and a good deal of example code. After introducing the basic facilities of the language – its philosophy, the basic available types and data structures, control flow, closures, and so on – we get to the section on Classes and Structures.
“Classes and structures are general-purpose, flexible constructs that become the building blocks of your program’s code.” [1]
This sounds similar to the functionality of a Class or Module in Ruby. From this list of the features of Classes and Structures, we see even more similarities. Classes and Structures can both:
- Define properties to store values
- Define methods to provide functionality
- Define initializers to set up their initial state
- Be extended to expand their functionality beyond a default implementation
This means that Swift provides similar functionality to familiar OO Programming Languages. We can model problems using objects which can encapsulate data and functionality, and build complex relationships between these objects in a modular fashion. Curious readers might have the same reaction to this as I did – if it’s the case that both classes and structures can do the above, which is a reasonable set of functionality to expect from classes, why are there two constructs? What are the differences between them, and why does Swift as a programming language need both?
First, let’s take a look at what Classes can do that Structures cannot. Classes provide functionality for two crucial pieces of OO functionality that Ruby developers, for instance, tend to rely on somewhat heavily:
- Inheritance, where one class can inherit the characteristics of another
- Type casting, where you can check and interpret the type of a class instance at runtime
Additionally, classes provide the following facilities which are stated in terms familiar to those with experience managing resources and memory manually:
- Deinitializers, to enable an instance of a class to free up any resources it has assigned
- Reference counting, to allow for more than one reference to a class instance
Stated in other terms, inheritance, type casting, deinitializers, and reference counting make it possible to expressively create designs which employ the full compliment of OO techniques.
From my perspective, Classes and Structures have just the right amount of overlap in functionality, leaving enough room for developers to make reasoned decisions about which construct to employ according to the purpose it may be used for. The differences hinge on how instances of Classes and Structures are represented in memory after they are initialized – structure instances are always passed by value and class instances are always passed by reference. This distinction is something that dynamic language developers typically do not have to spend much time thinking about – on a mobile platform, however, this kind of thinking becomes very important.
Different memory semantics is not the only advantage of having these distinct types, however. Because structures are simpler than classes, and cannot be as heavily modified after declaration, they provide an opportunity to create value objects which represent pieces of data independent from their behavior. This is very useful.
While Classes and Structures cover much of the familiar ground with respect to OO functionality in Ruby or Python, there is one more construct that might not be so familiar that I’d like to point out before we draw any conclusions on Swift’s OO design capabilities.
Protocols
Protocols are an interesting addition to the already rich world of classes and structures. They provide a way to define behavior separately from the classes which implement them:
“A protocol defines a blueprint of methods, properties, and other requirements that suit a particular task or piece of functionality”
Similar constructs exist in Java, Go, and other languages, but many dynamic languages do not embrace this design style. Protocols embrace flexible design by encapsulating the necessary data and behavior for a domain idea outside the scope of a Class or Structure definition. This means that a concept can be represented separately from its implementation, allowing for more creative reuse, composition, and more.
To illustrate the usefulness of Protocols, consider the development of a small networked process to record some information from a system over time. You might want to have the system write to a Key-Value store, or to disk, or to STDOUT, depending on a variety of circumstances. In this case, you would simply define a Protocol:
protocol BackEnd { func get(Int) -> Int func set(Int) -> Bool }
This protocol requires that anything which implements them must contain at least two instance methods – get, which accepts an Integer and returns an Integer, and set, which accepts an Integer and returns a Boolean value. A class that implements this Protocol might look something like the following:
class RedisBackEnd : BackEnd { func get(id: Int) -> Int { // Get 'val' from Redis based on 'id' let val = getFromRedis(id) return val } func set(val: Int) -> Bool { // Store 'val' in Redis here let boolFromRedis = storeInRedis(val) return boolFromRedis } }
You could imagine similar classes for the other backends I mentioned above. This is a very convenient solution for swapping out backends when you need to run your process in different locations and under different circumstances – simply implement new ones as needed, and pass them in wherever a Backend is needed.
Defining a Protocol and implementing it is really the tip of the iceberg, however – things can get very subtle and complex. Protocols can be treated as types, and intricate hierarchies can be created with them. While it is interesting to look through the Swift book to see these examples, I don’t believe they are the real selling points of protocols. Used simply and in combination with classes and structures, protocols provide a missing piece of the design puzzle that often vexes programmers in dynamic languages.
Conclusion
Swift is a very interesting programming language that at first blush appears to have all of the necessary components to build expressive OO programs. In addition to classes, structures, and protocols, Ruby developers might also want to look into Extensions which offer mixin-like capabilities.
Whether you prefer inheritance, composition, or even a more esoteric SmallTalk style flavor of OO, it seems that Swift will be able to support you.
Works Cited
[1] Apple Inc. “The Swift Programming Language.” iBooks.