

The following article is based on a talk Juan Pablo Buriticá, VP of Engineering at Splice, gave at our annual Engineering Leadership Conference and a subsequent interview. Watch the full talk here, and see the slides here.
“The most shocking thing is that software engineering is one of the least rigorous practices that exists,” says Splice’s VP of Engineering, Juan Pablo Buriticá. After graduating with a degree in Pharmaceutical Chemistry, he eventually taught himself to code and transitioned to a career in software. Juan Pablo was astonished to find software engineering to be a much more fragmented discipline. Few standards exist around even the most common software production methods, like Agile and Continuous Delivery.
When managing a small team, the lack of industry standards was rarely an issue for Juan Pablo. Whenever something felt inefficient, he’d get the whole engineering team in a room, identify the source of friction, adjust, and move on. After Juan Pablo scaled his team from 15 to 80 distributed developers, however, all their processes broke. “I had to go back and fix the mess I created by growing the team so fast,” said Juan Pablo.
But fixing them wasn’t so easy anymore. So, Juan Pablo turned to engineering measuring tools and the Scientific Method.
Experiment 1: Applying Metrics to Engineering
Forming a Hypothesis
Before experimenting to determine which actions would yield improvement, Juan Pablo and the rest of the management team agreed that they needed to determine what specific outcome they were optimizing for. The team agreed that everything felt slow— but a gut feeling wasn’t enough to start making changes in the team.
They wanted to:
- First, decide what they were working towards. They weren’t willing to settle for a vague anti-goal of “slowness”— they wanted a clear vision of what the team should look like.
- Second, decide how they would measure progress. Within the newly agreed-upon context and direction of the team, they wanted a system to measure how far away they were from their goals.
Thus, their hypothesis was: A Defined Direction + A Focus on Success Metrics = Increased Tempo.
The product and engineering leadership spent an offsite deliberating on what was next for Splice. They came up with the following vision for the organization: Shipping working code is one of the fastest, safest, and most effective ways to learn and to test new ideas. This meant that engineers were confident enough in their processes and tooling to take risks. And they also felt able to mitigate issues when invariable something did break.
To test how they were doing and how far they had to go, they leveraged engineering measuring tools to investigate three metrics: Time to Merge, Deploy Frequency, and End to End Test Coverage. Combined, the team believed optimizing for these metrics would give their team confidence in the stability and speed of their processes.
Conducting the Experiment
Juan Pablo and the leadership team communicated this new vision and supporting metrics to the team. They were careful to note that this was an experiment designed to help improve collaborative processes— not a change in response to performance issues.
These are the goals they communicated:
- Time to Merge: 100% of pull requests should be merged within 36 hours (or 3 days)
- Deploy Frequency: All product teams had to deploy once a day
- End to End Test Coverage: 100% of engineers had to write an end-to-end test in an improved testing environment
The specific targets they chose for each metric were a guess. “I picked 36 hours, because why not?” says Juan Pablo. The team was experimenting with metrics for the first time, so they had to start with a number. He predicted that enabling his team to track and measure these metrics alone would be enough to create change.
Analyzing the Results
After one quarter, Juan Pablo didn’t observe the results he anticipated.
Although one engineer did put in work to make staging less of a blocker to production, there were few other changes to how the team worked. Pull Requests were not being merged within 3 days, and product teams were not deploying once a day.
These metrics revealed that they hadn’t moved the needle, but didn’t reveal what to do about it.
Experiment 2: Applying Actionable* Metrics to Engineering
Forming a Hypothesis
Juan Pablo had a conviction that their direction was right, but he realized the metrics that they had chosen weren’t actionable. It wasn’t clear what could be done by any individual engineer or manager to improve how the process works. “I knew I needed better metrics and measurements,” Juan Pablo told us.
So he scoured the internet for all the reading material he could find. Two sources moved him toward finding more better measurements:
- State of DevOps reports, which regularly surveys 1,000s of engineers to identify positive work patterns and the best indicators of improvement.
- Accelerate, in which the authors of the DevOps reports distilled their findings after four years and identified four crucial metrics to measure and improve engineering tempo.
These resources were based on research that had been conducted over several years with scientific rigor— exactly what Juan Pablo was looking for.
One major pattern that the researchers promoted was to distinguish product design from product delivery. Juan Pablo had been thinking of all of product and engineering as a single entity— but the process could be separated into predictable and unpredictable portions of the workflow.
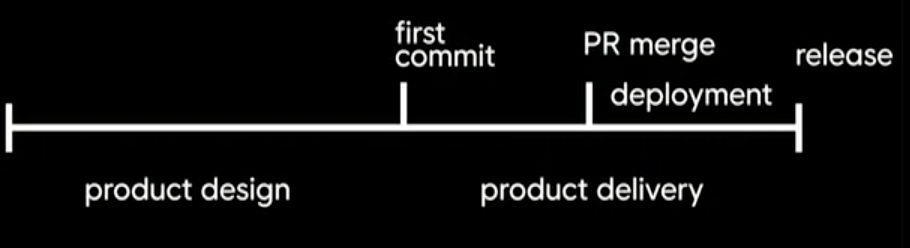
Product design and planning are, by nature, unpredictable. They often involve scoping work that has never been done before, so it often results in imprecise estimation of scope and effort. Delivery, on the other hand, can be made predictable. Engineers can ship changes incrementally, irrespective of the scope of the feature they’re working on.
Thus Juan Pablo’s new hypothesis was: Decoupling Engineering from Product + Actionable Deliverability Metrics = Increased Engineering Tempo. The metrics they chose were Cycle Time, Mean Time to Restore and Deploy Frequency.
With a new hypothesis and a “plan for the plan,” as Juan Pablo calls it, the engineering team was ready to try again.
Conducting the Experiment
Decoupling engineering from product would take some heavy lifting, so Juan Pablo put together a Production Engineering team. “Their job was to build the tooling, services, and expertise that enables teams to deliver and operate high quality, production-level software and services,” says Juan Pablo.
This team was responsible for owning improvement on key metrics:
- Cycle Time (commit to production), targeting less than one hour.
- Mean Time to Restore (MTTR), targeting less than one hour.
- Deploy Frequency, targeting more than once a day.
To be able to track Cycle Time and Deploy Frequency, Juan Pablo found an engineering analytics tool, Velocity. Out-of-the-box, it shows three years of historical data, so Juan Pablo could measure how scale impacted the team, and whether they were trending in the right direction.
To start trending in the right direction, they had to work towards giving engineering more ownership over product delivery. Decoupling meant a few major transitions:
- Engineers were responsible for deploying code, while product would decide when to release features to customers.
- Testing is shifted left and becomes integrated into the developers’ responsibilities. Developers, therefore, don’t have to wait for a QA team to ship changes.
- The department invests in more testing and monitoring tooling, so the team can ship with more confidence.
Over the next quarter, the Production Engineering team worked with the organization to bring down Cycle Time.
Analyzing the Results
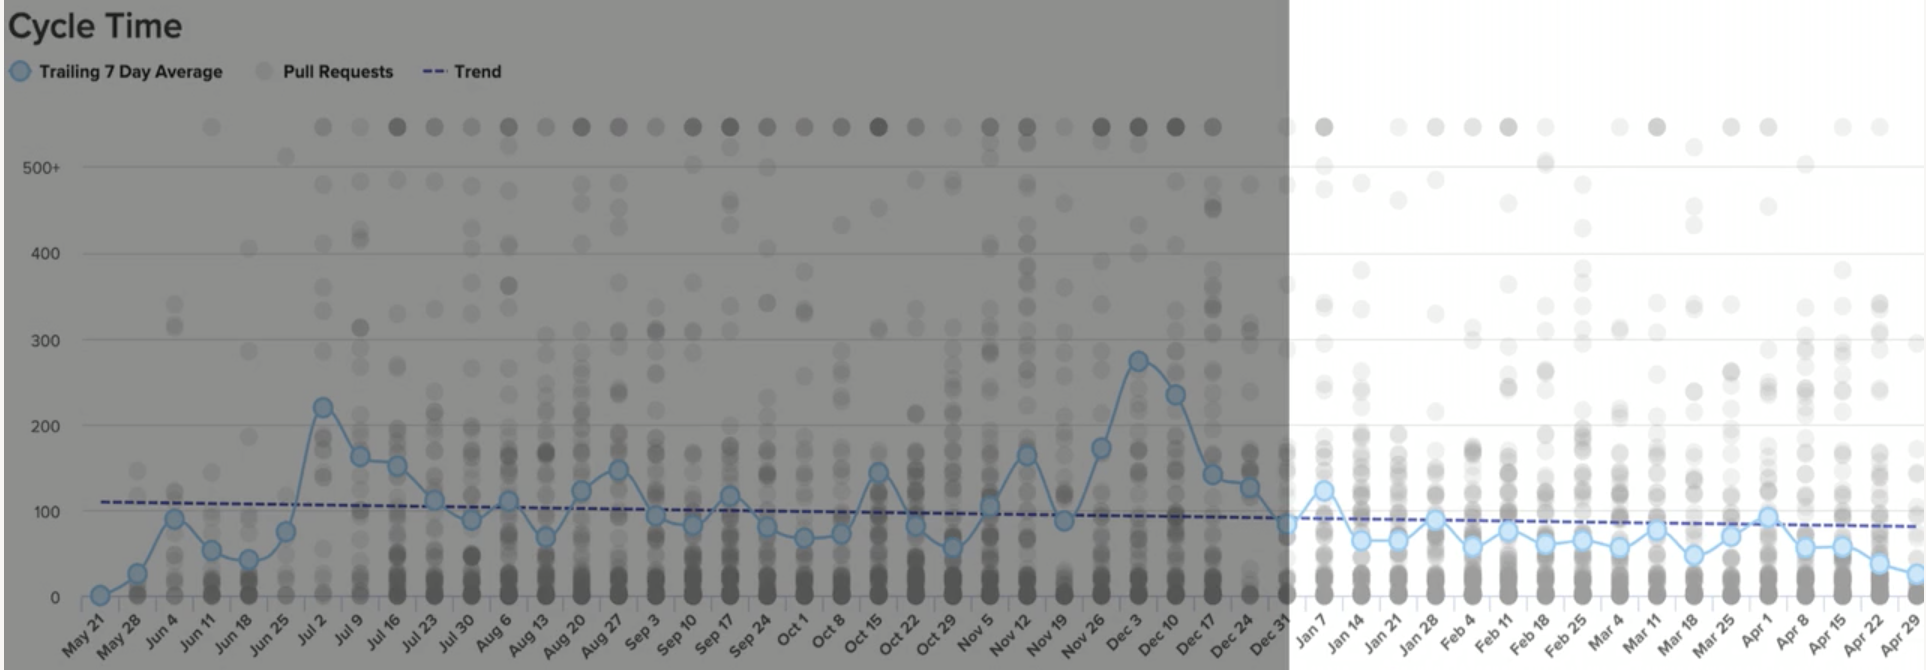
At the end of that quarter, the results spoke for themselves. On his Velocity dashboard, Juan Pablo saw Cycle Time had decreased by 25%. Even more importantly, however, it had become consistent:
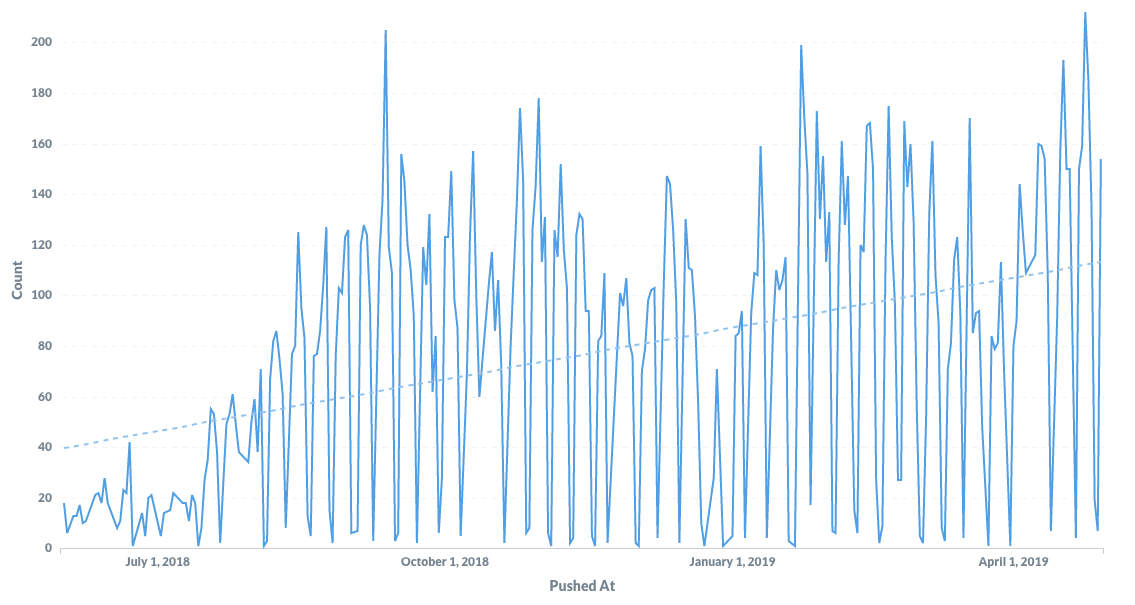
The team’s throughput had increased 3x without a significant change in headcount:
“We saw results—and we also finally had the language to talk about performance,” said Juan Pablo.
The actionable metrics Juan Pablo had discovered monitored within Velocity gave the whole team a means to communicate how far away they were from their goals. When an engineer was blocked for any reason, they could point to the effect it had on Cycle Time. This focus helped them solve the immediate problem of increasing tempo, but also equipped the team with the visibility to solve upcoming problems.
Building Scientific Rigor into Continuous Improvement
While the metrics and practices in Accelerate aren’t quite industry standards yet, the researchers have applied a level of scientific rigor that has yielded predictable results for organizations of all sizes. The DevOps report has shown that over the past 4 years, an increasing number of organizations are practicing Continuous Delivery. More of the industry is using engineering measuring tools to look at metrics like Cycle Time and Deploy frequency, and seeing tangible improvements in engineering speed.
Through these recent studies and his own research, Juan Pablo had the unbiased data to finally approach software engineering like a scientist.
Thanks to the hard work of the Splice engineering team and their investment in engineering measuring tools like Velocity, Juan Pablo told us: “We have created a culture of continuous systems and process improvement. We also have a language and a framework to measure this change.” Sign up for Velocity demo to see how your team can benefit from similar visibility.
Get articles like this in your inbox.
Trending from Code Climate
1.
Engineering Leaders Share Thoughts on Leadership in Disrupted Times in a New Survey
For engineering teams, disruption to the business can have a significant impact on the ability to deliver and meet goals. These disruptions are often a result of reprioritization and budget changes on an organizational level, and are amplified during times of transition or economic instability.

2.
Built In’s 2023 Best Places to Work — Why Code Climate Made the List
At Code Climate, we value collaboration and growth, and strive for greatness within our product and workplace. For us, this means fostering a supportive, challenging, people-first culture. Thanks to an emphasis on these values, we’ve earned spots on three of Built In’s 2023 Best Places to Work awards lists, including New York City Best Startups to Work For, New York City Best Places to Work, and U.S. Best Startups to Work For.

3.
Turnkey Deployment Delivers Day-One Value for Yottaa
Learn how Yottaa gained immediate value from Code Climate Velocity right out of the box.

Get articles like this in your inbox.
Get more articles just like these delivered straight to your inbox
Stay up to date on the latest insights for data-driven engineering leaders.