

This post is the first article in our Tactical Guide to a Shorter Cycle Time five-part series.
Low Cycle Time is a characteristic of high performing teams–and the authors of 9 years of DevOps Reports have the data to prove it. In their book, Accelerate, they’ve found a direct link between Cycle Time and innovation, efficiency, and positive engineering culture.
Our data analysis of over 500 engineering organizations corroborates their findings. It also reveals helpful benchmarks for teams to gauge how they compare to the rest of the industry. We’ve uncovered that:
- The top 25% achieve a Cycle Time of 1.8 days
- The industry-wide median is 3.4 days
- The bottom 25% have a Cycle Time of 6.2 days
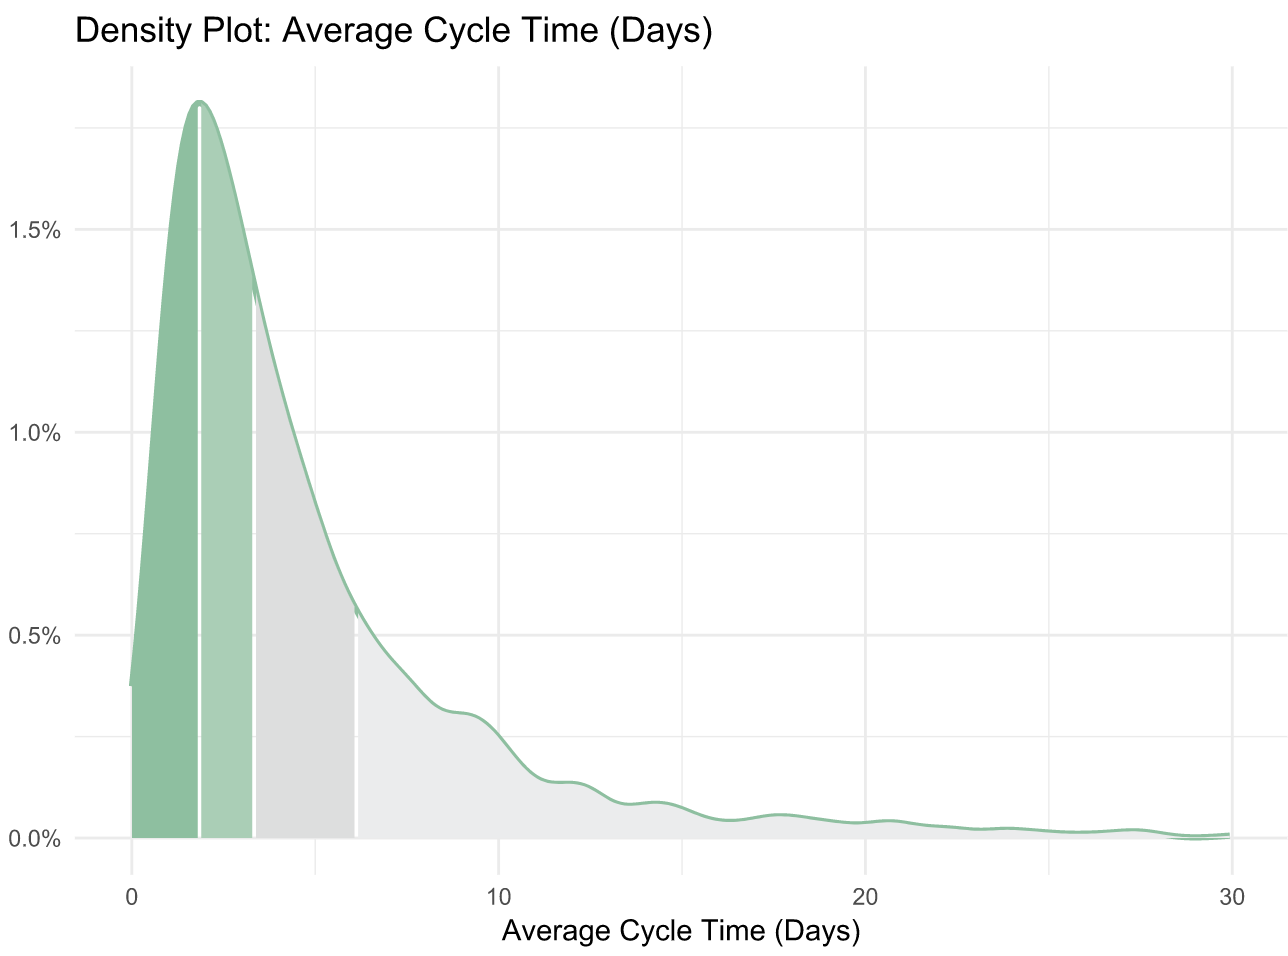
The Accelerate authors discovered the “elite” performers (making up just 7% of the industry) reach a Cycle Time of less than one hour. This means that the median Cycle Time is 80 times higher than that of the best performing organizations. This spread suggests that the majority of the industry either doesn’t measure Cycle Time, doesn’t know what a good Cycle Time is, or doesn’t know how to fix it.
This is why today, we’re kicking off our Tactical Guide to a Shorter Cycle Time, a 5-part series to help you accomplish all of the above.
The Virtuous Circle that Spurs Continuous Improvement
We define Cycle Time as the time between first commit and deploy of a changeset. Whether or not your definition matches ours precisely, optimizing the amount of time between these two events will significantly improve your engineering team’s efficiency (we’ve observed increases of at least 20%).
Measuring and improving this metric has a long term effect that’s even more significant than the initial bump in productivity. It sets in motion a Virtuous Circle of Software Delivery, in which optimization that encourages better engineering practices, paired with the positive reinforcement that comes from unblocking, encourages more optimization that sparks better coding practices, and so on.
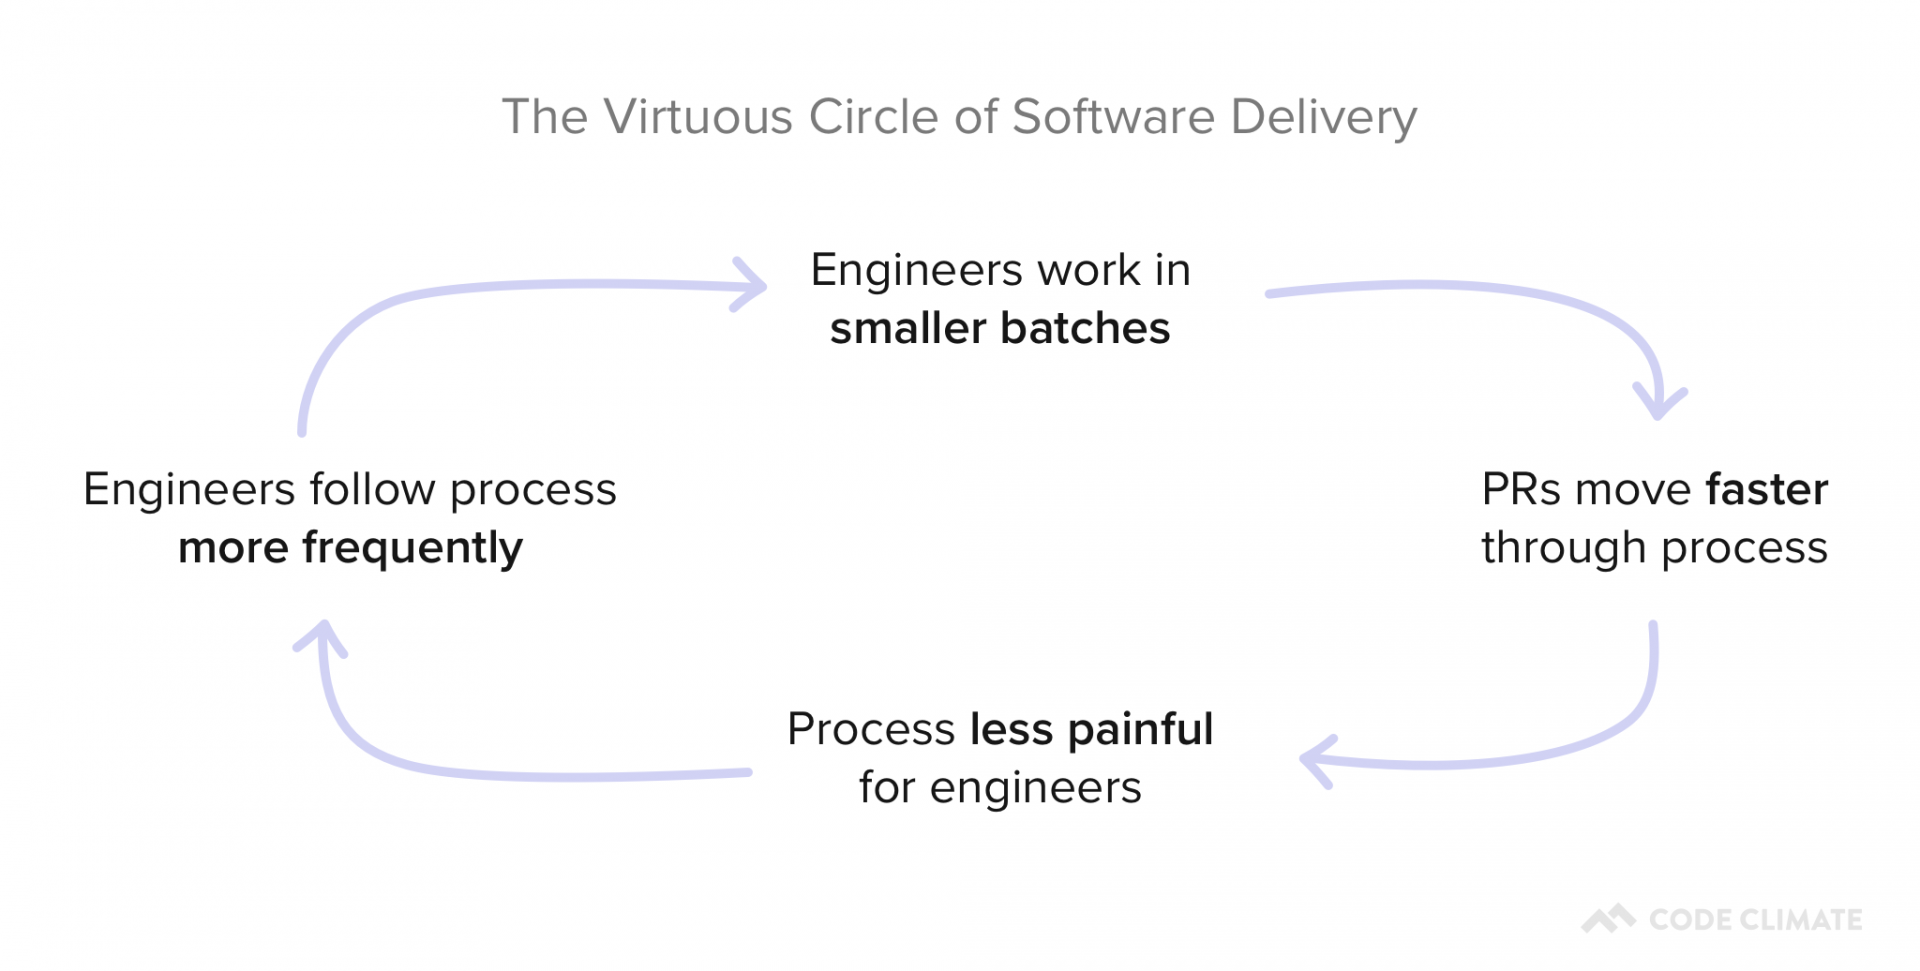
The process of improving each portion of your Cycle Time will create a culture of Continuous Improvement on your team.
Where to Start
First, you’ll want to know what your Cycle Time is and how it compares to the industry average.
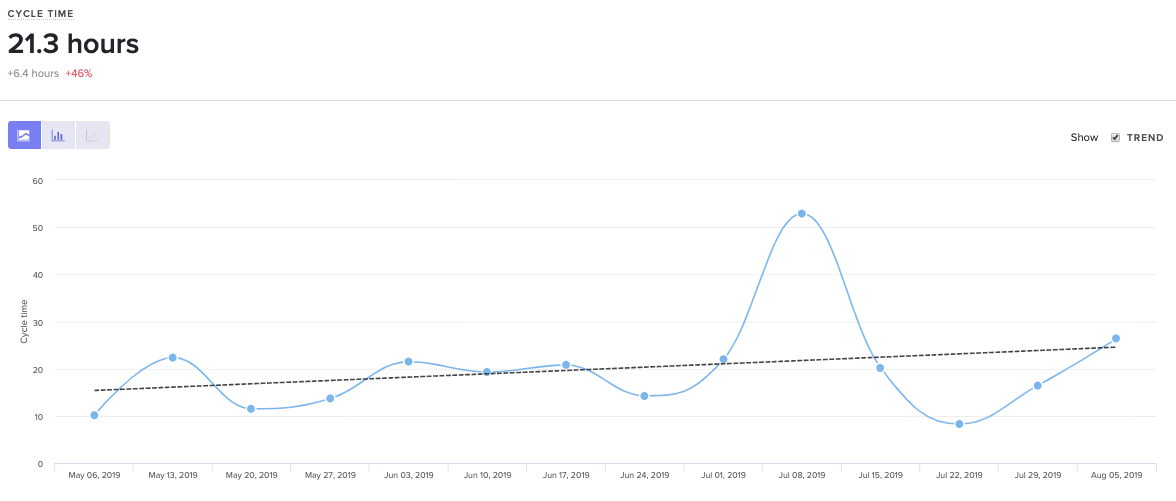
Velocity shows you Cycle Time with 3 years of historical data out of the box.
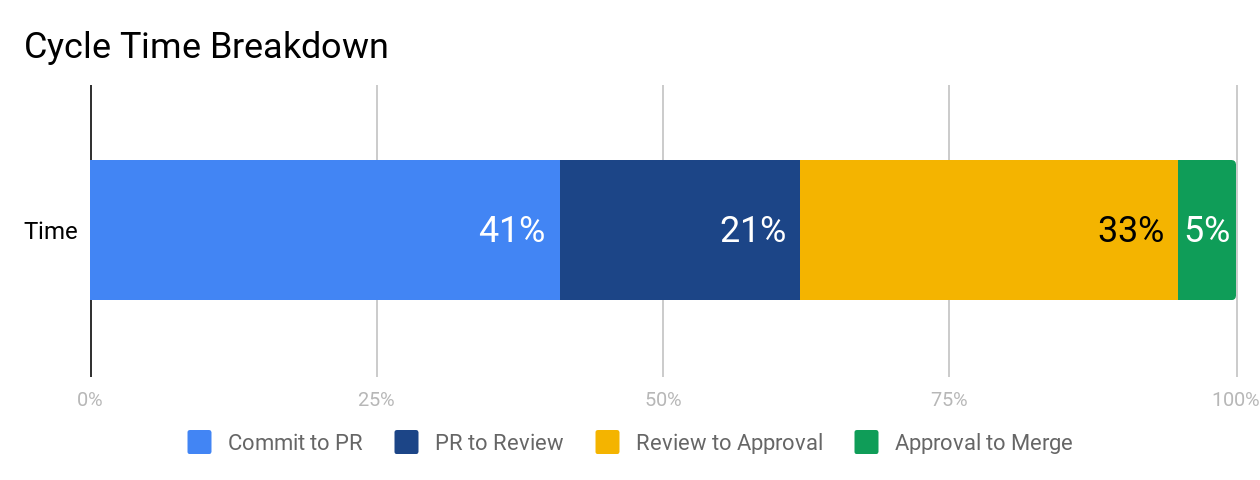
At face value, Cycle Time is a great metric to gauge success, but it isn’t diagnostic. To understand why your Cycle Time is high or low, you’ll want to look at its four constituents:
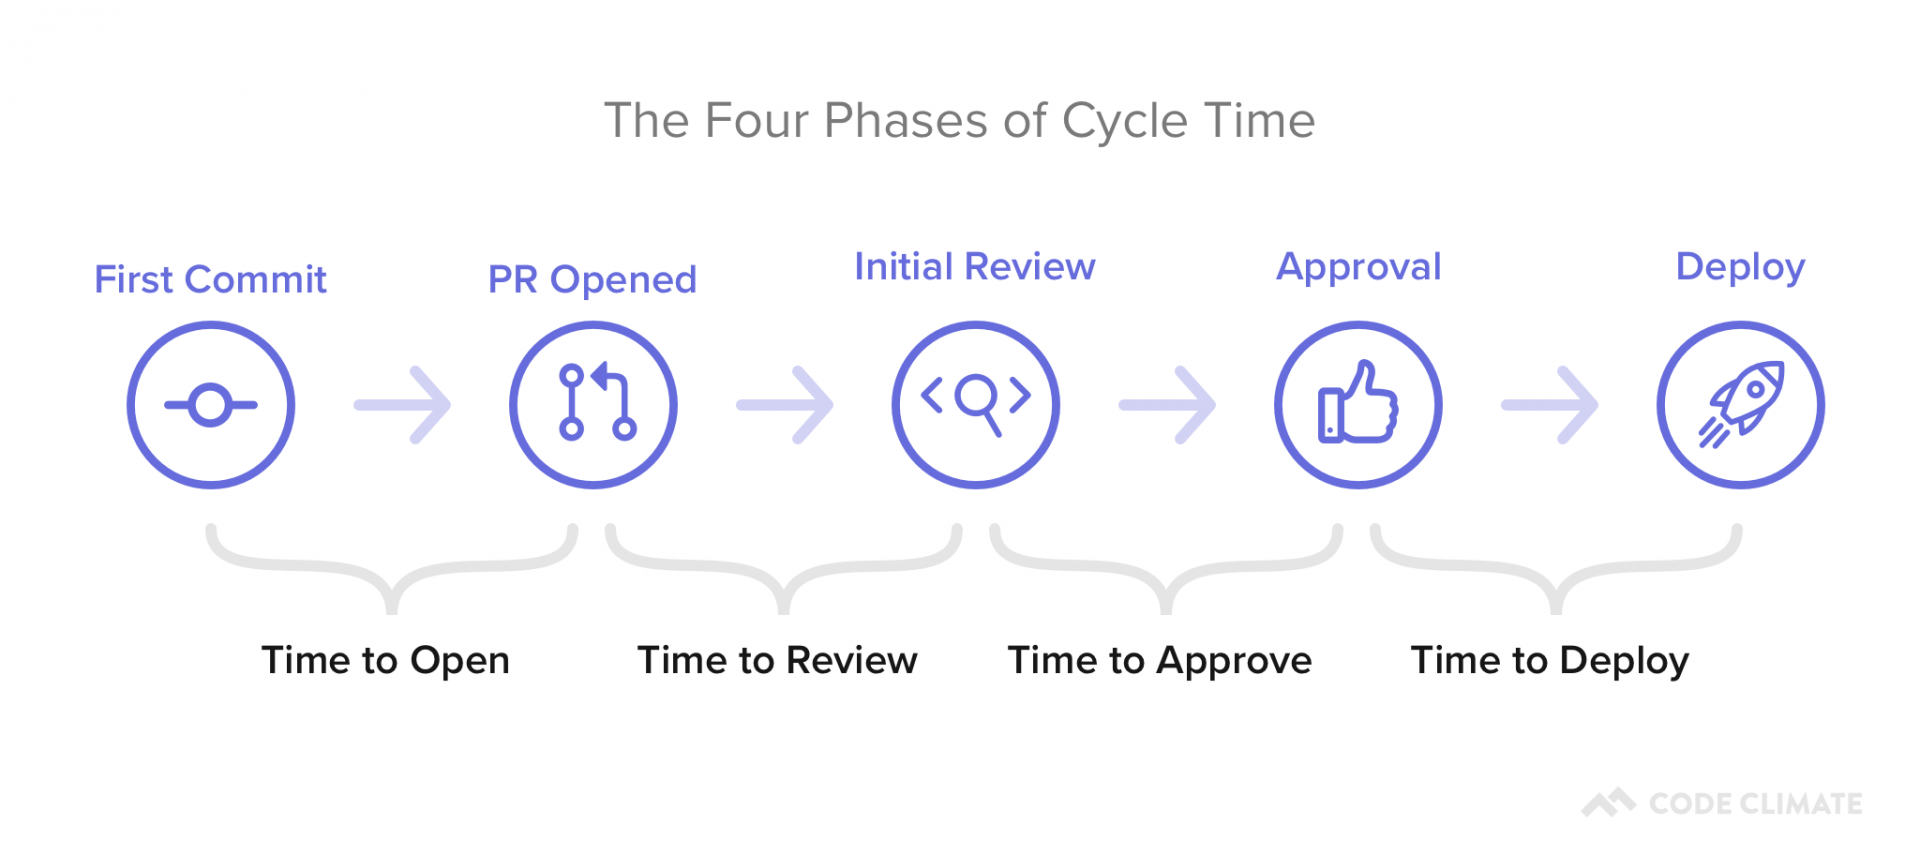
- Time to Open: The time between an engineer’s first commit and when they open a pull request in their version control system. Our data shows that this metric has the highest correlation with Cycle Time, so this is a great place to start optimizing.
- Time to Review: The time between when a pull request is opened and when it receives its first review. Delays at this stage incentivize multi-tasking, so you’ll want to minimize the time a PR is left waiting for review.
- Time to Approve: The time between when a pull request receives its first review and when it is approved, also known as the Code Review process. You don’t want to completely minimize the time spent in this phase, but you do want to make sure you reduce inefficiencies while still getting the value on Code Review you anticipate.
- Time to Deploy: Any additional time following the pull request approval, before the change reaches production.
You can plot these metrics side-by-side and look at them in terms of hours or percentage of time spent, so you know what your team’s starting point is before optimizing.
We recommend working on each phase from left to right because inefficiencies tend to compound from earlier stages. When a very large pull request is opened, it also affects how long it’ll wait for review and how likely it is to get stuck in the code review process. Start with Time to Open to ensure your team has streamlined individual practices before moving on to collaborative ones.
What’s Next
The next four parts of our series will dive deep into each component of Cycle Time:
- Part I: The Virtuous Circle of Software Delivery
- Part II: The Single Greatest Lever in Shortening Cycle Time
- Part III: How to Stop Code Review from Bottlenecking Shipping
- Part IV: Keep Code Review from Being a Waste of Everyone’s Time
- Part V: The Last Mile to True Continuous Delivery
We’ll include industry benchmarks, based off our analysis of 500+ engineering teams’ data, further data points to investigate, and tactical advice on how to improve each stage.
Stay tuned– or, if you can’t wait, request a demo of Velocity, our Software Engineering Intelligence platform, and have a data specialist guide you through each step.
Get articles like this in your inbox.
Trending from Code Climate
1.
Engineering Leaders Share Thoughts on Leadership in Disrupted Times in a New Survey
For engineering teams, disruption to the business can have a significant impact on the ability to deliver and meet goals. These disruptions are often a result of reprioritization and budget changes on an organizational level, and are amplified during times of transition or economic instability.

2.
Built In’s 2023 Best Places to Work — Why Code Climate Made the List
At Code Climate, we value collaboration and growth, and strive for greatness within our product and workplace. For us, this means fostering a supportive, challenging, people-first culture. Thanks to an emphasis on these values, we’ve earned spots on three of Built In’s 2023 Best Places to Work awards lists, including New York City Best Startups to Work For, New York City Best Places to Work, and U.S. Best Startups to Work For.

3.
Turnkey Deployment Delivers Day-One Value for Yottaa
Learn how Yottaa gained immediate value from Code Climate Velocity right out of the box.

Get articles like this in your inbox.
Get more articles just like these delivered straight to your inbox
Stay up to date on the latest insights for data-driven engineering leaders.