Resources & Insights
Featured Article
Navigating the world of software engineering or developer productivity insights can feel like trying to solve a complex puzzle, especially for large-scale organizations. It's one of those areas where having a cohesive strategy can make all the difference between success and frustration. Over the years, as I’ve worked with enterprise-level organizations, I’ve seen countless instances where a lack of strategy caused initiatives to fail or fizzle out.
In my latest webinar, I breakdown the key components engineering leaders need to consider when building an insights strategy.
Why a Strategy Matters
At the heart of every successful software engineering team is a drive for three things:
- A culture of continuous improvement
- The ability to move from idea to impact quickly, frequently, and with confidence
- A software organization delivering meaningful value
These goals sound simple enough, but in reality, achieving them requires more than just wishing for better performance. It takes data, action, and, most importantly, a cultural shift. And here's the catch: those three things don't come together by accident.
In my experience, whenever a large-scale change fails, there's one common denominator: a lack of a cohesive strategy. Every time I’ve witnessed a failed attempt at implementing new technology or making a big shift, the missing piece was always that strategic foundation. Without a clear, aligned strategy, you're not just wasting resources—you’re creating frustration across the entire organization.
Sign up for a free, expert-led insights strategy workshop for your enterprise org.
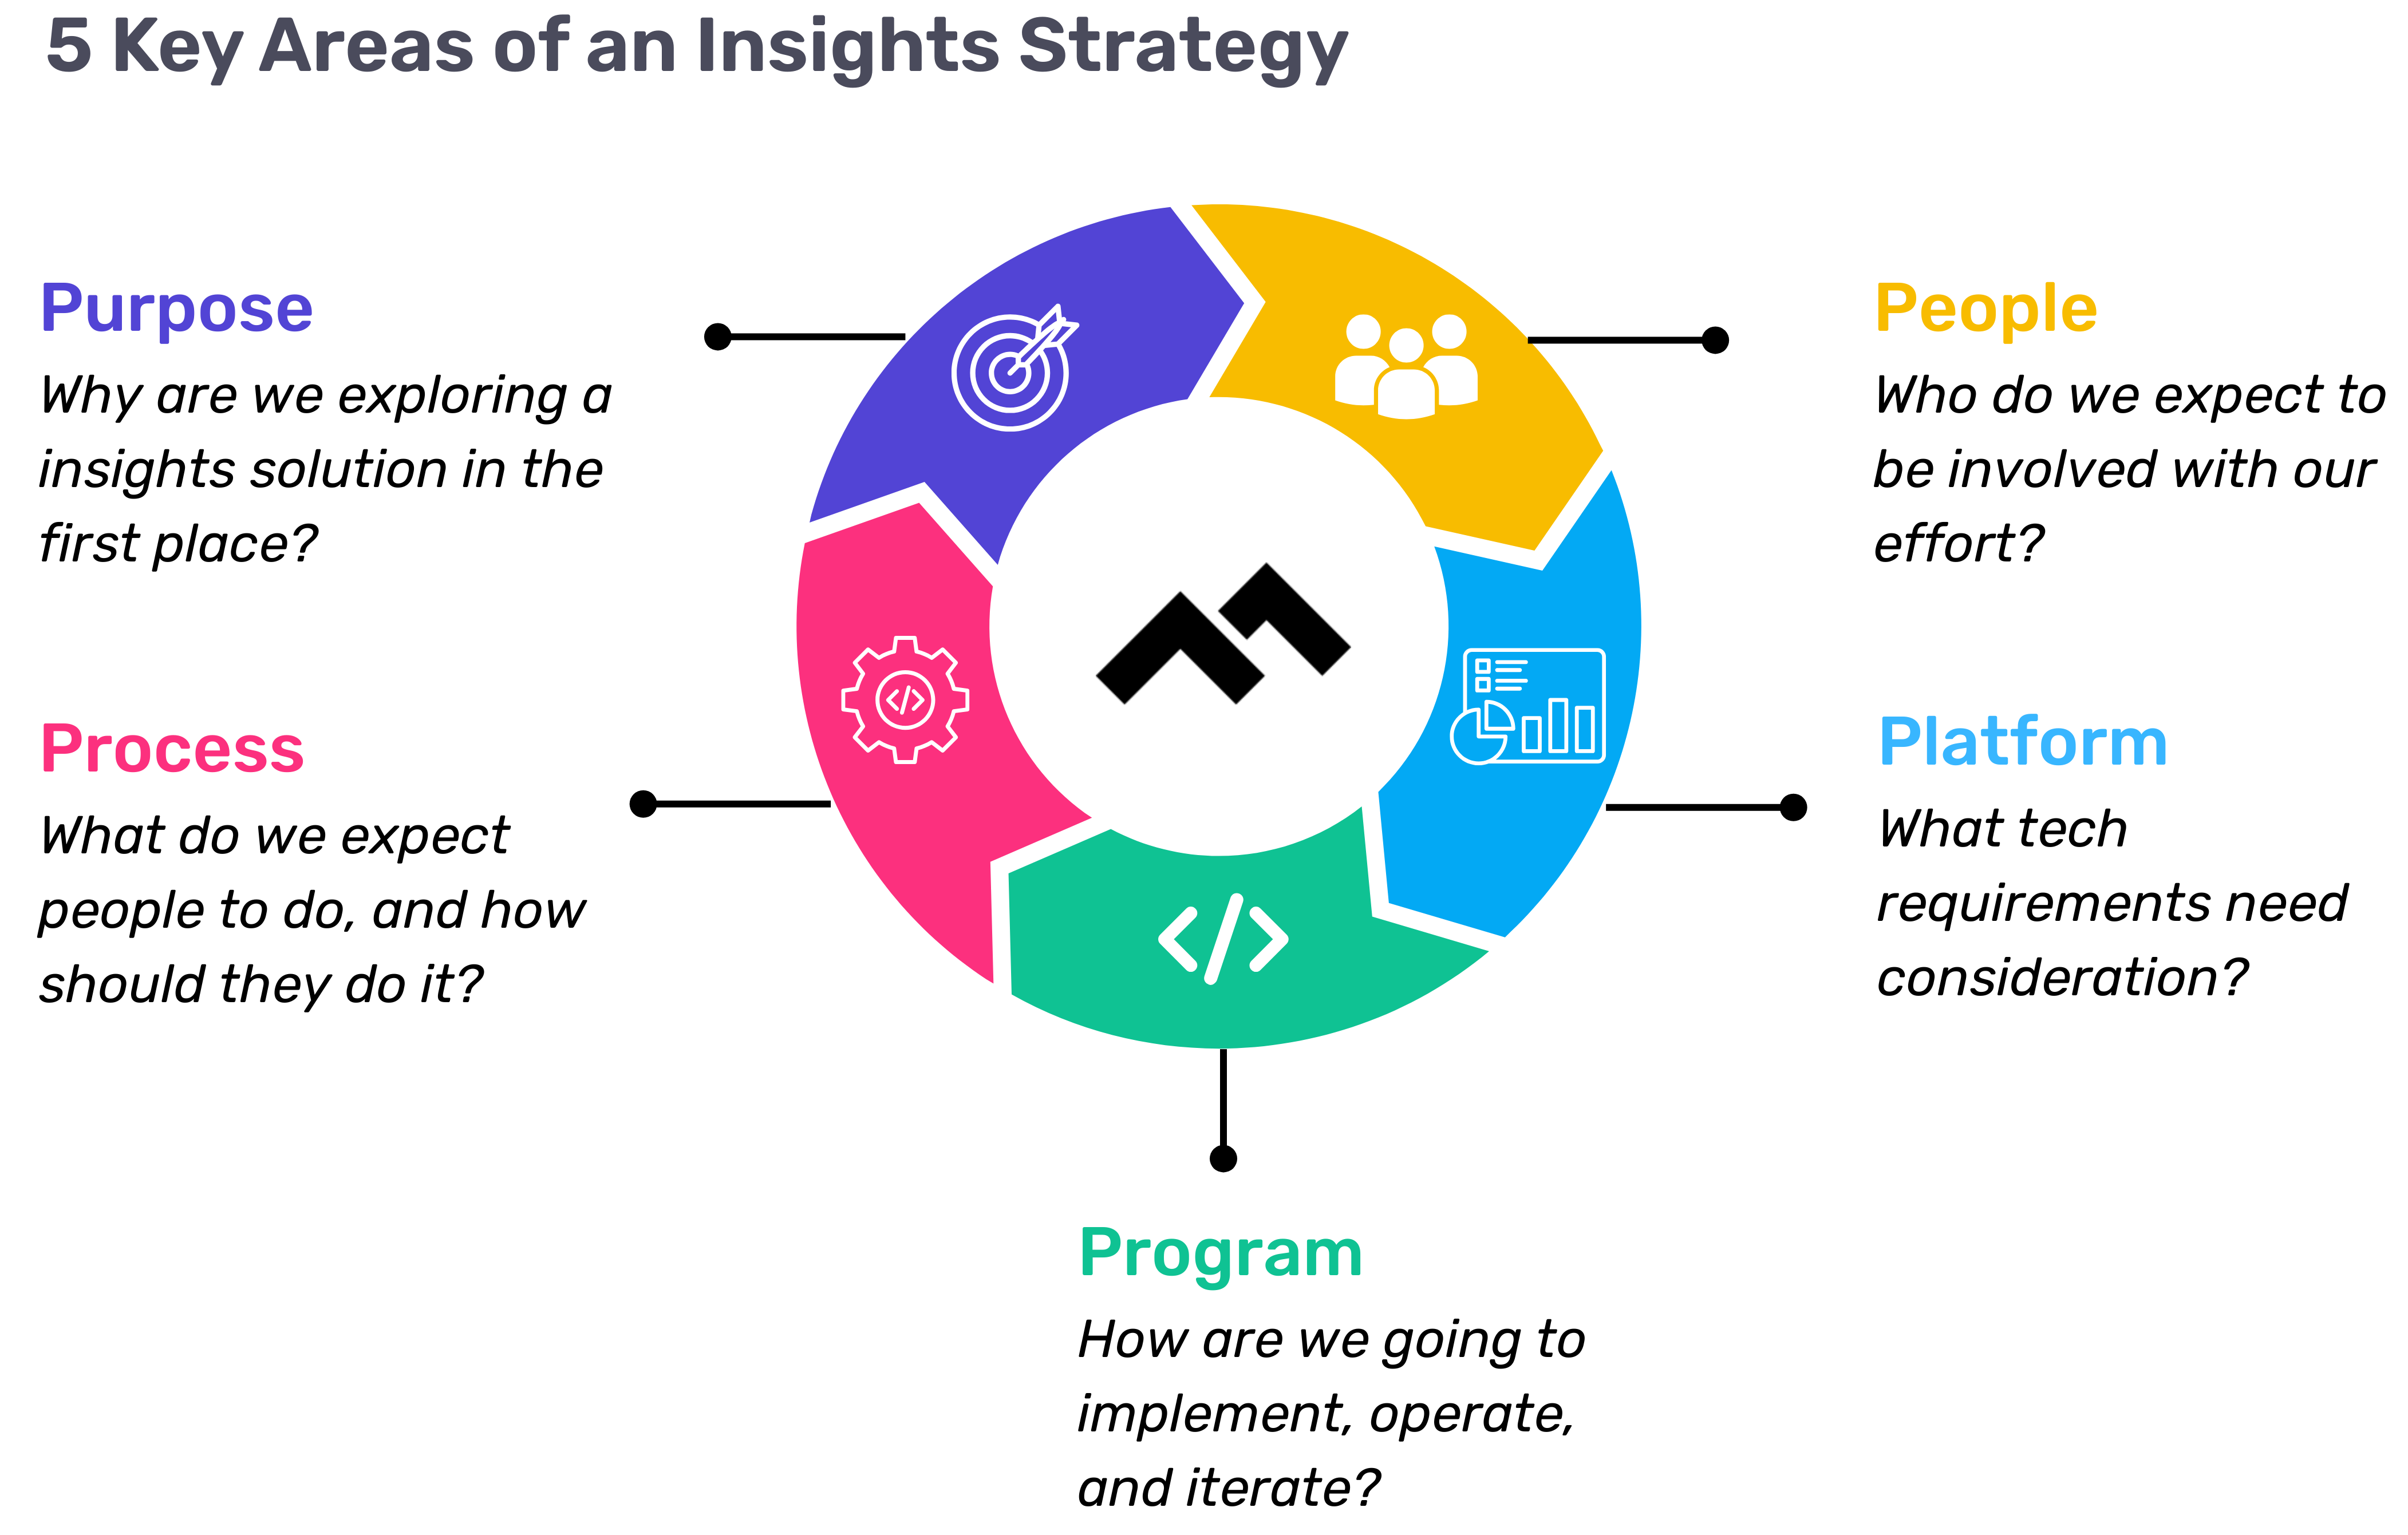
Step 1: Define Your Purpose
The first step in any successful engineering insights strategy is defining why you're doing this in the first place. If you're rolling out developer productivity metrics or an insights platform, you need to make sure there’s alignment on the purpose across the board.
Too often, organizations dive into this journey without answering the crucial question: Why do we need this data? If you ask five different leaders in your organization, are you going to get five answers, or will they all point to the same objective? If you can’t answer this clearly, you risk chasing a vague, unhelpful path.
One way I recommend approaching this is through the "Five Whys" technique. Ask why you're doing this, and then keep asking "why" until you get to the core of the problem. For example, if your initial answer is, “We need engineering metrics,” ask why. The next answer might be, “Because we're missing deliverables.” Keep going until you identify the true purpose behind the initiative. Understanding that purpose helps avoid unnecessary distractions and lets you focus on solving the real issue.
Step 2: Understand Your People
Once the purpose is clear, the next step is to think about who will be involved in this journey. You have to consider the following:
- Who will be using the developer productivity tool/insights platform?
- Are these hands-on developers or executives looking for high-level insights?
- Who else in the organization might need access to the data, like finance or operations teams?
It’s also crucial to account for organizational changes. Reorgs are common in the enterprise world, and as your organization evolves, so too must your insights platform. If the people responsible for the platform’s maintenance change, who will ensure the data remains relevant to the new structure? Too often, teams stop using insights platforms because the data no longer reflects the current state of the organization. You need to have the right people in place to ensure continuous alignment and relevance.
Step 3: Define Your Process
The next key component is process—a step that many organizations overlook. It's easy to say, "We have the data now," but then what happens? What do you expect people to do with the data once it’s available? And how do you track if those actions are leading to improvement?
A common mistake I see is organizations focusing on metrics without a clear action plan. Instead of just looking at a metric like PR cycle times, the goal should be to first identify the problem you're trying to solve. If the problem is poor code quality, then improving the review cycle times might help, but only because it’s part of a larger process of improving quality, not just for the sake of improving the metric.
It’s also essential to approach this with an experimentation mindset. For example, start by identifying an area for improvement, make a hypothesis about how to improve it, then test it and use engineering insights data to see if your hypothesis is correct. Starting with a metric and trying to manipulate it is a quick way to lose sight of your larger purpose.
Step 4: Program and Rollout Strategy
The next piece of the puzzle is your program and rollout strategy. It’s easy to roll out an engineering insights platform and expect people to just log in and start using it, but that’s not enough. You need to think about how you'll introduce this new tool to the various stakeholders across different teams and business units.
The key here is to design a value loop within a smaller team or department first. Get a team to go through the full cycle of seeing the insights, taking action, and then quantifying the impact of that action. Once you've done this on a smaller scale, you can share success stories and roll it out more broadly across the organization. It’s not about whether people are logging into the platform—it’s about whether they’re driving meaningful change based on the insights.
Step 5: Choose Your Platform Wisely
And finally, we come to the platform itself. It’s the shiny object that many organizations focus on first, but as I’ve said before, it’s the last piece of the puzzle, not the first. Engineering insights platforms like Code Climate are powerful tools, but they can’t solve the problem of a poorly defined strategy.
I’ve seen organizations spend months evaluating these platforms, only to realize they didn't even know what they needed. One company in the telecom industry realized that no available platform suited their needs, so they chose to build their own. The key takeaway here is that your platform should align with your strategy—not the other way around. You should understand your purpose, people, and process before you even begin evaluating platforms.
Looking Ahead
To build a successful engineering insights strategy, you need to go beyond just installing a tool. An insights platform can only work if it’s supported by a clear purpose, the right people, a well-defined process, and a program that rolls it out effectively. The combination of these elements will ensure that your insights platform isn’t just a dashboard—it becomes a powerful driver of change and improvement in your organization.
Remember, a successful software engineering insights strategy isn’t just about the tool. It’s about building a culture of data-driven decision-making, fostering continuous improvement, and aligning all your teams toward achieving business outcomes. When you get that right, the value of engineering insights becomes clear.
Want to build a tailored engineering insights strategy for your enterprise organization? Get expert recommendations at our free insights strategy workshop. Register here.Register here.
Andrew Gassen has guided Fortune 500 companies and large government agencies through complex digital transformations. He specializes in embedding data-driven, experiment-led approaches within enterprise environments, helping organizations build a culture of continuous improvement and thrive in a rapidly evolving world.
Navigating the world of software engineering or developer productivity insights can feel like trying to solve a complex puzzle, especially for large-scale organizations. It's one of those areas where having a cohesive strategy can make all the difference between success and frustration. Over the years, as I’ve worked with enterprise-level organizations, I’ve seen countless instances where a lack of strategy caused initiatives to fail or fizzle out.
In my latest webinar, I breakdown the key components engineering leaders need to consider when building an insights strategy.
Why a Strategy Matters
At the heart of every successful software engineering team is a drive for three things:
- A culture of continuous improvement
- The ability to move from idea to impact quickly, frequently, and with confidence
- A software organization delivering meaningful value
These goals sound simple enough, but in reality, achieving them requires more than just wishing for better performance. It takes data, action, and, most importantly, a cultural shift. And here's the catch: those three things don't come together by accident.
In my experience, whenever a large-scale change fails, there's one common denominator: a lack of a cohesive strategy. Every time I’ve witnessed a failed attempt at implementing new technology or making a big shift, the missing piece was always that strategic foundation. Without a clear, aligned strategy, you're not just wasting resources—you’re creating frustration across the entire organization.
Sign up for a free, expert-led insights strategy workshop for your enterprise org.
Step 1: Define Your Purpose
The first step in any successful engineering insights strategy is defining why you're doing this in the first place. If you're rolling out developer productivity metrics or an insights platform, you need to make sure there’s alignment on the purpose across the board.
Too often, organizations dive into this journey without answering the crucial question: Why do we need this data? If you ask five different leaders in your organization, are you going to get five answers, or will they all point to the same objective? If you can’t answer this clearly, you risk chasing a vague, unhelpful path.
One way I recommend approaching this is through the "Five Whys" technique. Ask why you're doing this, and then keep asking "why" until you get to the core of the problem. For example, if your initial answer is, “We need engineering metrics,” ask why. The next answer might be, “Because we're missing deliverables.” Keep going until you identify the true purpose behind the initiative. Understanding that purpose helps avoid unnecessary distractions and lets you focus on solving the real issue.
Step 2: Understand Your People
Once the purpose is clear, the next step is to think about who will be involved in this journey. You have to consider the following:
- Who will be using the developer productivity tool/insights platform?
- Are these hands-on developers or executives looking for high-level insights?
- Who else in the organization might need access to the data, like finance or operations teams?
It’s also crucial to account for organizational changes. Reorgs are common in the enterprise world, and as your organization evolves, so too must your insights platform. If the people responsible for the platform’s maintenance change, who will ensure the data remains relevant to the new structure? Too often, teams stop using insights platforms because the data no longer reflects the current state of the organization. You need to have the right people in place to ensure continuous alignment and relevance.
Step 3: Define Your Process
The next key component is process—a step that many organizations overlook. It's easy to say, "We have the data now," but then what happens? What do you expect people to do with the data once it’s available? And how do you track if those actions are leading to improvement?
A common mistake I see is organizations focusing on metrics without a clear action plan. Instead of just looking at a metric like PR cycle times, the goal should be to first identify the problem you're trying to solve. If the problem is poor code quality, then improving the review cycle times might help, but only because it’s part of a larger process of improving quality, not just for the sake of improving the metric.
It’s also essential to approach this with an experimentation mindset. For example, start by identifying an area for improvement, make a hypothesis about how to improve it, then test it and use engineering insights data to see if your hypothesis is correct. Starting with a metric and trying to manipulate it is a quick way to lose sight of your larger purpose.
Step 4: Program and Rollout Strategy
The next piece of the puzzle is your program and rollout strategy. It’s easy to roll out an engineering insights platform and expect people to just log in and start using it, but that’s not enough. You need to think about how you'll introduce this new tool to the various stakeholders across different teams and business units.
The key here is to design a value loop within a smaller team or department first. Get a team to go through the full cycle of seeing the insights, taking action, and then quantifying the impact of that action. Once you've done this on a smaller scale, you can share success stories and roll it out more broadly across the organization. It’s not about whether people are logging into the platform—it’s about whether they’re driving meaningful change based on the insights.
Step 5: Choose Your Platform Wisely
And finally, we come to the platform itself. It’s the shiny object that many organizations focus on first, but as I’ve said before, it’s the last piece of the puzzle, not the first. Engineering insights platforms like Code Climate are powerful tools, but they can’t solve the problem of a poorly defined strategy.
I’ve seen organizations spend months evaluating these platforms, only to realize they didn't even know what they needed. One company in the telecom industry realized that no available platform suited their needs, so they chose to build their own. The key takeaway here is that your platform should align with your strategy—not the other way around. You should understand your purpose, people, and process before you even begin evaluating platforms.
Looking Ahead
To build a successful engineering insights strategy, you need to go beyond just installing a tool. An insights platform can only work if it’s supported by a clear purpose, the right people, a well-defined process, and a program that rolls it out effectively. The combination of these elements will ensure that your insights platform isn’t just a dashboard—it becomes a powerful driver of change and improvement in your organization.
Remember, a successful software engineering insights strategy isn’t just about the tool. It’s about building a culture of data-driven decision-making, fostering continuous improvement, and aligning all your teams toward achieving business outcomes. When you get that right, the value of engineering insights becomes clear.
Want to build a tailored engineering insights strategy for your enterprise organization? Get expert recommendations at our free insights strategy workshop. Register here.Register here.
Andrew Gassen has guided Fortune 500 companies and large government agencies through complex digital transformations. He specializes in embedding data-driven, experiment-led approaches within enterprise environments, helping organizations build a culture of continuous improvement and thrive in a rapidly evolving world.
All Articles

In our new series, Code Climate is speaking with customers who use Velocity, our Engineering Intelligence platform.
In this customer interview, we talked to Santiago García, CTO and Co-Founder at La Haus. Santiago shared how using Velocity metrics helped him gain visibility into La Haus’s engineering processes and drive improvements.
Hillary Nussbaum, Code Climate: Tell me a bit about La Haus and your role there.
Santiago García, Co-founder & CTO, La Haus: We are transforming the real estate market in Latin America. It’s a very informal market, it’s a very broken market. So what we are trying to do is to build something that takes everything and puts it together, to transform the industry with technology, data, and good service. As CTO, I was also the first programmer at La Haus. And I had to move through all levels and phases of the company as we grew.
What I’m doing now is, I’m managing the technology of the whole organization. This includes our tech vision, and how we are going to build a world-class engineering team in Latin America.
How big is the team now?
We have 40 engineers.
And at what point did you bring in Velocity and metrics? I imagine when you were a really small team, you didn’t need them yet. At what point did you start to feel like they would be useful?
One year after I started the company, I saw that I had to have accountability. But at that moment, I was not sure how to measure. I started exploring tools.
Then one year ago, when COVID started, we went remote. I have trust with my team and I don’t measure them by lines of code or hours in seats. But I felt we were slow. I didn’t know why. I didn’t know for sure. It was a feeling. You can’t make decisions with a feeling.
So that was when I really decided to look for something.
When you did find Velocity, what was the first thing you did?
I just started to look at how the teams were doing. I started to see a lot of metrics that were going down after we went remote. This was like the first finding for me, where I could see that we really were slowing down.
I had done a lot of reading about Lean Software Development, I read Accelerate. I did a lot of research, and then I saw all of these metrics in the tool. So I understood what Cycle Time was and why it was important. I saw we were increasing, and then I had to communicate that to my team.
Every week we have knowledge-sharing sessions. So, when I scheduled this session, I spoke about Velocity and Cycle Time — how you measure a process, not people. And how you improve a process.
I said to the team, I’m going to start measuring the team just to measure the process and improve it. I’m not measuring individuals. So that was very, very transparent. And everyone was very open and happy and they were all asking me for their metrics and I said, “I’m not going to open these now, let me improve the process first, and then we can start exploring your metrics.”
So, do you share metrics with everybody now, or not yet? Are you still in that working it out phase?
I share them within teams, but not between teams, because metrics change depending on the team’s priorities.
The Team Lead shares the metrics with the engineers. We use the tools for 1 on 1s, and for personal improvement. We review each person’s dashboard with them, but we’re not going to fire someone because their Commits are too large, with too many lines of code. We don’t set a goal without a reason, otherwise everyone is going to optimize to reach that goal, and that goal isn’t the important thing.
What we do, is we go through “Oh, it would be better if you deploy fewer lines of code. I’m not going to measure this, but when you deploy fewer lines of code in a Commit, it can move through the review process more quickly.” That’s good for the process, and it’s good for us.
So, which metrics do you look at? What’s most important to you as a CTO? Or does it depend on the team?
For me as a CTO, I have OKRs. So one objective is maximizing quality without losing velocity. And then we have key results there. One is Cycle Time. You are giving value to the business and you are giving value to the user when you deploy quickly. So we have a goal that is based on a benchmark you gave us, and it feels natural for us. It’s less than 24 hours. When you receive a story and you have everything well-defined, then you can, from your first Commit to the final merge or the deploy to production, keep things under 24 hours.
And we use that metric like a health metric. You start noticing a lot of things when you don’t have that metric going well. We realized that some of our teams with high Cycle Time didn’t have well-defined user stories, and were struggling with unclear requirements. So we started improving user stories, and everything for that team has improved.
Do you ever bring metrics to the Chief Product Officer (CPO) and say, this is what’s happening and this is why we need to change course? When you had the issue with user stories and product requirements being unclear, would you actually bring them the metric and say, this is what’s happening and this is why we need your help?
Yes, it happened that time. First, when I saw we were going slower, I asked my team what was happening. And I saw there that the meeting processes, the ceremonies, how we had that configured, wasn’t working. So I met with our CPO, and I asked him to help me to build a whole design, development, and delivery process.
And we created a new process, and after we created this new process, everything was starting to improve. And you could see the change from the first day we started using this process. The next day we were 20% better in the push metrics, impact metrics. And then after some time we were doubling the productivity we had before.
That’s awesome. What would you say for you has been the most important success you’ve had with Velocity?
It’s visibility. Visibility is very important because what you don’t measure you can’t improve. If you have visibility you can tell if your actions are working or not, and this helps you have a healthy process and to keep improving. For me, that’s actually delivering value, because you can improve your process and it makes you work faster at a higher quality, and that’s good for the business and it’s good for the customers.
Do you have any data on your biggest improvement? I know you said that you doubled productivity. Was there anything else, like, can you speak to how much faster your Cycle Time was, or anything like that?
We had a Cycle Time of 72 hours and we went to 30 hours. So that’s around a 200% improvement.
Would you recommend Velocity?
It’s very difficult to make decisions without knowing what is going to happen. And when you are not measuring something, you feel very insecure to make changes. With a tool you can go on and analyze and see, okay, this is why this is happening. And you can make better decisions. Even if you’re wrong and you make mistakes, you’ll have an easier time seeing what happened and how to fix it. That’s why you need metrics.
To find out how metrics can help your team boost their productivity, reach out to our Velocity product specialists.

In this free, 45-minute webinar for CTOs, VPs, and managers of managers, we explain how an engineering analytics tool like Velocity can help every member of your team excel — whether they’re a new hire or an emerging leader.
- Code Climate Engineering Data Specialist, Sherianne Bolling, walks through the Velocity metrics and reports you need to scale your team while empowering ICs and managers to level up.
- CTO of Greenlight, James Gaythwaite, discusses how Velocity metrics are helping him lead his team through a period of hyper growth. With Velocity, he is able to:
- Support new hires struggling to get up to speed
- Identify high performers and give them opportunities to grow into leaders
- Empower managers to improve team processes and become more effective coaches
To find out how Velocity can help you level up members of your team, reach out and talk to a product specialist.
The more engineers on your team, the harder it is to gain visibility. If you’re managing four people or more, you’re probably asking questions like:
- How do I supervise the work of all of these engineers?
- How do I make sure I’m adding value where needed?
You can leverage Velocity to address both of these concerns.
Get Immediate Visibility into Your Engineers’ Work
A quick scan of the Activity tab in the Team360 report will give you a sense of both what your team is working on right now and their general work habits.
Hover over a purple circle to see your team’s commits and understand what they’re working on without having to tap them on the shoulder.
Look for:
- Developers who haven’t committed code for a few days. They might be bottlenecked, especially if they’re new to the team.
- Developers whose commits don’t match your expectations for what the team is working on.
- Big commits and PRs (visualized by the largest shapes on the graph).
- Work that is distributed in a way that doesn’t match your expectations.
Use this concrete data as a jumping-off point for in-depth conversations with your team.
Identify High-Risk Pull Requests
Use the Pull Requests report to see PRs that may warrant your attention.
Most managers start by looking for open, high activity PRs. Activity is defined as PRs that are getting either a lot of commits or a lot of comments. To surface the oldest PRs, sort by age by clicking on the "Age" column within Pull Requests. Pay close attention to anything that’s been open for over 72 hours.
You might want to talk to someone like Harry Potter to see if there’s anything you can do to unblock him.
Understand Which Developers Might Need Help
There are a number of metrics that can help you find stuck engineers:
- Weekly Coding Days represents engineering capacity, or how much time per week developers are able to spend actually coding. When this metric dips, it’s an indicator that a team member might be (1) working in large chunks or (2) stuck on a feature or bug.
- PR Throughput & PRs Reviewed are output metrics. If these look unexpectedly low, it might be worth a quick conversation to understand what’s going on.
- Review Cycles & Rework are both proxies for churn. Review Cycles represent the number of times a Pull Request has gone back and forth between the author and reviewer. Rework is the percentage of lines of code that have been rewritten by the same developer within 3 weeks and is helpful for identifying churn earlier on in the development cycle.
Compare these metrics by team or by person in the Compare report to identify who is stuck.
Dive Deeper into Churn Metrics
High Review Cycles and high Rework represent waste in the development process and are therefore a great place to start optimizing.
A developer with high Review Cycles has been asked to go back and fix things in their PRs multiple times. If you see someone with higher than expected Review Cycles, you can investigate further by going into the Analytics tab.
Run a query for Review Cycles, grouped by contributor over the last week or two. Scroll to the bottom until you see the following bar graph visualization:
To understand what’s blocking specific engineers, like Hecate, you can click the arrow next to her Review Cycle count to drill down into specific PRs.
Sort the number of Review Cycles from high to low and look through the ones that have been open the longest. Anything above 1.5 Review Cycles may indicate a problem. In this case, the top two open PRs with 4 Review Cycles is a good place to start.
You can run this same process for Rework, which is another indicator of churn, but at the coding level. Note that the top quartile of engineering organizations keep their Rework to less than 4%.
Use Metrics to Enhance Visibility
Though metrics can’t tell managers everything they need to know, they can be a valuable tool for gaining insight into the work that’s happening on your team. With data like that found in Velocity, you can spot stuck work before it becomes a bottleneck, and make sure your team’s processes are effective.
If you’re not already using Velocity, speak to one of our specialists and find out how you can get a more complete picture of the work being done on your team.
Effective retrospectives are an important opportunity to provide guidance and invest in your team’s future. Though the discussions you have during retros will surface areas of friction or frustration, you may find that anecdotal evidence and gut feel don’t provide enough information. It can be hard to know how to help your team without a concrete means of gauging why developers are struggling (or succeeding).
Leverage data from a Software Engineering Intelligence platform likeVelocity, and you’ll be able to transform your retros into valuable opportunities for learning about team members and how they function within your engineering process. With this information, you’ll be able to run more effective retrospectives by offering relevant support, setting more specific goals, and ensuring your retro action items drive improvement.
Uncover Data-backed Insights
To get a sense for how your team is doing, use Velocity to determine if your engineers are trending up or down over time for the following PR-based metrics:
- Cycle Time, which indicates the time between when the first commit is authored and when a PR is merged. This metric can be used as your team’s speedometer. Aim for a Cycle Time of under 2 days.
- Time to Open, which is defined as the time between the earliest commit in a Pull Request and when the Pull Request is opened. Top-performing teams take less than half a day on average to open a PR.
- Review Cycles, or the number of times a Pull Request has gone back and forth between the author and reviewer. Note that keeping your average Review Cycles below 1.3 keeps your team in the top 50% of engineering organizations.
- Time to Merge, or the duration between when a Pull Request is opened and when it is merged.
Set Quantifiable Goals
To make your learning actionable, head to the Targets page, select your metric, and define a goal. In this case, we’ll aim to keep 90% of Code Reviews to one Cycle. When Review Cycles are high, it can mean one of three things:
- There are differing opinions about what “done” means.
- There’s misalignment around what kind of changes are expected to come out of the review process.
- There are conflicting ideas about how a solution should be implemented.
You can hover over the interactive column chart to see how often your team hit their goal. Selecting any week that didn’t meet an SLA will bring up a drill-down of all the underlying data points (commits, PRs, or reviews), so you can investigate the source of the issue.
In the above example, there are 12 PRs that you can dig into. Leverage this data to investigate places where your goals weren’t achieved and to offer guidance where necessary.
Data is Key to Driving Improvement with Effective Retrospectives
With the right data, you’ll be able to objectively assess your team’s progress and find concrete opportunities for advancement. Combine that with qualitative feedback from your team, and it’s possible to hold retros that effectively surface issues and point towards possible solutions.
Speak to one of our specialists about Velocity, and find out how data can help you drive progress on your engineering team.
When you discover the benefits of data-driven conversations, it’s likely you’ll want to invite your entire team to view all of their engineering metrics.
But an abundance of data can make it difficult to hone in on the most important trends, and data that’s lacking context is more likely to be misused or misinterpreted. That’s why we recommend rolling out Velocity gradually. Then, as your team becomes comfortable with the engineering metrics Velocity reveals, sharing more can become increasingly valuable.
What does a rollout look like?
Velocity is Software Engineering Intelligence platform, built to improve how teams make decisions. To that end, a “rollout” can be as simple as exposing your engineers to the metrics and dashboards through curated slides, or as involved as giving each team member access to the application.
Here are the different levels of exposure you can consider:
- Contextual exposure: Share what data you’re tracking and present relevant reports in meetings with teams and individuals.
- Scoped exposure: Share the Velocity reports you’d like and limit the data scope by team or by individual so that engineers only see the metrics that are most relevant to them.
- Full access: Provide engineers with access to all their own and their team member’s data.
Different teams have varying levels of trust and familiarity with engineering performance metrics, so the right exposure will differ team-to-team. Use the guidelines below to gut-check when and how to introduce each type of rollout.
Introducing the idea of data-driven engineering with contextual exposure
The Challenge: Engineers are naturally skeptical and concerned about engineering metrics, so it’ll be up to you to advocate for the data and engender a positive culture around analytics.
The Preparation: We recommend that you work with your CSM to concretely define problem statements and get to know the dashboards and metrics that will support your objectives before sharing the tool with your team.
For instance, your objective may be to decrease batch sizes in an effort to improve the efficiency of your Code Review process. In this case, your supporting metrics may be Pull Request Size, Time to Open, and Review Speed.
Move on to rollout if you can answer yes to all of these questions:
- Can you articulate the problems that Velocity data will help you better understand?
- Do you know how the metrics you’re tracking connect to the problems you’ve defined?
- Will you be able to defend and explain these metrics to your team?
- Will your team feel confident that you’ll be using these metrics in a way that will benefit (not hurt) the team?
The Rollout: Introduce your problem statements and supporting metrics to your team. Have concrete examples of how you’re already working through a previously discussed problem using data.
Empowering engineers to own their success with scoped exposure
The Challenge: It’s one thing to periodically show org-wide metrics during team and individual meetings, but another to give engineers access to their own metrics. Even engineers who are interested in becoming more data-driven in theory can be wary of metrics when they’re frequently confronting their own dashboard.
The Preparation: To earn buy-in for limited use of Velocity, you’ll want to demonstrate how using data can help make 1:1s and retros more actionable. Use one of these meetings as an opportunity to find a concrete unit of work that represents an engineer’s experience or frustration. It can be helpful to involve a senior engineer earlier on, so they can pair what they know from experience with what is being surfaced in the data. Begin using Velocity to start conversations with real-world examples, so engineers can understand how data can be used to distinguish the signal through the noise.
Move on to rollout if you can answer yes to all of these questions:
- Can you correlate the experience of developers to specific PRs that Velocity is highlighting?
- Do you have a senior engineer who can advocate for the positive intention with which Velocity will be used?
- Do you have a sense of which metrics will be improved should you work through the identified challenges?
The Rollout: Work with your CSM to set up data scopes to display the appropriate reports and metrics for each engineer. At the end of your next retrospective, demo the Velocity product for your team. Encourage them to periodically view their dashboards and check in on key metrics at each retrospective so your team achieves the desired outcome.
Creating an autonomous team with full access
The Challenge: Introducing engineers to all of Velocity’s metrics means that not only does leadership have to interpret the metrics responsibly, but so does every single individual on the team. Exposing all of your metrics requires an extremely safe and trusting team environment.
The Preparation: First, you’ll want to show how setting quantifiable goals can benefit developers. Use a retrospective meeting to identify one significant problem they’re experiencing and work together to identify key metrics that will help work through the stated problem.
Move on to rollout if you can answer yes to all of these questions:
- Does your team have an identified problem that Velocity metrics will help work through?
- Have you identified both leading (health) metrics, and lagging (success) metrics for your stated problem?
- Can each team member explain why each metric was chosen in association with the stated problem?
- Do you have a hypothesis about what success looks like with these metrics?
The Rollout: Work with your CSM to set up data scopes to display all the reports and metrics for each engineer’s team. At the end of your next retrospective, demo the Velocity product for your team. Encourage them to periodically view their dashboards and check in on key metrics at each retrospective until the desired outcome is achieved.
Reach out to get started with Velocity, and find out how engineering metrics can help your team meet its goals.
One of the first and most essential uses of Velocity is to cut through the noise and help managers identify the signals of stuck engineers. This enables management to eliminate unnecessary check-ins, while still having the ability to unblock engineers and boost engineering productivity by stepping in to help an engineer who might hesitate to raise their hand.
Velocity provides visibility into:
- Who on your team is blocked
- Whose work has been churning
Look out for four main behavioral patterns in Velocity to help address these concerns.
Engineers Who Haven’t Committed for a Long Time
A quick scan of the Activity tab will help you identify developers who aren’t checking in code.
Head into the Team360 report, select the Activity tab, and look for team members with few or no commits, represented as purple circles.
In the example above, Hecate hasn’t committed in a couple of days. This could indicate that she is:
- Working on a large chunk of work locally
- Stuck for whatever reason
- Tied up in non-engineering related projects
If you see a similar work pattern in your team’s Activity Log, you might want to check in to identify the bottleneck and help your developer get back on track.
Engineers Who Are Committing but Churning
Any developers who are committing, but not opening PRs, might be churning. Once again, go to the Activity tab in the Team360 report to see which engineers’ work appears to be blocked.
As noted in the key, Commits and Merged Commits are indicated by dark and light purple circles respectively and open PRs by light blue diamonds. You’ll want to look out for clusters with a high count of circles and a missing count of diamonds.
As you can see in the top row, Donalbain has been consistently committing code, but not opening any PRs.
This could be because he is:
- Committing a lot then planning to open one big PR (which isn’t ideal)
- Committing something, then redoing the work he just did for some reason
- Committing something, then heading off in a different direction and starting a new track of work
Take this opportunity to dive in and identify the issue.
Engineers Who Have Long-running PRs
Long-running PRs may indicate that an engineer is stuck on that particular unit of work, or that they’re multi-tasking, causing delays for multiple PRs.
Investigate all open and active PRs in the Pull Requests report. (Note that if you look at this report in the morning, it might look bare, since it automatically shows “today’s” activity. In this case, use the date picker to extend to yesterday, or the past two days to see what’s in progress).
To surface the oldest PRs, sort by age by clicking on the “AGE” header. Pay close attention to anything that’s been open for over 72 hours.
A PR might be long-running because:
- An engineer is having trouble with this PR and keeps adding on commits.
- It’s unclear whether this PR is done.
- An engineer’s PR hasn’t been picked up for review, either because it was overlooked or because it’s perceived as complex.
- An engineer is blocked on another third party.
Engineers Whose Work is Stuck in the Review Process
Finally, the Analytics tab is a good place to go to identify late-stage churn. You’ll want to run a query for Review Cycles, or the number of times a Pull Request has gone back and forth between the author and reviewer.
To obtain this report, select Review Cycles as your metric, and group by contributor. Run a query for the last week or two, and scroll to the bottom until you see the following bar graph visualization:
When Review Cycles are high, it may indicate:
- There are differing opinions about what “done” means.
- There’s misalignment around what kind of changes are expected to come out of the review process.
- There are conflicting ideas about how a solution should be implemented.
Boost Your Own Engineering Productivity with Data
With the right data, you can identify which of your team members are stuck right now, so you can help remove the roadblock and get things moving again.
If you want to boost engineering productivity, but don’t have a way to track and analyze your engineering metrics, reach out to find out more about our Software Engineering Intelligence platform, Velocity.

The following is a guest post from Cassiopeia (now part of the cloud-based HR solution, HiBob), a SaaS solution that uses communication data to provide remote managers and team leaders with actionable insights regarding team dynamics, collaboration, and work-life wellness.
As distributed teams become the rule rather than the exception, managers and engineers are finding clear communication to be one of their biggest remote work challenges.
Remote work requires extra communication — as remote teams, we’re missing out on all the overheard discussions, cubicle wall meetings, and spontaneous brainstorms over lunch. For engineering teams, a lack of clear communication patterns means there’s greater risk that engineers will change and break code, overlap, and/or waste time doing unnecessary synchronous tasks.
Engineering teams could fall into unhealthy distributed work patterns if managers don’t set clear communication processes and structures. Managers can also help foster a more inclusive remote working experience by focusing on finding solutions for the communication hiccups within their distributed team.
The key to effective remote communication is to be much more intentional about how we communicate, when, and how often.
Here are a few tips that can help you optimize your communication while working remotely:
1. Set clear priorities and agendas. Whether in daily stand-ups or weekly team-wide meetings, be sure to set priorities for the week for all members of your team, so everyone is on the same page. As the team gets bigger and each individual starts working on multiple aspects of a product, this added context will make it easier for developers to switch off with other members of the team. In an office setting, you would be able to walk over and review someone’s code with them, but things are different virtually. If managers set clear agendas and priorities for their entire team, it creates more transparency and a clearer direction.
2. Make space and create processes for knowledge sharing. The key to successful completion of engineering projects is an effective communication flow and smooth transition of intricate inter-dependencies. If something changes in one aspect of a project, it will likely impact another team member and their workflow. This is why regular communication, especially when working remotely, is recommended for engineering teams.
From our research we have found that one of the most effective ways for distributed engineers to work together on a task is by pair programming. Just sharing a screen enables devs to code anywhere, edit the same files, click through the same dev server, and share a virtual terminal shell for running tests and other commands. Managers should encourage members to participate in this type of knowledge sharing, and also design process maps that help set up performance benchmarks and metrics to measure success for each individual on the team.
Have your team explicitly talk about their priorities for the day in your daily standup calls, and encourage them to discuss things like who will ‘drive’ the pairing session (i.e. who will be actively coding), who will raise tickets, and who will review before the final sign-off. This will help create a more inclusive work environment and combat the feeling of isolation when working remotely.
3. Don’t skip the 1:1 meetings. In the Manager Tools podcast, host Mark Horstman calls 1:1 meetings, “the single most powerful thing we know a manager can do to improve their relationship with direct reports and get better results.” These 1:1 meetings go beyond an open door policy. They offer dedicated time for leaders to coach, mentor, and build a working relationship with their employees, and they can open the communication channels in a remote setting. If, as a manager, you’re tempted to skip the 1:1 because you just had a call with someone in a team setting, stop and reflect on the importance of this one-on-one time. Remember, this meeting isn’t a performance review. A 1:1 is time for you to ask questions, listen to your employees, and coach where necessary. We suggest starting the meeting with, “how’s everything going?” or, “how’s it been working on xyz project so far?”
4. Over-communicate and use external tools to stay on top of things. Remote engineering teams often work asynchronously because they’re not in the same place. CEO of Remote Job van der Voort’s biggest recommendation is to over-communicate. “Remote team leads should always be writing more, saying more, the usual FYIs that you wouldn’t necessarily mention when you’re in an office space…mention them out loud in a remote workspace.”
3 tools that can add value to a remote workplace:
- A shared calendar: Remote managers should be transparent regarding where (and with whom) their time is being spent. This information should be made available to their entire team for the purpose of trust-building.
- Video conferencing: Research shows that remote employees tend to be more distracted in audio-only calls, but more alert and productive when their video is on. We recommend using Zoom, Slack Video, Teams, or any other video conferencing tool for calls that include more people, like company-wide meetings and team catch-ups.
- Project Management tool: Use a software like Jira or Trello to reflect on tasks and projects that members of the team are working on, and to monitor progress.
5. Communicate a clear Code Review process. Derek Parham was the former technical lead of Google Apps, where he scaled a team from one employee to over 100 in six years, and helped set up multiple processes that have contributed to better communication within the engineering team. “Google Marketplace was one of our first early remote teams, so there were a bunch of communication breakdowns. The design review process helped with that because we only spent a couple of weeks going back and forth instead of building a system for six months and then launching it only to realize it wouldn’t work, or would break a bunch of other things, or didn’t meet people’s expectations.”
He continues, “It’s okay to have that time crunch in the beginning when you’re writing the code and doing the review, because as soon as you launch the product, everyone knows what is going to be built.” Having a clear review process from the start can help engineering teams avoid many future issues.
6. Use a data-driven approach to increase visibility within the team and improve communication. When you’re working with a virtual engineering setup, it can be a lot harder to gain visibility on your teams. But it is possible. Engineering and other technical teams actually generate a lot of data about their communication patterns on a daily basis. It’s important for managers to aggregate and analyze this data and extract useful insights to improve the way team members communicate and work together. By doing so, managers can get a much clearer picture of how direct reports are communicating and collaborating. For all you know, that quiet engineer may be contributing much more than you thought.
At Cassiopeia, we use communication patterns and related tracking metrics to help managers gain visibility and spot communication issues in a timely manner. Managers can track if and when there are any collaboration issues between or within teams, or spot people who might be feeling less connected, all by tracking communication metrics.
7. Set daily ‘focus time’ for the team. When you’re working in a distributed team, it’s easy to get drawn into conversations on Slack or Teams with colleagues. The idea behind ‘focus time’ is to allow for dedicated work time, free from interruption and chatter. As a manager, setting daily focus time explicitly allows people to tune out group communication, and that’s an empowering move.
How does this work? Ask your team to turn off their Slack and Teams and work independently for set hours, either daily or weekly. This prevents team members (and managers) from having to keep one eye on their Slack channels. Quiet hours can be set based either on time zones, individual schedules, or personal preferences. Some managers also choose to have no-meeting days, which can produce similar results.
Despite the challenges, remote work can be very rewarding for organizations across the globe. With proper communication practices, the right tools, and a supportive work culture, distributed workforces can overcome common challenges and build more effective software and technical teams.
Cassiopeia is a SaaS solution that uses communication data to provide remote managers and team leaders with actionable insights to help improve team dynamics, collaboration, and work-life wellness.
The authors of Accelerate surveyed over 23,000 individuals in 2,000 distinct software companies to uncover the methodologies that set top-performing organizations apart. Their research suggests that “speed and stability are outcomes that enable each other” and that any software organization can measure and improve these outcomes.
The Continuous Delivery (CD) best practices they recommend, such as keeping batch size small, automating repetitive tasks and investing in quick issue detection, all perpetuate speed and quality while instilling a culture of continuous improvement on the team.
While most of the industry is actively adopting CD, few have set up any way to measure their progress. Concrete metrics, such as those found within Velocity, are a prerequisite to ensuring success in this transition.
In this guide, we’ve outlined how you can use Velocity to answer:
- How effectively is my team adopting CD practices?
- What’s hindering faster adoption?
Measure Improvement to Shipping Speed and Throughput
There are two success metrics that can represent how “continuously” your organization is shipping: speed (Cycle Time), and throughput (Pull Requests Merged or Deploy Volume).
Start by looking at the Analytics report to see how well you’ve been improving on one of those metrics. We recommend looking back at least 90 days.
Cycle Time, or the time between an engineer’s first commit to merging to production, should be trending down. Good coding habits, such as working in small batches, should keep changesets moving through the process with little friction, while CI/CD tooling should automate a lot of late engineering or QA work that frequently blocks merging to production.
Here’s how you can read this trend:
- Decreasing means you’re moving in the right direction. You’ve already adopted some Continuous Delivery best practices that have unblocked engineers and enabled them to move a single work in progress through the pipeline as quickly as possible.
- Flat is what you’d expect when you’re not in a state of transition. Typically, teams hit a local maximum with process efficiency when they’ve optimized as much as they can. If you’re in the middle of transitioning to CD, however, a flat Cycle Time is a bad thing. It means that even if you’ve changed some of the tooling or the messaging around how to ship software, this has not had the intended effect.
- Spiky indicates inconsistencies, and that your process is not delivering predictable results. You’ll want to take a closer look at days or weeks with particularly high Cycle Times to diagnose why work is getting stuck.
- Increasing is not a state you want to be in for a prolonged period of time, but can be normal during change management, as your team learns new practices and transitions to new tooling.
Alternatively, you can use Pull Requests Merged or Deploys as your yardstick. In this case, you can invert how you interpret results. Increasing throughput is desired, while flat and decreasing trends are a red flag that your team’s new practices are not yet yielding better outcomes.
Dive Into Key Health Metrics Team by Team
After understanding your overall engineering speed, you’ll want to investigate health metrics to find specific areas for improvement.
Velocity metrics can serve as strong proxies for the following Continuous Delivery practices:
- Good Coding Hygiene, which means working in small batch sets (PR size) and opening Pull Requests early (Time to Open).
- High Review Effectiveness, which means balancing review thoroughness (Review Coverage) and speed (Review Speed), while ensuring that comments lead to action (Review Influence).
- High Engineering Capacity, which means developers have enough time for engineering work (Weekly Coding Days).
In Velocity’s Compare report, you can look at these metrics across teams or for individuals to identify coaching opportunities or process improvements.
Click on a team to drill down and see performance on an individual basis:
Finally, get more context on a team or individual by seeing how they’ve performed on a specific metric, historically. The Analytics report lets you pick how far back you look and then drill down into any units of work that are dragging the average up or down.
Find the Biggest Opportunities for Improvement in Your Software Delivery Process
Now that you have all the context for how your team is working, create a mental model of your software delivery pipeline to see where a unit of work is most likely to get stuck. This will help you prioritize where you should start making optimizations.
We recommend breaking your process into three portions:
- Time to Open, or how long does development take.
- Review Speed, or how long does work sit before getting picked up for review.
- Time to Merge, or how long does the entire code review process take.
You can look at these three metrics side by side, by selecting them in the Analytics report and viewing them as bar graph clusters by week or by month.
With this data, you’ll be able to determine which area of your process is worth a closer look. If multiple stages need attention, we recommend starting with the one that comes earliest in your development pipeline, as improvements at early stages can have an impact downstream.
To dig into your own data and start measuring your progress towards Continuous Delivery, sign up for a demo of our Software Engineering Intelligence platform, Velocity.
“Don’t see management as a promotion, see it as a shift in role, and acknowledge that it will be a bit uncomfortable for you, and give yourself space to be okay with that.” – Smruti Patel, Engineering Manager at Stripe
Many engineering leaders move into management unprepared for precisely that reason — it requires a shift in mindset and a new set of skills. To ease that transition for new and aspiring managers, and to help seasoned managers level up, Code Climate and Codecademy for Business interviewed engineering leaders about the key components of leadership success. We spoke to VPs and Managers at companies like Netflix, Intuit, GitHub, and Stripe to find out about their most successful management strategies and the skills that they deem to be essential.
Their best advice is compiled in our ebook, How 10 Engineering Leaders Build High-Performance Teams.
Highlights include:
“Having leaders on your team that are not managers is actually very useful because for you as a manager, that means you don’t have to do everything…leadership by influence or suggestion is actually a lot more powerful.” – Mathias Meyer, Engineering Leadership Coach, www.paperplanes.de
“I start my management relationships with the foundation of trust, respect, and accountability. A powerful way to show trust and respect for your team is by welcoming everyone’s opinions, ideas and feedback.” – Alexandra Paredes, VP of Engineering at Code Climate
“Don’t pretend like you have all the answers. Do that figuring out in front of the team because it’ll make them trust you more, not less.” – Nitika Daga, Engineering Manager at Stitch Fix
Download it now for wisdom from:
- Tara Ellis, Manager, UI Engineering at Netflix
- Brooks Swinnerton, Senior Engineering Manager at GitHub
- Gergely Nemeth, Group Engineering Manager at Intuit
- Lena Reinhard, Vice President of Product Engineering at CircleCI
- Mathias Meyer, Engineering Leadership Coach, www.paperplanes.de
- Anchal Dube, Senior Engineering Manager at Zocdoc
- Andrew Heine, Engineering Manager at Figma
- Smruti Patel, Engineering Manager at Stripe
- Nitika Daga, Engineering Manager at Stitch Fix
- Alexandra Paredes, VP of Engineering at Code Climate