Resources & Insights
Featured Article
Navigating the world of software engineering or developer productivity insights can feel like trying to solve a complex puzzle, especially for large-scale organizations. It's one of those areas where having a cohesive strategy can make all the difference between success and frustration. Over the years, as I’ve worked with enterprise-level organizations, I’ve seen countless instances where a lack of strategy caused initiatives to fail or fizzle out.
In my latest webinar, I breakdown the key components engineering leaders need to consider when building an insights strategy.
Why a Strategy Matters
At the heart of every successful software engineering team is a drive for three things:
- A culture of continuous improvement
- The ability to move from idea to impact quickly, frequently, and with confidence
- A software organization delivering meaningful value
These goals sound simple enough, but in reality, achieving them requires more than just wishing for better performance. It takes data, action, and, most importantly, a cultural shift. And here's the catch: those three things don't come together by accident.
In my experience, whenever a large-scale change fails, there's one common denominator: a lack of a cohesive strategy. Every time I’ve witnessed a failed attempt at implementing new technology or making a big shift, the missing piece was always that strategic foundation. Without a clear, aligned strategy, you're not just wasting resources—you’re creating frustration across the entire organization.
Sign up for a free, expert-led insights strategy workshop for your enterprise org.
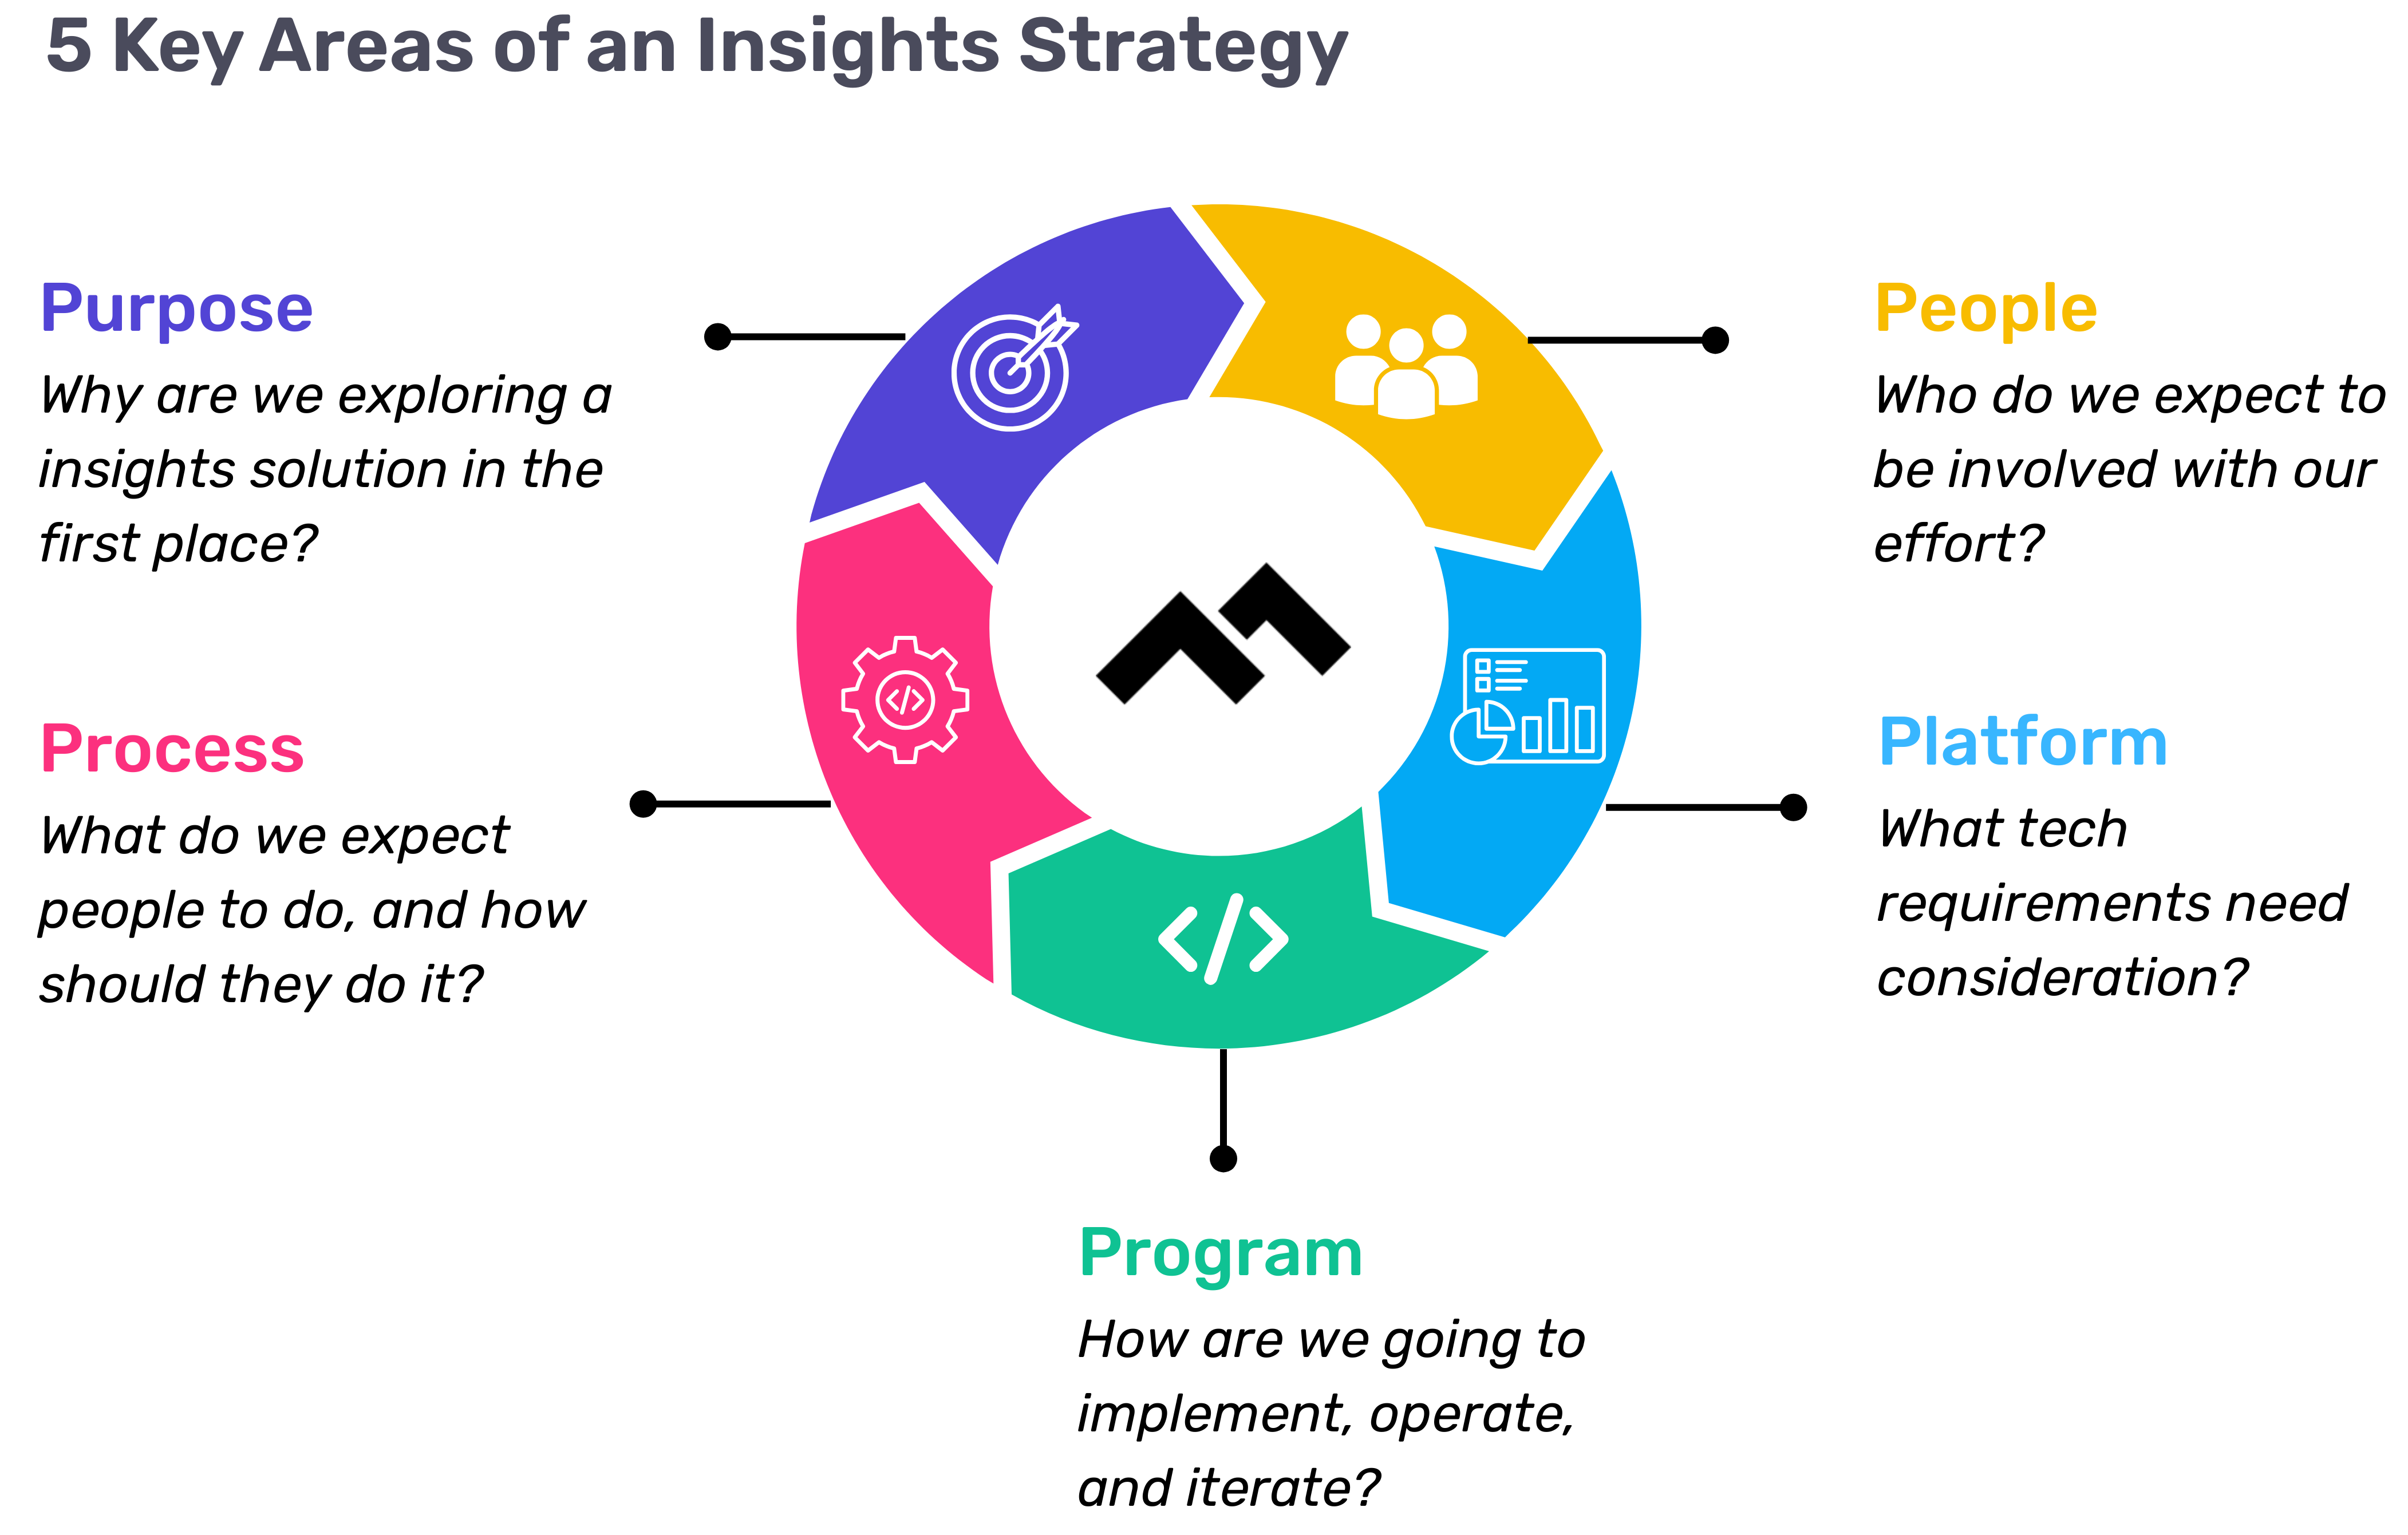
Step 1: Define Your Purpose
The first step in any successful engineering insights strategy is defining why you're doing this in the first place. If you're rolling out developer productivity metrics or an insights platform, you need to make sure there’s alignment on the purpose across the board.
Too often, organizations dive into this journey without answering the crucial question: Why do we need this data? If you ask five different leaders in your organization, are you going to get five answers, or will they all point to the same objective? If you can’t answer this clearly, you risk chasing a vague, unhelpful path.
One way I recommend approaching this is through the "Five Whys" technique. Ask why you're doing this, and then keep asking "why" until you get to the core of the problem. For example, if your initial answer is, “We need engineering metrics,” ask why. The next answer might be, “Because we're missing deliverables.” Keep going until you identify the true purpose behind the initiative. Understanding that purpose helps avoid unnecessary distractions and lets you focus on solving the real issue.
Step 2: Understand Your People
Once the purpose is clear, the next step is to think about who will be involved in this journey. You have to consider the following:
- Who will be using the developer productivity tool/insights platform?
- Are these hands-on developers or executives looking for high-level insights?
- Who else in the organization might need access to the data, like finance or operations teams?
It’s also crucial to account for organizational changes. Reorgs are common in the enterprise world, and as your organization evolves, so too must your insights platform. If the people responsible for the platform’s maintenance change, who will ensure the data remains relevant to the new structure? Too often, teams stop using insights platforms because the data no longer reflects the current state of the organization. You need to have the right people in place to ensure continuous alignment and relevance.
Step 3: Define Your Process
The next key component is process—a step that many organizations overlook. It's easy to say, "We have the data now," but then what happens? What do you expect people to do with the data once it’s available? And how do you track if those actions are leading to improvement?
A common mistake I see is organizations focusing on metrics without a clear action plan. Instead of just looking at a metric like PR cycle times, the goal should be to first identify the problem you're trying to solve. If the problem is poor code quality, then improving the review cycle times might help, but only because it’s part of a larger process of improving quality, not just for the sake of improving the metric.
It’s also essential to approach this with an experimentation mindset. For example, start by identifying an area for improvement, make a hypothesis about how to improve it, then test it and use engineering insights data to see if your hypothesis is correct. Starting with a metric and trying to manipulate it is a quick way to lose sight of your larger purpose.
Step 4: Program and Rollout Strategy
The next piece of the puzzle is your program and rollout strategy. It’s easy to roll out an engineering insights platform and expect people to just log in and start using it, but that’s not enough. You need to think about how you'll introduce this new tool to the various stakeholders across different teams and business units.
The key here is to design a value loop within a smaller team or department first. Get a team to go through the full cycle of seeing the insights, taking action, and then quantifying the impact of that action. Once you've done this on a smaller scale, you can share success stories and roll it out more broadly across the organization. It’s not about whether people are logging into the platform—it’s about whether they’re driving meaningful change based on the insights.
Step 5: Choose Your Platform Wisely
And finally, we come to the platform itself. It’s the shiny object that many organizations focus on first, but as I’ve said before, it’s the last piece of the puzzle, not the first. Engineering insights platforms like Code Climate are powerful tools, but they can’t solve the problem of a poorly defined strategy.
I’ve seen organizations spend months evaluating these platforms, only to realize they didn't even know what they needed. One company in the telecom industry realized that no available platform suited their needs, so they chose to build their own. The key takeaway here is that your platform should align with your strategy—not the other way around. You should understand your purpose, people, and process before you even begin evaluating platforms.
Looking Ahead
To build a successful engineering insights strategy, you need to go beyond just installing a tool. An insights platform can only work if it’s supported by a clear purpose, the right people, a well-defined process, and a program that rolls it out effectively. The combination of these elements will ensure that your insights platform isn’t just a dashboard—it becomes a powerful driver of change and improvement in your organization.
Remember, a successful software engineering insights strategy isn’t just about the tool. It’s about building a culture of data-driven decision-making, fostering continuous improvement, and aligning all your teams toward achieving business outcomes. When you get that right, the value of engineering insights becomes clear.
Want to build a tailored engineering insights strategy for your enterprise organization? Get expert recommendations at our free insights strategy workshop. Register here.Register here.
Andrew Gassen has guided Fortune 500 companies and large government agencies through complex digital transformations. He specializes in embedding data-driven, experiment-led approaches within enterprise environments, helping organizations build a culture of continuous improvement and thrive in a rapidly evolving world.
Navigating the world of software engineering or developer productivity insights can feel like trying to solve a complex puzzle, especially for large-scale organizations. It's one of those areas where having a cohesive strategy can make all the difference between success and frustration. Over the years, as I’ve worked with enterprise-level organizations, I’ve seen countless instances where a lack of strategy caused initiatives to fail or fizzle out.
In my latest webinar, I breakdown the key components engineering leaders need to consider when building an insights strategy.
Why a Strategy Matters
At the heart of every successful software engineering team is a drive for three things:
- A culture of continuous improvement
- The ability to move from idea to impact quickly, frequently, and with confidence
- A software organization delivering meaningful value
These goals sound simple enough, but in reality, achieving them requires more than just wishing for better performance. It takes data, action, and, most importantly, a cultural shift. And here's the catch: those three things don't come together by accident.
In my experience, whenever a large-scale change fails, there's one common denominator: a lack of a cohesive strategy. Every time I’ve witnessed a failed attempt at implementing new technology or making a big shift, the missing piece was always that strategic foundation. Without a clear, aligned strategy, you're not just wasting resources—you’re creating frustration across the entire organization.
Sign up for a free, expert-led insights strategy workshop for your enterprise org.
Step 1: Define Your Purpose
The first step in any successful engineering insights strategy is defining why you're doing this in the first place. If you're rolling out developer productivity metrics or an insights platform, you need to make sure there’s alignment on the purpose across the board.
Too often, organizations dive into this journey without answering the crucial question: Why do we need this data? If you ask five different leaders in your organization, are you going to get five answers, or will they all point to the same objective? If you can’t answer this clearly, you risk chasing a vague, unhelpful path.
One way I recommend approaching this is through the "Five Whys" technique. Ask why you're doing this, and then keep asking "why" until you get to the core of the problem. For example, if your initial answer is, “We need engineering metrics,” ask why. The next answer might be, “Because we're missing deliverables.” Keep going until you identify the true purpose behind the initiative. Understanding that purpose helps avoid unnecessary distractions and lets you focus on solving the real issue.
Step 2: Understand Your People
Once the purpose is clear, the next step is to think about who will be involved in this journey. You have to consider the following:
- Who will be using the developer productivity tool/insights platform?
- Are these hands-on developers or executives looking for high-level insights?
- Who else in the organization might need access to the data, like finance or operations teams?
It’s also crucial to account for organizational changes. Reorgs are common in the enterprise world, and as your organization evolves, so too must your insights platform. If the people responsible for the platform’s maintenance change, who will ensure the data remains relevant to the new structure? Too often, teams stop using insights platforms because the data no longer reflects the current state of the organization. You need to have the right people in place to ensure continuous alignment and relevance.
Step 3: Define Your Process
The next key component is process—a step that many organizations overlook. It's easy to say, "We have the data now," but then what happens? What do you expect people to do with the data once it’s available? And how do you track if those actions are leading to improvement?
A common mistake I see is organizations focusing on metrics without a clear action plan. Instead of just looking at a metric like PR cycle times, the goal should be to first identify the problem you're trying to solve. If the problem is poor code quality, then improving the review cycle times might help, but only because it’s part of a larger process of improving quality, not just for the sake of improving the metric.
It’s also essential to approach this with an experimentation mindset. For example, start by identifying an area for improvement, make a hypothesis about how to improve it, then test it and use engineering insights data to see if your hypothesis is correct. Starting with a metric and trying to manipulate it is a quick way to lose sight of your larger purpose.
Step 4: Program and Rollout Strategy
The next piece of the puzzle is your program and rollout strategy. It’s easy to roll out an engineering insights platform and expect people to just log in and start using it, but that’s not enough. You need to think about how you'll introduce this new tool to the various stakeholders across different teams and business units.
The key here is to design a value loop within a smaller team or department first. Get a team to go through the full cycle of seeing the insights, taking action, and then quantifying the impact of that action. Once you've done this on a smaller scale, you can share success stories and roll it out more broadly across the organization. It’s not about whether people are logging into the platform—it’s about whether they’re driving meaningful change based on the insights.
Step 5: Choose Your Platform Wisely
And finally, we come to the platform itself. It’s the shiny object that many organizations focus on first, but as I’ve said before, it’s the last piece of the puzzle, not the first. Engineering insights platforms like Code Climate are powerful tools, but they can’t solve the problem of a poorly defined strategy.
I’ve seen organizations spend months evaluating these platforms, only to realize they didn't even know what they needed. One company in the telecom industry realized that no available platform suited their needs, so they chose to build their own. The key takeaway here is that your platform should align with your strategy—not the other way around. You should understand your purpose, people, and process before you even begin evaluating platforms.
Looking Ahead
To build a successful engineering insights strategy, you need to go beyond just installing a tool. An insights platform can only work if it’s supported by a clear purpose, the right people, a well-defined process, and a program that rolls it out effectively. The combination of these elements will ensure that your insights platform isn’t just a dashboard—it becomes a powerful driver of change and improvement in your organization.
Remember, a successful software engineering insights strategy isn’t just about the tool. It’s about building a culture of data-driven decision-making, fostering continuous improvement, and aligning all your teams toward achieving business outcomes. When you get that right, the value of engineering insights becomes clear.
Want to build a tailored engineering insights strategy for your enterprise organization? Get expert recommendations at our free insights strategy workshop. Register here.Register here.
Andrew Gassen has guided Fortune 500 companies and large government agencies through complex digital transformations. He specializes in embedding data-driven, experiment-led approaches within enterprise environments, helping organizations build a culture of continuous improvement and thrive in a rapidly evolving world.
All Articles

Standups should be a vital ceremony for building trust and cohesion within a team. They’re meant to help your team remain engaged and adaptable, so they can keep work moving forward.
The reality is, most standups do none of that.
It’s not that standups aren’t a good idea in theory; teams should have a regular touchpoint that enhances collaboration and alignment. In practice, however, they fall flat. Too often, standups are held simply because they’re expected — they’re a cornerstone of agile, after all — not because they provide value to the team. They’re frequently maligned as boring and ineffective.
Like all processes that exist because of a shared understanding of how things “should” be, standups are in need of an overhaul.
To add value back into your standups, focus on the reason you’re holding them in the first place. Foreground those goals (alignment, adaptability, and engagement), and think about the particular dynamics of your team. How can you encourage your team members to contribute in a meaningful way, and to help fulfill the goals of the standup?
Every team is different, which means every answer will be slightly different. You’ll likely have to iterate before you land on a process that works for your team. And you’ll have to continue to iterate as your team and its needs change.
That said, there are a few broad strategies we here at Code Climate recommend:
Keep key questions at the forefront – Once you’ve decided on the critical questions that every standup needs to answer, make sure that information stays top of mind for all involved. We recommend pasting these questions into the standup calendar invite and revisiting them at the beginning of every standup, so they serve as a constant reminder to attendees and help keep conversations focused. The key questions we ask are:
- What did you work on yesterday?
- What are you working on today?
- Are you blocked on anything?
Don’t be afraid to ask follow up questions too, as long as they help further the goals for your meeting.
Prepare with data – To be impactful, standups need to surface the units of work most in need of attention and discussion. While you should create an environment that will encourage your team members to speak up when they need help, it’s not a guarantee that they will. A Software Engineering Intelligence (SEI) platform like Code Climate can help you spot bottlenecks and identify at-risk work, so you can walk into standups prepared. If your team members raise those issues, you’ll be ready to offer guidance. If they don’t, you can raise them yourself and help troubleshoot so that the sprint stays on track.
Create a blameless space – Ensure your team members understand that they won’t be penalized for raising an issue or voicing a concern. This will help create a feeling of safety — when engineers know they won’t be punished for it, they’ll be more likely to surface potential problems and ask for help.
Leave time for hesitation – Before moving on to the next person or topic, leave a moment of pause. Sometimes there’s an impulse to move through standup as fast as possible for efficiency’s sake. It may sound counterintuitive, but when you’re trying to keep standups efficient and impactful, moments of pause are key. If an IC is considering voicing a concern, but hesitating, you want to create an opportunity for them to speak up — often those moments of hesitation give rise to the most important conversations.
Embrace fast follow ups – Block off 20 minutes of time after every standup for follow-up conversations. If something comes up during standup that requires further conversation, you’ll have a block of time to have that conversation with the relevant teammates while things are still fresh in your head. You won’t need to derail standup for a deep dive that doesn’t impact the rest of your team, but you won’t delay the conversation for too long either.
With these strategies, you’ll be on your way to running more effective, impactful standups. Your team will start the day of strong, poised to tackle their most challenging work and keep code moving through the development pipeline.
To find out more about using data to prepare for your standups, request a consultation.

Both Engineering Managers (EMs) and Tech Leads play an integral role in an engineering organization’s health, ensuring that ICs are working together productively and effectively to deliver software on time. With so many moving parts in the development pipeline, it can be hard for an EM to prioritize and determine where they’re needed the most. This challenge is compounded by the fact that data on their team’s progress is spread across disparate sources, and developers may be reluctant to surface issues or ask for help early enough to avoid blockages that derail sprints.
Enter Workstreams, a powerful new enhancement to Velocity that streamlines all the info EMs need to help them prepare for the day ahead.Empowering them to be more proactive leaders and fostering confidence in their strategies through reliable metrics, Workstreams helps EMs quickly assess their team’s progress and identify what items need attention first.
Phase 1: Spot Risks Immediately
Workstreams is an interactive dashboard that uses rich visualizations to help EMs quickly gain visibility into a project’s pipeline, highlighting the most at-risk units of work for easy prioritization. Workstreams answers the following questions:
- What work is at risk?
- Workstreams surfaces code and project risks, allowing EMs to immediately see what areas of work require prompt attention. Details pertaining to each PR are delineated in the Issue column, with each team member assigned their own unique avatar. This visual representation of work distribution makes it easy for an EM to identify which team members are assigned to the Issue and determine whether team members are spread too thin, allowing them to effectively redistribute workload so they can protect against burnout. This also makes it easy for an EM to quickly identify which PR or PRs are triggering the Risk Alerts, drill into the code for more information, and create a follow-up plan with the assigned engineer to address the problem.
- Are any engineers blocked or task switching?
- While a Jira issue may be labeled “In Progress,” this does not always mean the relevant code is actively being worked on. Workstreams provides clarity by placing Jira status in context with coding activity in a Commit timeline. You can see which issues are in progress and review Commit activity right next to them. If there is a gap in activity for several days, it may signify the engineer is stuck, blocked by another story, or is task switching. This helps EMs identify impediments that could potentially derail sprints and see which Issues are affected. This information can be used to open a constructive dialogue with an engineer in a 1 on 1 or during standup.
- What are the largest efforts to the codebase being made this week?
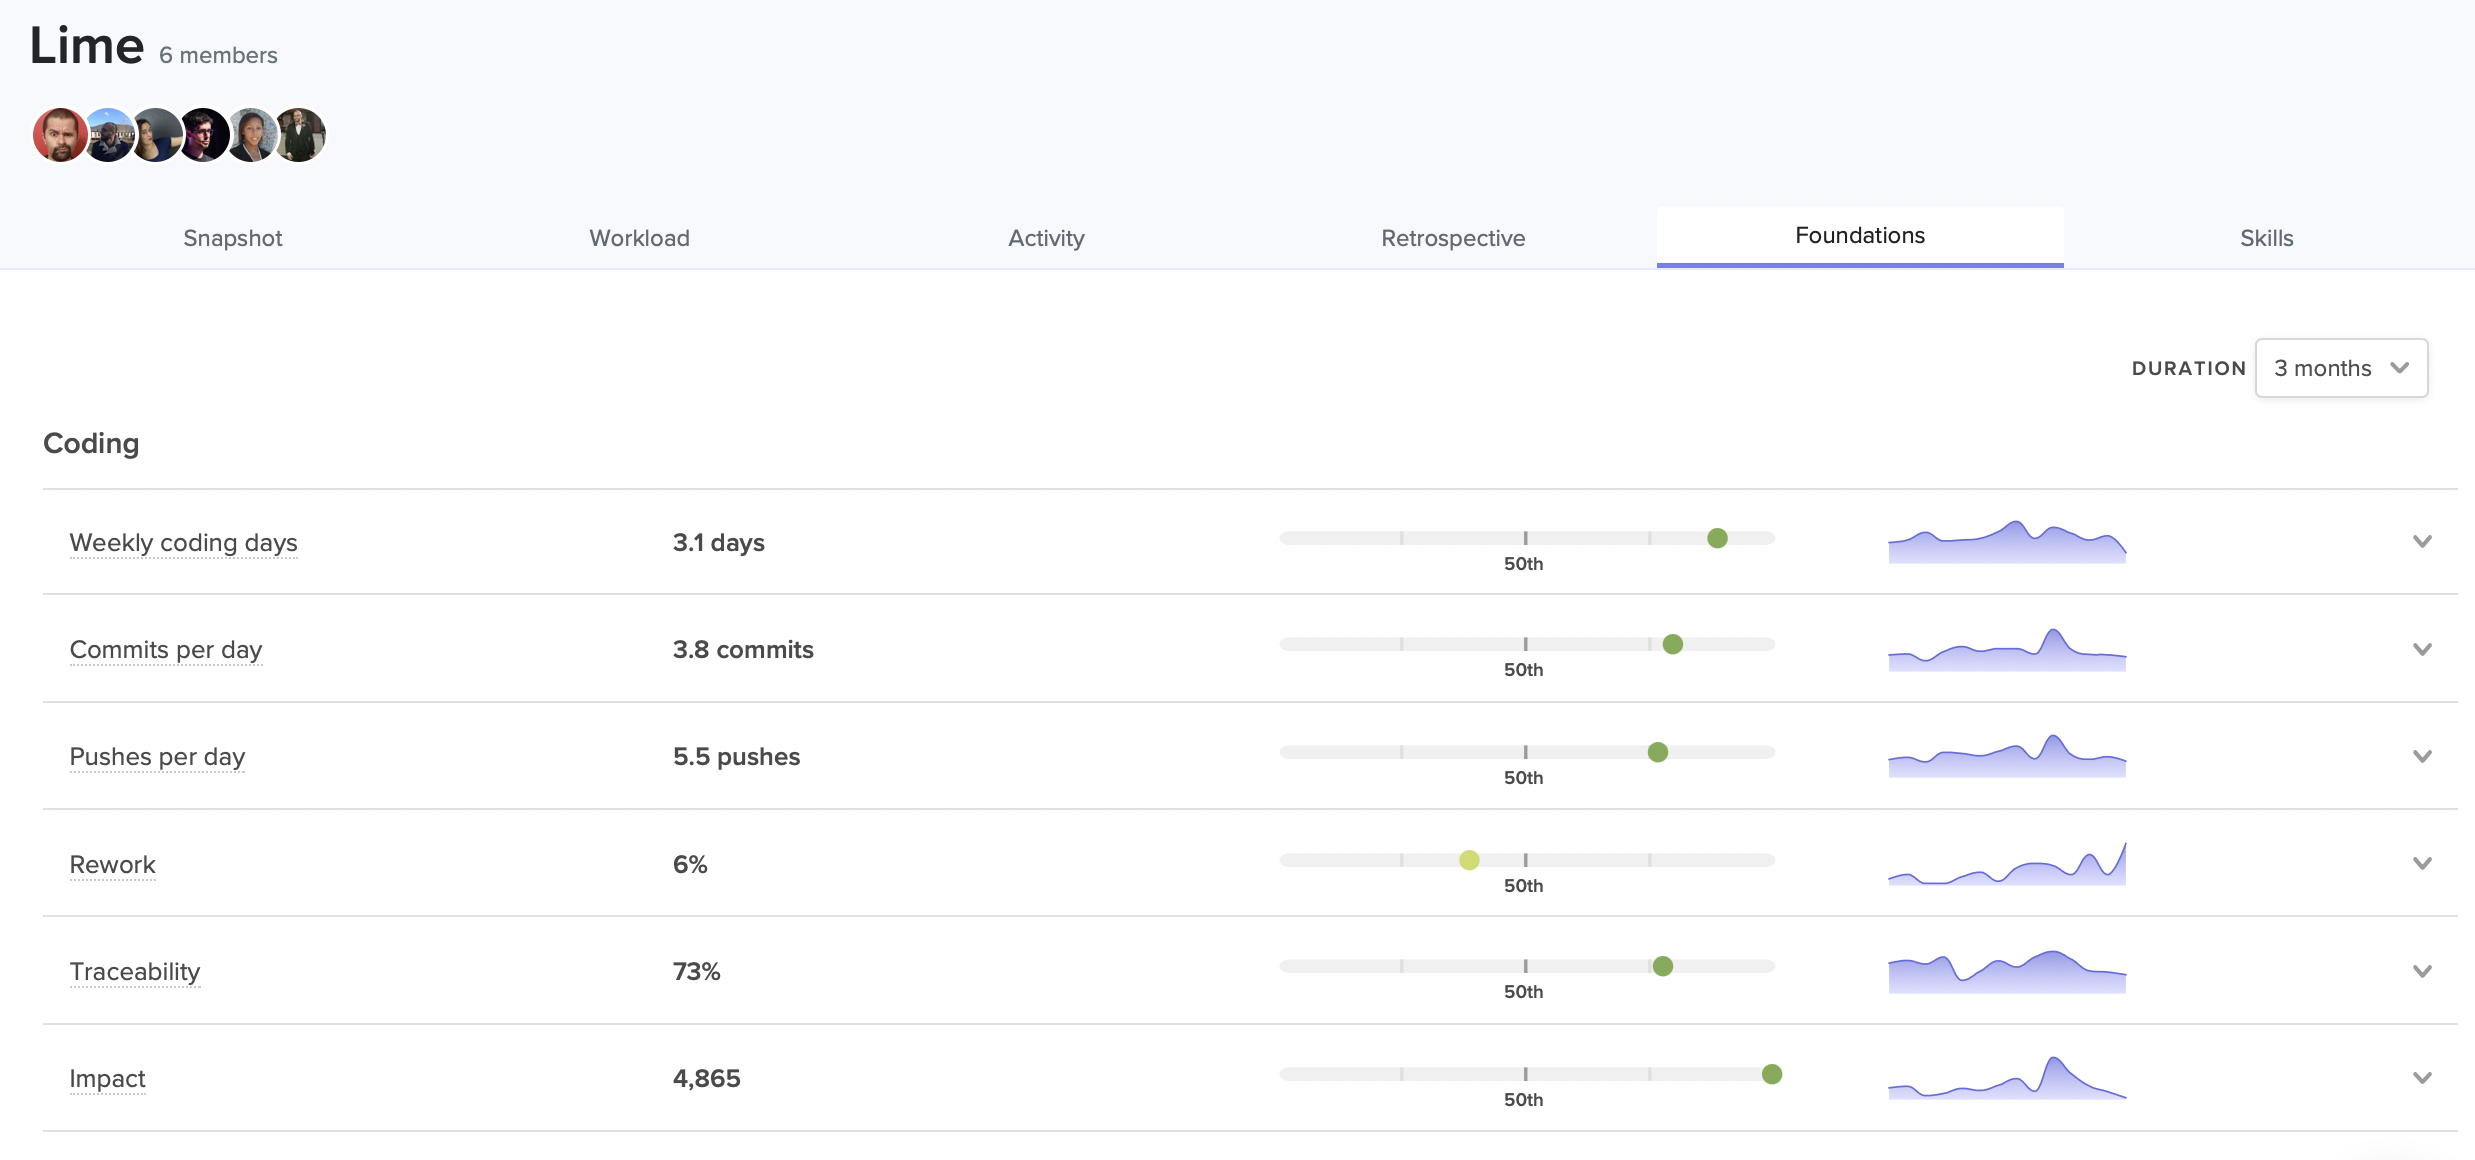
- While Lines of Code may be used to measure the potential effect on a codebase, it’s been proven to be a flawed metric. Updating 50 lines of boilerplate HTML has a much lower impact on the finished project than a 5 line logic change to a core library. Workstreams makes assessing impact easier by using data science to weigh the magnitude of code changes. A proprietary metric, Code Climate’s Impact factors in variables such as the location of edits, the type of code being written (new code vs. updating existing code), and the specific nature of the change (e.g., formatting changes are simpler than logical changes).
An Engineering Manager can use this data to get a sense of the effect of any unit of work. The Activity chart offers a visual representation of code Impact in the form of bubbles — smaller bubbles signify a smaller Impact, while larger bubbles signify a larger Impact. Hovering over a bubble displays the associated Commit, providing EMs with an immediate view of which Commits have the greatest impact on the codebase.
Phase 2: Lead Healthy Standups
An integral part of the Agile process, standups are meant to provide visibility into each team member’s progress and surface any issues that may need course correction. The reality is, they are often unengaging and unfocused, and some team members are hesitant to raise issues in a public forum. Workstreams provides the structure EMs need to keep standups focused and valuable. It is best used in one of three ways:
- Sort by People
- Instead of waiting for a team member to volunteer to speak next, EMs can save time and surface discussion points efficiently by pulling up an alphabetical list of team members on their screen to run standups in that order.
- Sort by Risk
- Standups are short and should prioritize conversations around identifying and mitigating risk. To make the most out of their standups, EMs can sort risks in the Risk column to show PR issues that have triggered a Risk Alert. This helps laser-focus discussion points while prompting team members to share collective knowledge for a successful triage.
- Sort by Effort
- The Effort column illustrates the cumulative impact of all PRs pertaining to an issue. This helps highlight large stories that can potentially affect many parts of the codebase. Sorting by Effort, EMs can review the issues with the greatest strategic impact first, ensure they are progressing as expected, and potentially use them as a coaching opportunity for newer engineers.
With Workstreams, engineering organizations can approach each day with a more complete understanding of the work that matters most to their current goals, and focus their efforts accordingly. It’s a powerful addition to Velocity, an already robust engineering intelligence platform designed to provide engineering leaders with the end-to-end visibility they need to ship code faster, maintain their competitive edge, and foster a culture of engineering excellence.

Led by PSG, the investment is aimed at furthering Code Climate’s mission to help engineering leaders align initiatives with strategic priorities, accelerate software delivery, and drive continuous improvement.
Code Climate, a leading Software Engineering Intelligence (SEI) platform, announced today that it has raised $50M in Series C funding. The round was led by PSG and joined by previous investors Union Square Ventures, Foundry Group, Lerer Hippeau Ventures, and NextView Ventures, bringing Code Climate’s total funding to $66M.
Founded in New York City in 2011, Code Climate’s Engineering Intelligence products are trusted by over 1,000 companies from start-ups to enterprises. Their flagship product, Velocity, empowers companies like Faire, Instacart, and Forbes to improve the efficiency of their engineering and product organizations at scale. By transforming data from DevOps and project management tools like Jira into valuable insights, Velocity reduces cycle time and enables teams to ship software faster.
“We’re excited to partner with PSG and build upon our leadership as a Software Engineering Intelligence platform,” said Bryan Helmkamp, CEO & Co-Founder of Code Climate. “This investment will help us further our vision of helping engineering and business executives align engineering initiatives with business priorities, deliver high quality code quickly and consistently, and improve teams’ processes and skills to create a high performing culture.”
Over the past year, Code Climate has experienced continued strong growth, more than doubled its headcount, and brought on an experienced executive leadership team.
“We think Code Climate is well positioned to capitalize on companies’ growing need to gain visibility into their engineering organizations,” said Rich Zajeski, Vice President at PSG. “We believe Code Climate has built a leading platform and team that can address this market need. The value proposition of Code Climate has enormous potential, helping companies maximize their strategic investments in software engineering to bring innovative products to market faster, more consistently, and more efficiently. We are thrilled to have the opportunity to partner with Bryan and the rest of the Code Climate team in their next phase of growth.”
The funding will help Code Climate advance its product vision, extend its sales reach, and scale customer success – furthering its mission of helping engineering align activities with strategic priorities, deliver high quality software, and improve team performance.

Historically, engineering departments have been without reliable, objective metrics, leaving engineering leaders at a disadvantage in conversations with executives and board members. It’s part of the reason engineering is often viewed as a ‘black box’ — where departments like sales and marketing have clear numbers that demonstrate the efficacy of their processes, or their direct impact on the company’s bottom line, engineering has been reliant on reporting progress in ways that often raise more questions than they answer.
A list of features completed, for example, doesn’t convey the amount of work that went into delivering each feature, and doesn’t account for variations in difficulty or complexity. When a list is shorter one quarter, the immediate conclusion may not be that the features were more complicated, but that the engineering team is starting to fall behind.
Reporting on incidents is similarly flawed. The frequency of incidents may increase when the engineering team is encouraged to pursue an ambitious product roadmap without being afforded the time to address technical debt. These incidents may be seen as a reflection of subpar work by the engineering team, when in reality they’re a result of poor planning and prioritization.
To communicate effectively with the rest of the business, engineering needs to speak the language of the rest of the business. To do that, engineering leaders need objective metrics. Objective metrics translate across teams, individuals, and projects. They provide a concrete basis for critical conversations about everything from resource allocation to strategic decisions. Rather than simply asking stakeholders to trust your conclusions, you can use data to show them how you got there.
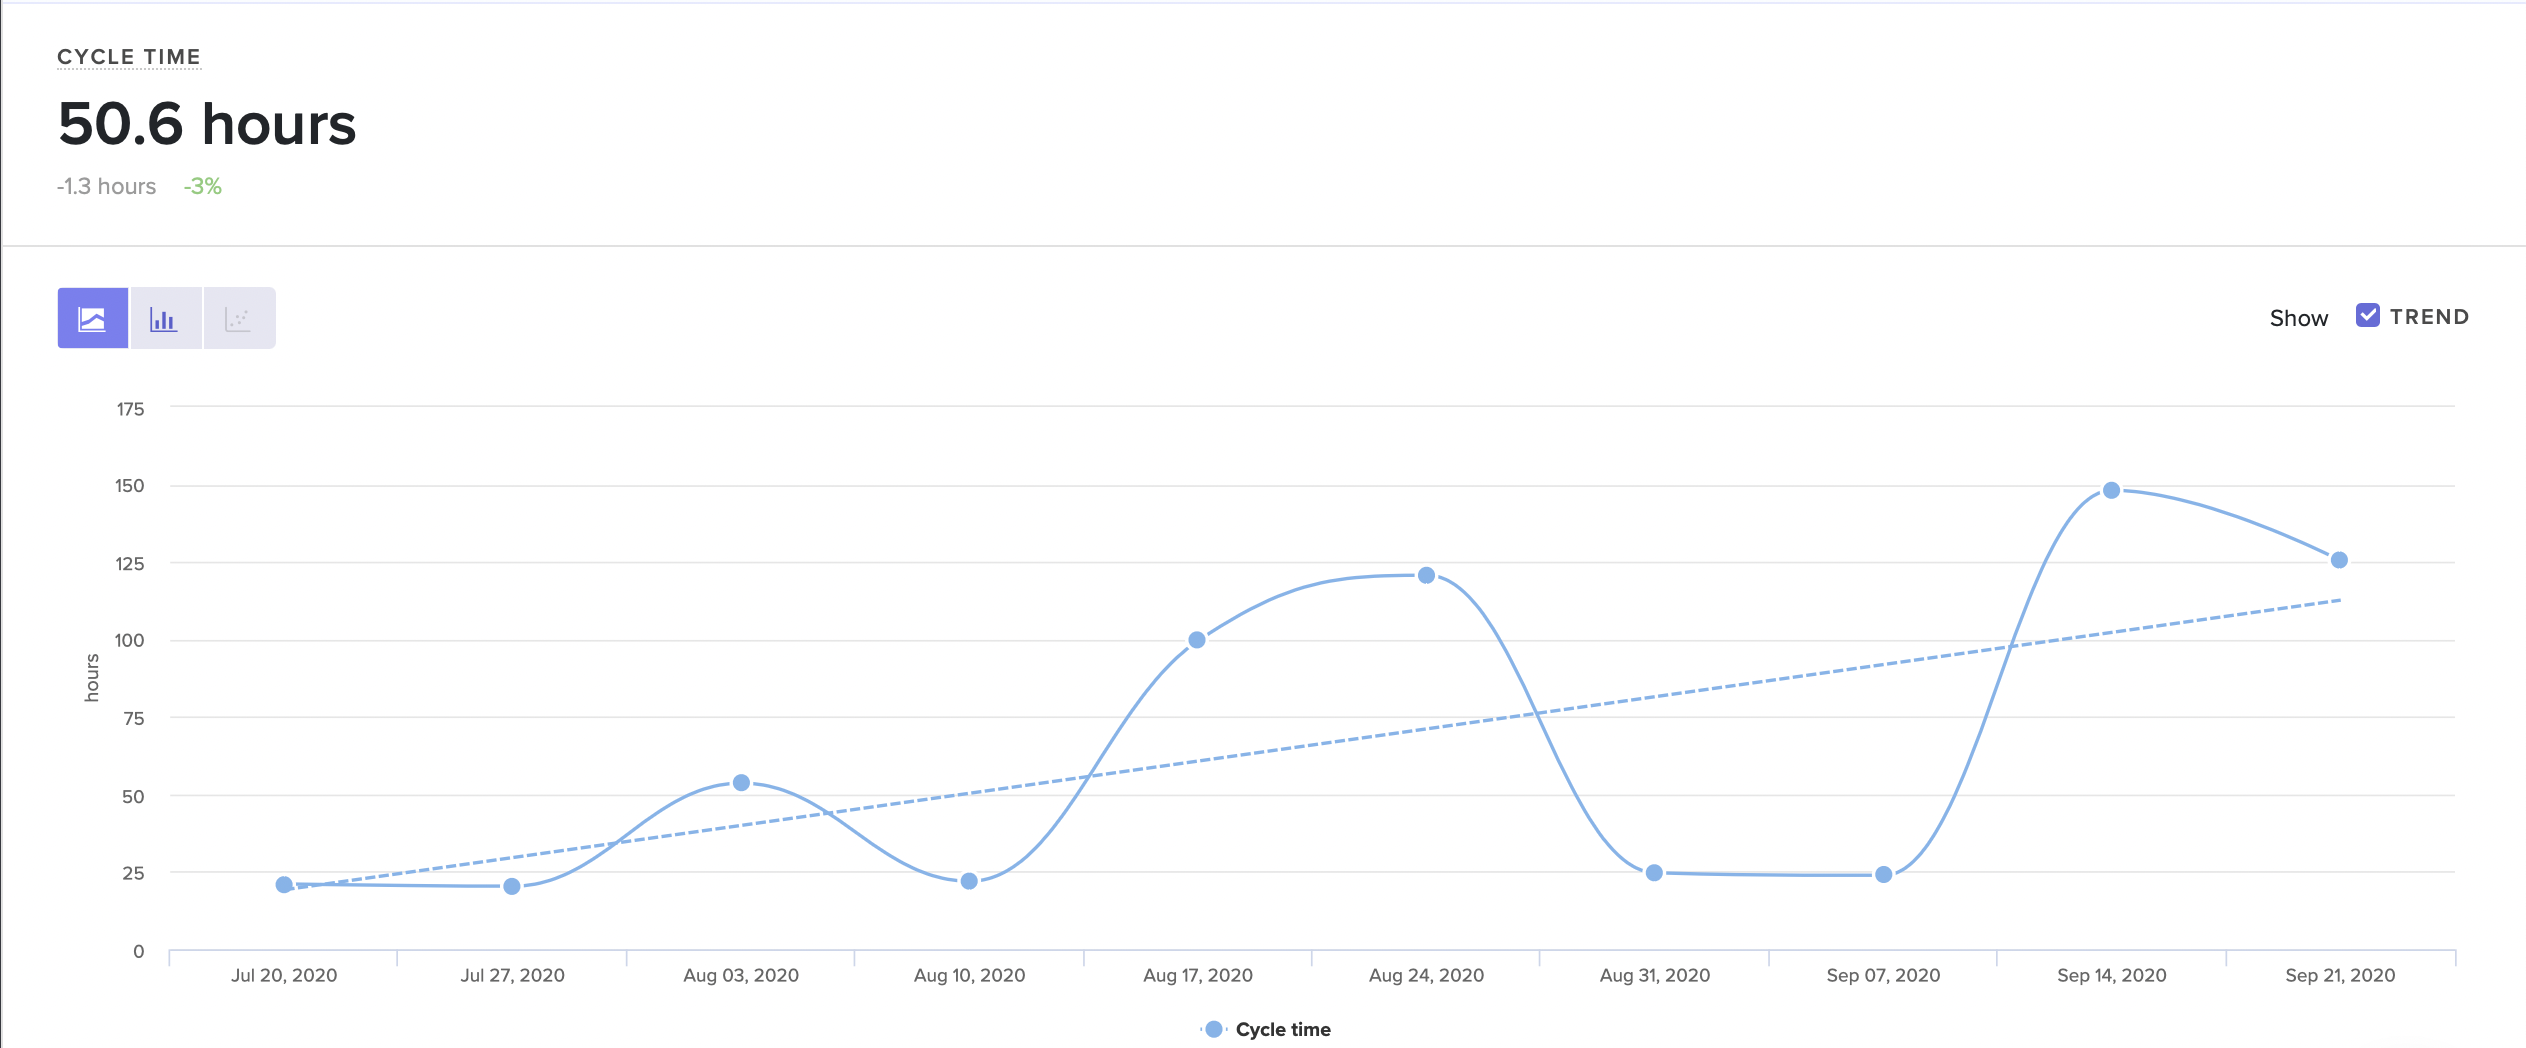
For example, you can make the case for increasing headcount by explaining that your current team isn’t large enough to keep up with the proposed product roadmap, or you can look at a throughput metric like Deploy Volume and illustrate the engineering team’s capacity with concrete numbers. On the flip side, you can demonstrate the success of a recent hiring push and illustrate the effectiveness of your onboarding practices with a graph of your team’s Cycle Time (a great proxy for engineering speed), demonstrating how quickly new hires are getting up to speed.
Trust is important, but it’s not enough. When you’re advocating for your department — pushing for key resources, raising an issue, or celebrating a success — data will help you make a stronger case.
Of course, metrics are not a replacement for experience, intuition, and expertise. As the expert, it’s still your job to put metrics in context, analyze them, and draw the right conclusions. When communicating with key stakeholders, you’ll need to choose the metrics that matter most to the rest of your organization, and situate them within the larger story of your department.

As you think about driving high performance on your team, it’s easy to focus on certain tangible improvements like optimizing processes, upskilling team members, and hiring new talent. But your team will only go so far if you neglect to cultivate a key aspect of team culture — psychological safety. Psychological safety, most commonly defined as the knowledge that you won’t be punished for making a mistake, is critical to the success of the highest performing organizations; it allows teams and individuals to have confidence in taking risks of all kinds, from the most basic risk of opening a Pull Request for feedback, to the larger leaps necessary to drive true innovation and stay ahead of the competition.
With the right data and a clear strategy for analysis, you’ll be able circumvent some common biases and assumptions, while fostering the psychological safety necessary to keep improving as a team.
Software Engineers Need Safety to Deploy
Safety is a prerequisite of speed; developers who aren’t confident in their code might become a bottleneck if they’re hesitant to open a PR and receive feedback. When your team has a culture of safety, that developer can feel more secure subjecting their work to the review process. They know they’ll have the opportunity to work through their mistakes, rather than being penalized for them.
Psychological safety is also critical at the other end of your software development pipeline. Developers need to feel secure enough to deploy code, and that security can be found on two levels: the confidence that their deployment won’t break things, and the trust that they won’t be punished if it does.
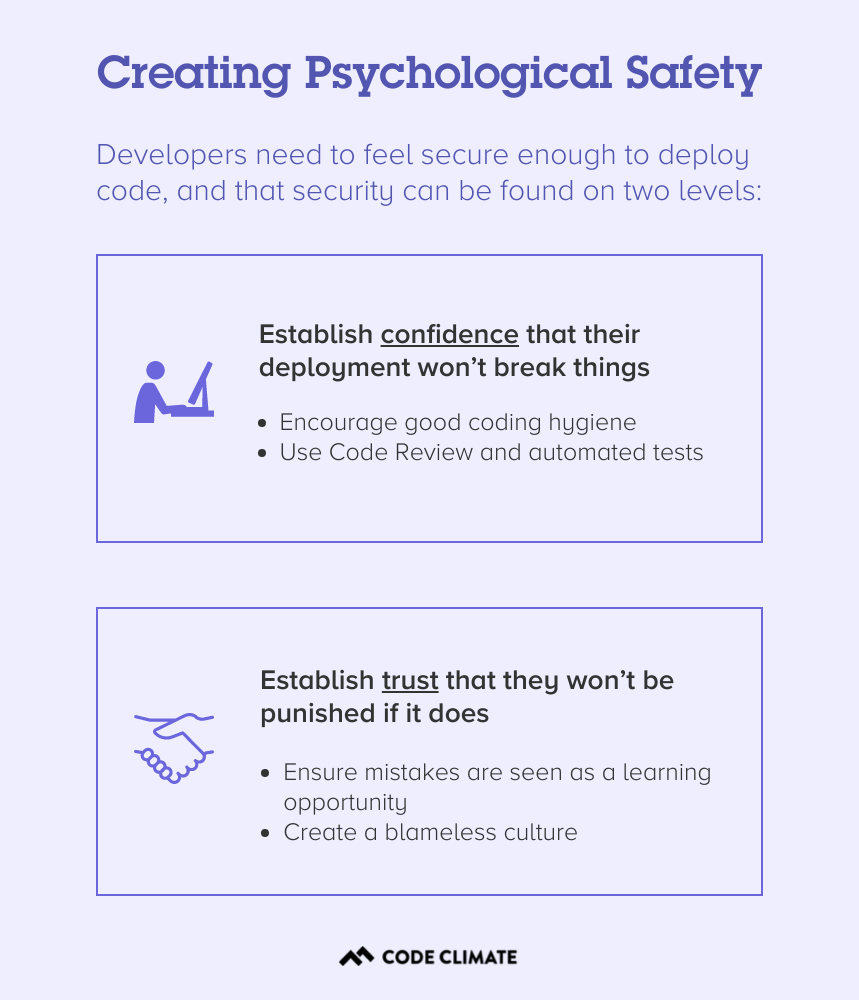
The first is mainly a factor of process and tooling. Code Review and automated tests can offer some degree of confidence that buggy code won’t be deployed, while good coding hygiene, specifically the practice of keeping Pull Requests as small as possible, will mean that any damaging changes are easier to identify and reverse.
The second level, the trust that a developer won’t be punished if their code introduces a bug or causes an incident, is a matter of culture. It’s an engineering leader’s responsibility to create a culture of psychological safety on their team, and to ensure that mistakes are seen as a learning opportunity, rather than an occasion for punishment. In a blameless culture, the work is evaluated and discussed independently of the person who completed it, and every member of a team stands to benefit from the learning experience.
Without this foundation of trust, your team will be hard-pressed to deploy quickly and consistently, let alone take the larger risks necessary to pursue big ideas, innovate, and stay ahead of your competition.
Using Data to Create Psychological Safety
Data can play a key role in your efforts to cultivate a culture of psychological safety. Whenever you introduce data in your organization, it’s important to do so responsibly — be transparent, put all data in context, and avoid using it to penalize members of your team. But used properly, clear, objective metrics can help you combat intrinsic biases and check your assumptions, while keeping conversations grounded in fact. This makes it easier to keep conversations focused on the work, rather than the person behind that work.
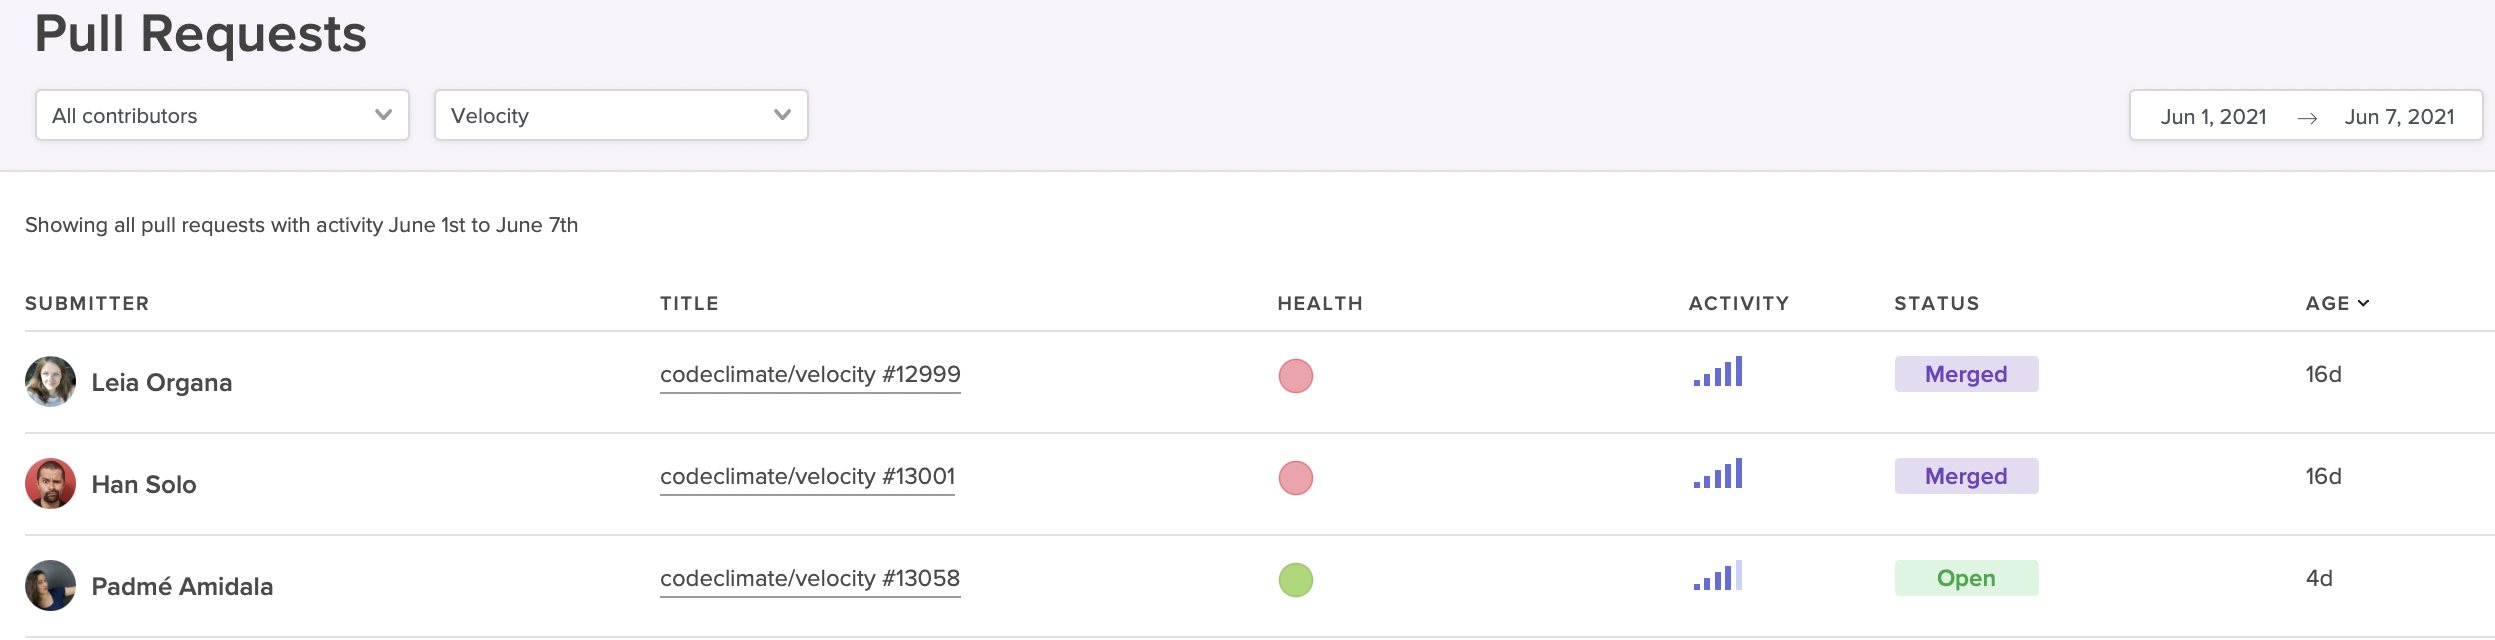
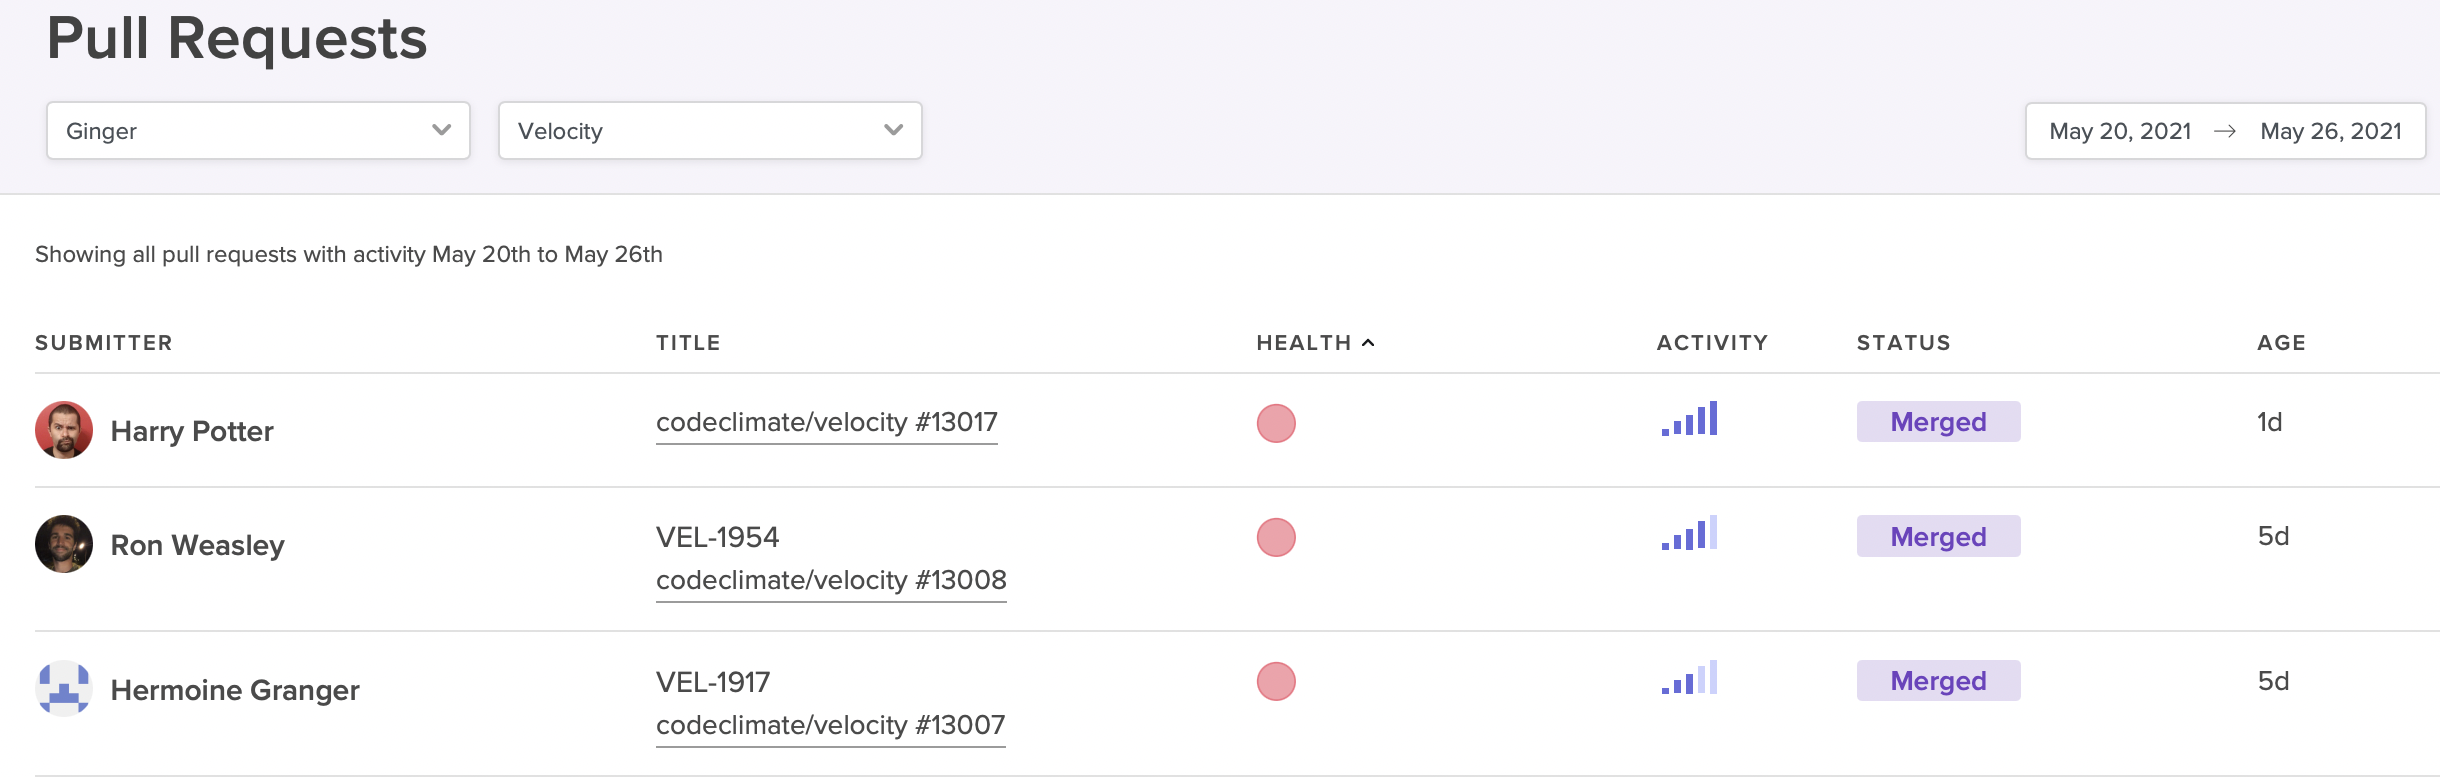
Surface high-activity Pull Requests that could be at risk of derailing your sprint.
For example, if a particular sprint is falling behind, you could frame the conversation in a general sense, asking the team why they’re moving slowly. But this framing risks putting your team members on the defensive — it could be construed as finding fault in your developers, and places blame on them for the slowdown.
With data from a Software Engineering Intelligence platform like Code Climate, it’s easier to ensure that discussions remain focused on the work itself. For instance, it’s possible to identify at-risk work before it derails your sprint. You can pull up a report that highlights long-running, high-activity Pull Requests, then dig into those PRs with your team. If you keep the conversation focused on those specific units of work, you’ll be better able to surface the particular challenges that are slowing things down and work through them together.
To find out how data can help you create psychological safety and drive performance in your organization, request a consultation.

Developers who are struggling to keep up, as well as those developers who are excelling but no longer growing, are likely to be unsatisfied in their current roles. But engineering leaders, especially managers of managers or those who are not involved in the day-to-day writing of code, may not have insight into who is in need of support and who is craving their next challenge.
With the right combination of quantitative and qualitative data, you’ll be able to spot opportunities to coach developers of all levels. You’ll also have an easier time setting and tracking progress towards concrete targets, which will empower your team members to reach their goals.
Start by Gathering Qualitative Engineering Data
Use your 1 on 1 time to initiate conversations with each of your team members about where they think their strengths and weaknesses lie, and what they’d like to improve. You may want to give your team members some time to prepare for these conversations, as it can be hard to make this sort of assessment on the spot.
Pay extra attention in standups and retros, keeping an eye out for any patterns that might be relevant, like a developer who frequently gets stuck on the same kind of problem or tends to surface similar issues — these could represent valuable coaching opportunities. It can also be helpful to look for alignment between individual goals and team objectives, as this will make it easier to narrow your focus and help drive progress on multiple levels.
Dig Into Quantitative Engineering Data
Next, you’ll want to take a closer look at quantitative data. A Software Engineering Intelligence platform like Code Climate can pull information from your existing engineering tools and turn them into actionable reports and visualizations, giving you greater insight into where your developers are excelling, and where they might be struggling. Use this information to confirm your team member’s assessment of their strengths and weaknesses, as well as your own observations.
You may find that an engineer who feels like they’re a a slow coder isn’t actually struggling to keep up with their workload because of their skill level, but because they’ve been pulled into too many meetings and aren’t getting as much coding time as other team members. In other cases, the quantitative data will surface new issues or confirm what you and your team member already know, underscoring the need to focus on a particular area for improvement.
A Code Climate customer and CTO finds this kind of quantitative data particularly helpful for ensuring new hires are onboarding effectively — and for spotting high-performers early on. As a new member of the team, a developer may not have an accurate idea of how well they’re getting up to speed, but data can provide an objective assessment of how quickly they’re progressing. James finds it helpful to compare the same metrics across new developers and seasoned team members, to find out where recent hires could use a bit of additional support. This type of comparison also makes it easier to spot new engineers who are progressing faster than expected, so that team leaders can make sure to offer them more challenging work and keep them engaged. Of course, as is true with all data, James cautions that these kinds of metrics-based comparisons must always be viewed in context — engineers working on different types of projects and in different parts of the codebase will naturally perform differently on certain metrics.
Set Concrete Engineering Goals
Once you’ve identified areas for improvement, you’ll want to set specific, achievable goals. Quantitative data is critical to setting those goals, as it provides the concrete measurements necessary to drive improvement. Work with each team member to evaluate the particular challenges they’re facing and come up with a plan of action for addressing them. Then, set realistic, yet ambitious goals that are tied to specific objective measurements.
This won’t always be easy — if a developer is struggling with confidence in their coding ability, for example, you won’t be able to apply a confidence metric, but you can find something else useful to measure. Try setting targets for PR Size or Time to Open, which will encourage that developer to open smaller Pull Requests more frequently, opening their work up to constructive feedback from the rest of the team. Ideally, they’ll be met with positive reinforcement and a confidence boost as their work moves through the development pipeline, but even if it does turn out their code isn’t up to par, smaller Pull Requests will result in smaller changes, and hopefully alleviate the overwhelming feeling that can come when a large Pull Request is met with multiple comments and edits in the review process.
Targets like these can be an important way to help developers reach their individual goals, but you can also use them to set team- or organization-wide goals and encourage progress on multiple fronts. Roger Deetz, VP of Engineering at Springbuk, used Code Climate to identify best practices and help coach developers across the organization to adopt them. With specific goals and concrete targets, the team was able to decrease their Cycle Time by 48% and boost Pull Request Throughput by 64%.
Though it’s certainly possible to coach developers and drive progress without objective data, it’s much harder. If you’re looking to promote high-performance on your team, look to incorporate data into your approach. You’ll be able to identify specific coaching opportunities, set concrete goals, and help every member of your team excel.

It’s important for a manager to know what their team members are working on, and to understand how that work is going. Still, how you get that information matters. Turning every standup into a status update or constantly checking in with engineers can be disruptive to developers’ flow, and can make your team members feel like you’re micromanaging their every move.
Status updates of this kind are also not productive for an individual contributor — you may need visibility into your team’s workflow, but looping you in isn’t providing value to your engineers. When your team stops what they’re doing to give you basic information, they’re not getting much out of the exchange.
If you get the visibility you need from data that already exists in your engineering workflow, you can dedicate your 1 on 1s, standups, and check-ins to higher-value interactions, whether that’s team-building, problem-solving, innovation, or professional development. Your team will be happier and more productive, and you’ll be able to use your meetings and conversations to make a bigger impact on your organization — and to empower your developers to do the same.
Get Visibility With Data, Not Check-Ins
Of course, you still need a sense of what everyone’s working on and how it’s going. Get that basic information from a Software Engineering Intelligence (SEI) solution like Code Climate, which gathers key information from your existing engineering workflow. You’ll be able to quickly get a sense of what each developer is working on and check that against your expectations of your team’s priorities and workload.
With that information, you can determine the best course of action for supporting your team.
When things are running smoothly, it’s likely best to take a step back and let your developers manage their own work. There may be opportunity for improvement — there always is — but that’s what retros are for. If you’re running effective retrospectives after each project or sprint, your team will still find opportunities to keep doing better.
Look For: A low PR Cycle Time, which indicates that Pull Requests are moving through your software development pipeline quickly and efficiently.
In the middle of a sprint, however, you’ll want to focus on work that isn’t going as planned, rather than work that meets your expectations. With Code Climate, for example, you can easily surface at-risk Pull Requests — PRs that are exceedingly large, have been open for long periods of time, or are taking up the attention of multiple members of your team. Some PRs are naturally larger and more complex, and that’s ok. But in some cases, these characteristics are red flags, signs that your team members could use your support. If you follow up on at-risk units of work, you’re likely to find opportunities to help your team members resolve bottlenecks or tackle challenges. You’ll enter meetings already informed, and you’ll be able to keep conversations focused and productive.
The Pull Requests report can help you easily surface at-risk PRs.
Look For: PRs that are exceedingly large, have been open for long periods of time, or are taking up the attention of multiple members of your team. (A Software Engineering Intelligence platform can help you easily surface at-risk PRs like these, based on information that already exists in your VCS or other engineering tools.) Some PRs are naturally larger and more complex, and that’s ok. In some cases, these characteristics are red flags. Talk to your team about any concerning PRs to determine whether your developers could use your support.
Use Data Responsibly to Avoid Becoming Big Brother
Even managers who barely think twice about interrupting an engineer’s workday to ask for an update worry that digging into data from their engineering workflow may feel invasive. The key to maintaining your team’s trust and fostering a greater sense of autonomy lies not in whether you have access to data, but how you use it. As a leader, it’s your responsibility to cultivate a culture of transparency and safety where metrics are used responsibly and constructively.
When Code Climate customer introduced engineering metrics at their organization, the CTO was careful to put them in perspective: “I spoke about Coe Climate and Cycle Time — how you measure a process, not people. And how you improve a process. I said to the team, ‘I’m going to start measuring the team just to measure the process and improve it. I’m not measuring individuals.’” With this groundwork, the team could surface key information about its workflow without constant check-ins and shoulder taps. As a result, they refined their processes and doubled their productivity, slashing their Cycle Time from 72 hours to 30 hours.
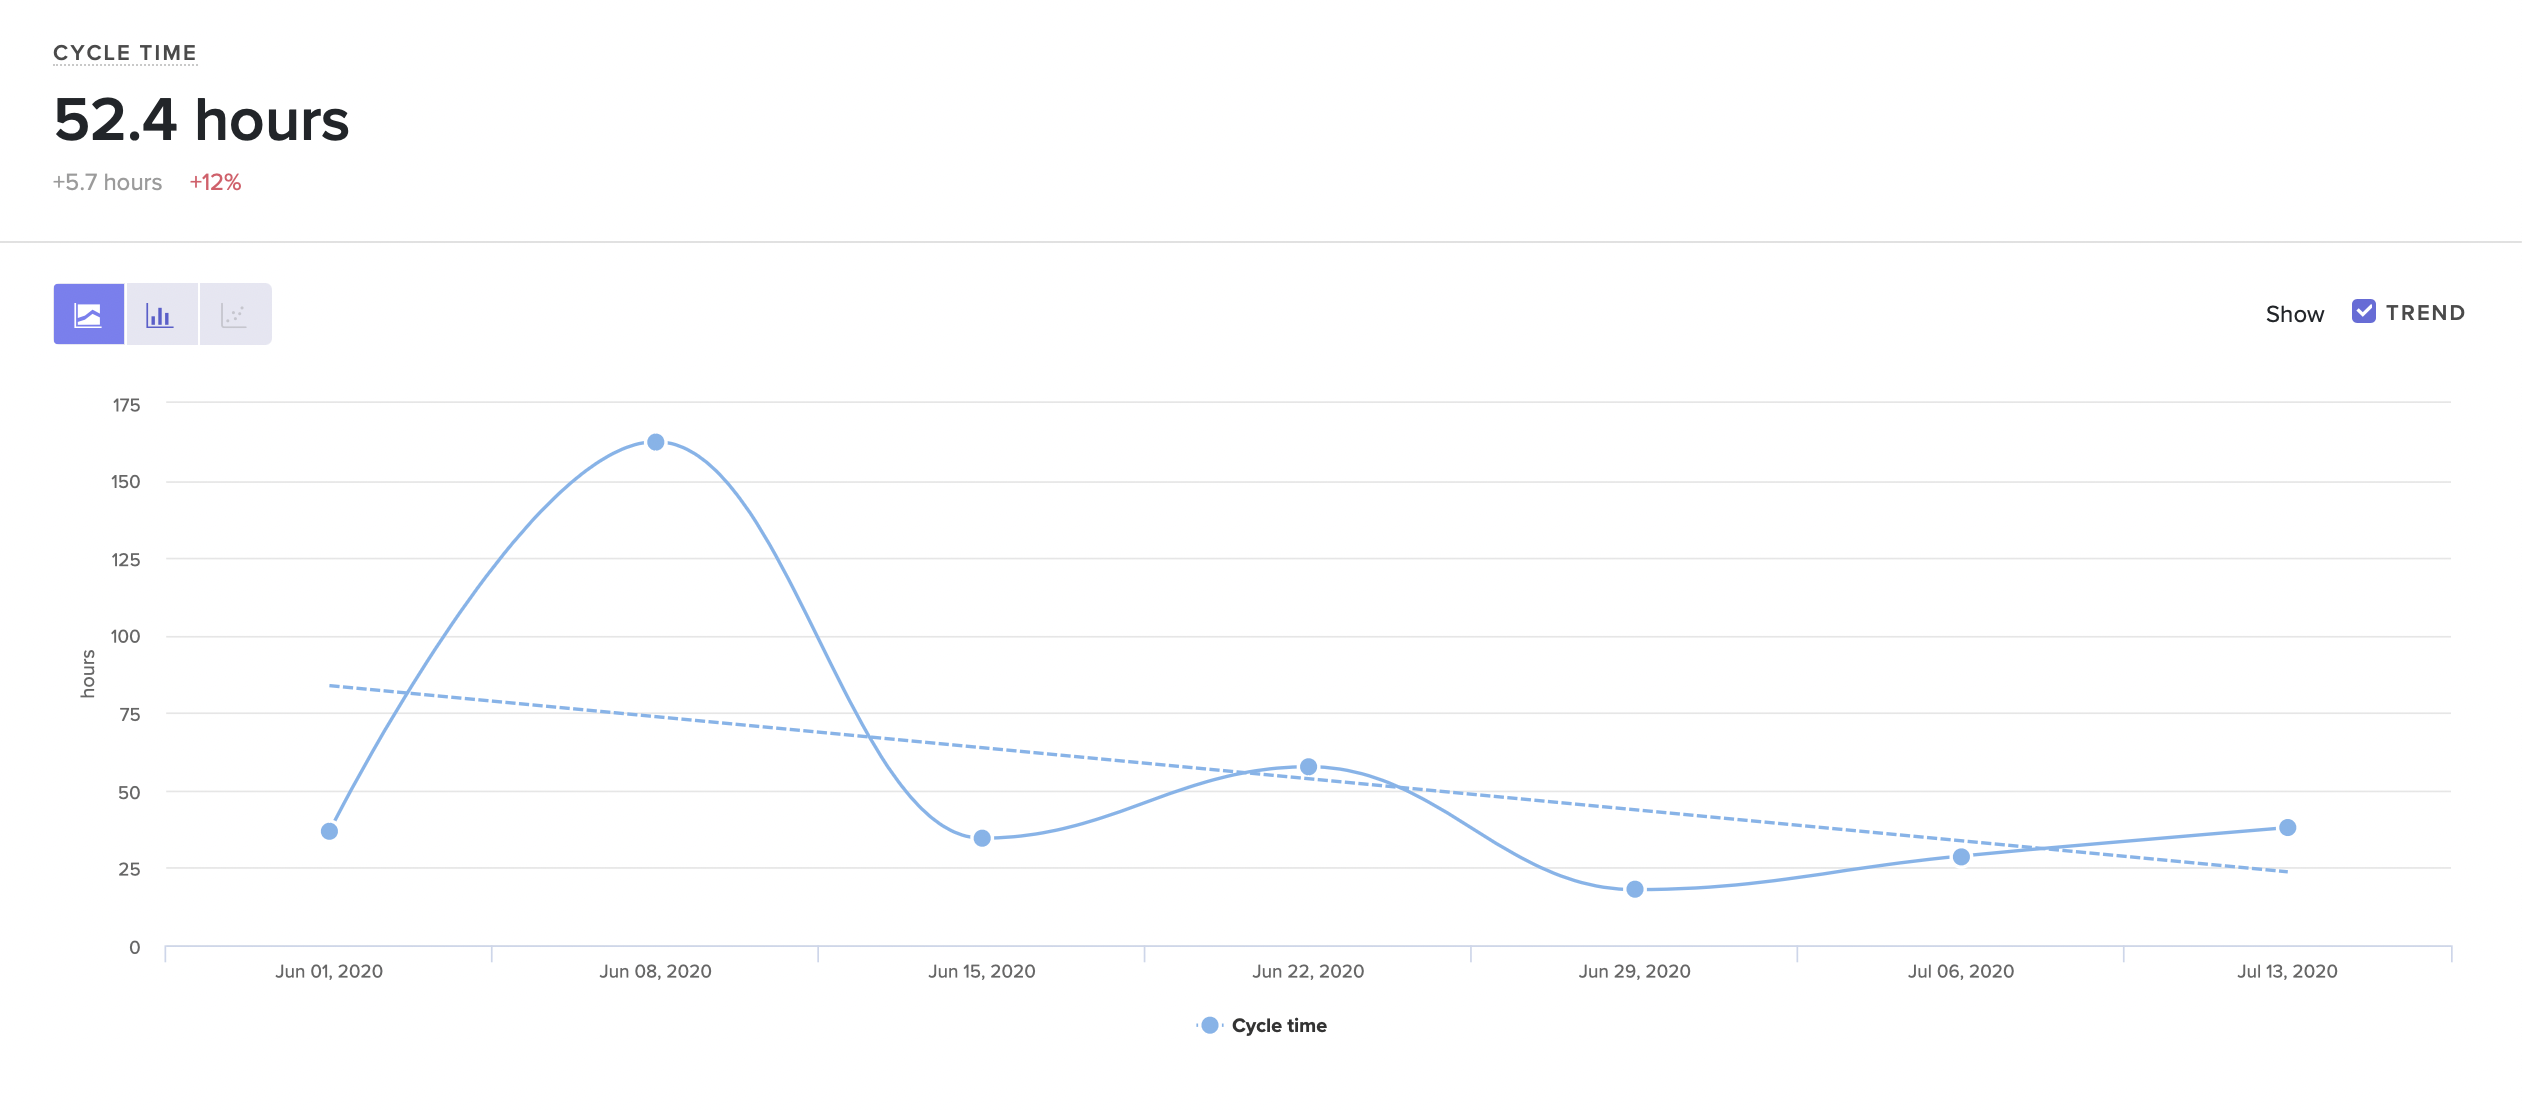
Visualize trends in the way your team is working.
When bringing data into your organization, it’s important to remember that:
- Data must be used with transparency. Your team members should know what information you’re looking at, who else has access to it, and how you plan to use it. Make sure you communicate openly and honestly about any plans you have to introduce data, and your goals for bringing data into your organization.
- Data should enhance, not replace conversations. Data doesn’t tell the whole story, and should always be viewed in context. Use it as a starting point for conversations, rather than using it as the basis for decisions.
- Data provides insights about the work, not the person. Engineering is collaborative, and it’s up to you to ensure no one feels personally responsible for issues or negative trends. Keep the focus on the work so your whole team can get behind improvement.
- Data should be used constructively, not punitively. Mistakes and shortfalls should be viewed as coaching opportunities, rather than occasions to take punitive action.
If you keep these principles in mind, you’ll be able to use data in a way that benefits you as a leader, as well as your team members as managers and ICs. Free of unnecessary check-ins and status updates, your team members will enjoy more autonomy and have more time to focus on their work. Together, you’ll be able to tackle larger challenges and make an even bigger impact on your organization.
Request a consultation to learn more.

(Updated: February 20, 2024)
When building a high-performance engineering organization, it’s not enough to hire top talent — leaders must also keep developer experience in mind and create an environment that’s conducive to productivity. Even the most skilled developers will be hamstrung by ineffective processes and other bottlenecks that stand in the way of deploying code.
That doesn’t mean it’s easy to identify the blockers that are slowing down your team. When code is making it through to production, it’s easy to assume that your processes are functioning. Leaders often lack the visibility to pinpoint bottlenecks, and developers may be reluctant to raise their hands and voice concerns, particularly if their concerns are based on gut feel.
To effectively remove blockers and boost engineering productivity, you need data. With the right information, you’ll be able to enhance visibility and supplement gut feel, making it possible to quickly spot bottlenecks in your software development pipeline and empower developers to collaborate on effective solutions.
How to Use Data to Identify Bottlenecks in Your Processes
Used thoughtfully, data is a critical tool for identifying and refining broken processes, as well as optimizing processes that are functional, but could be even more efficient.
With the right data, you can:
- Check your assumptions. Data can provide the objective evidence necessary to challenge your assumptions about what should be working. When confronted with concrete numbers, you may find that certain ‘best practices’ are not practical for your team, or processes that seem logical on paper may not hold up in practice. For example, though Code Review can be a critical way to vet code and share knowledge across your team, there’s no one-size-fits all solution for keeping code moving quickly through the review process. With an objective look at the way PRs move through review, you’ll be able to refine your process and find the one that works best for your team.
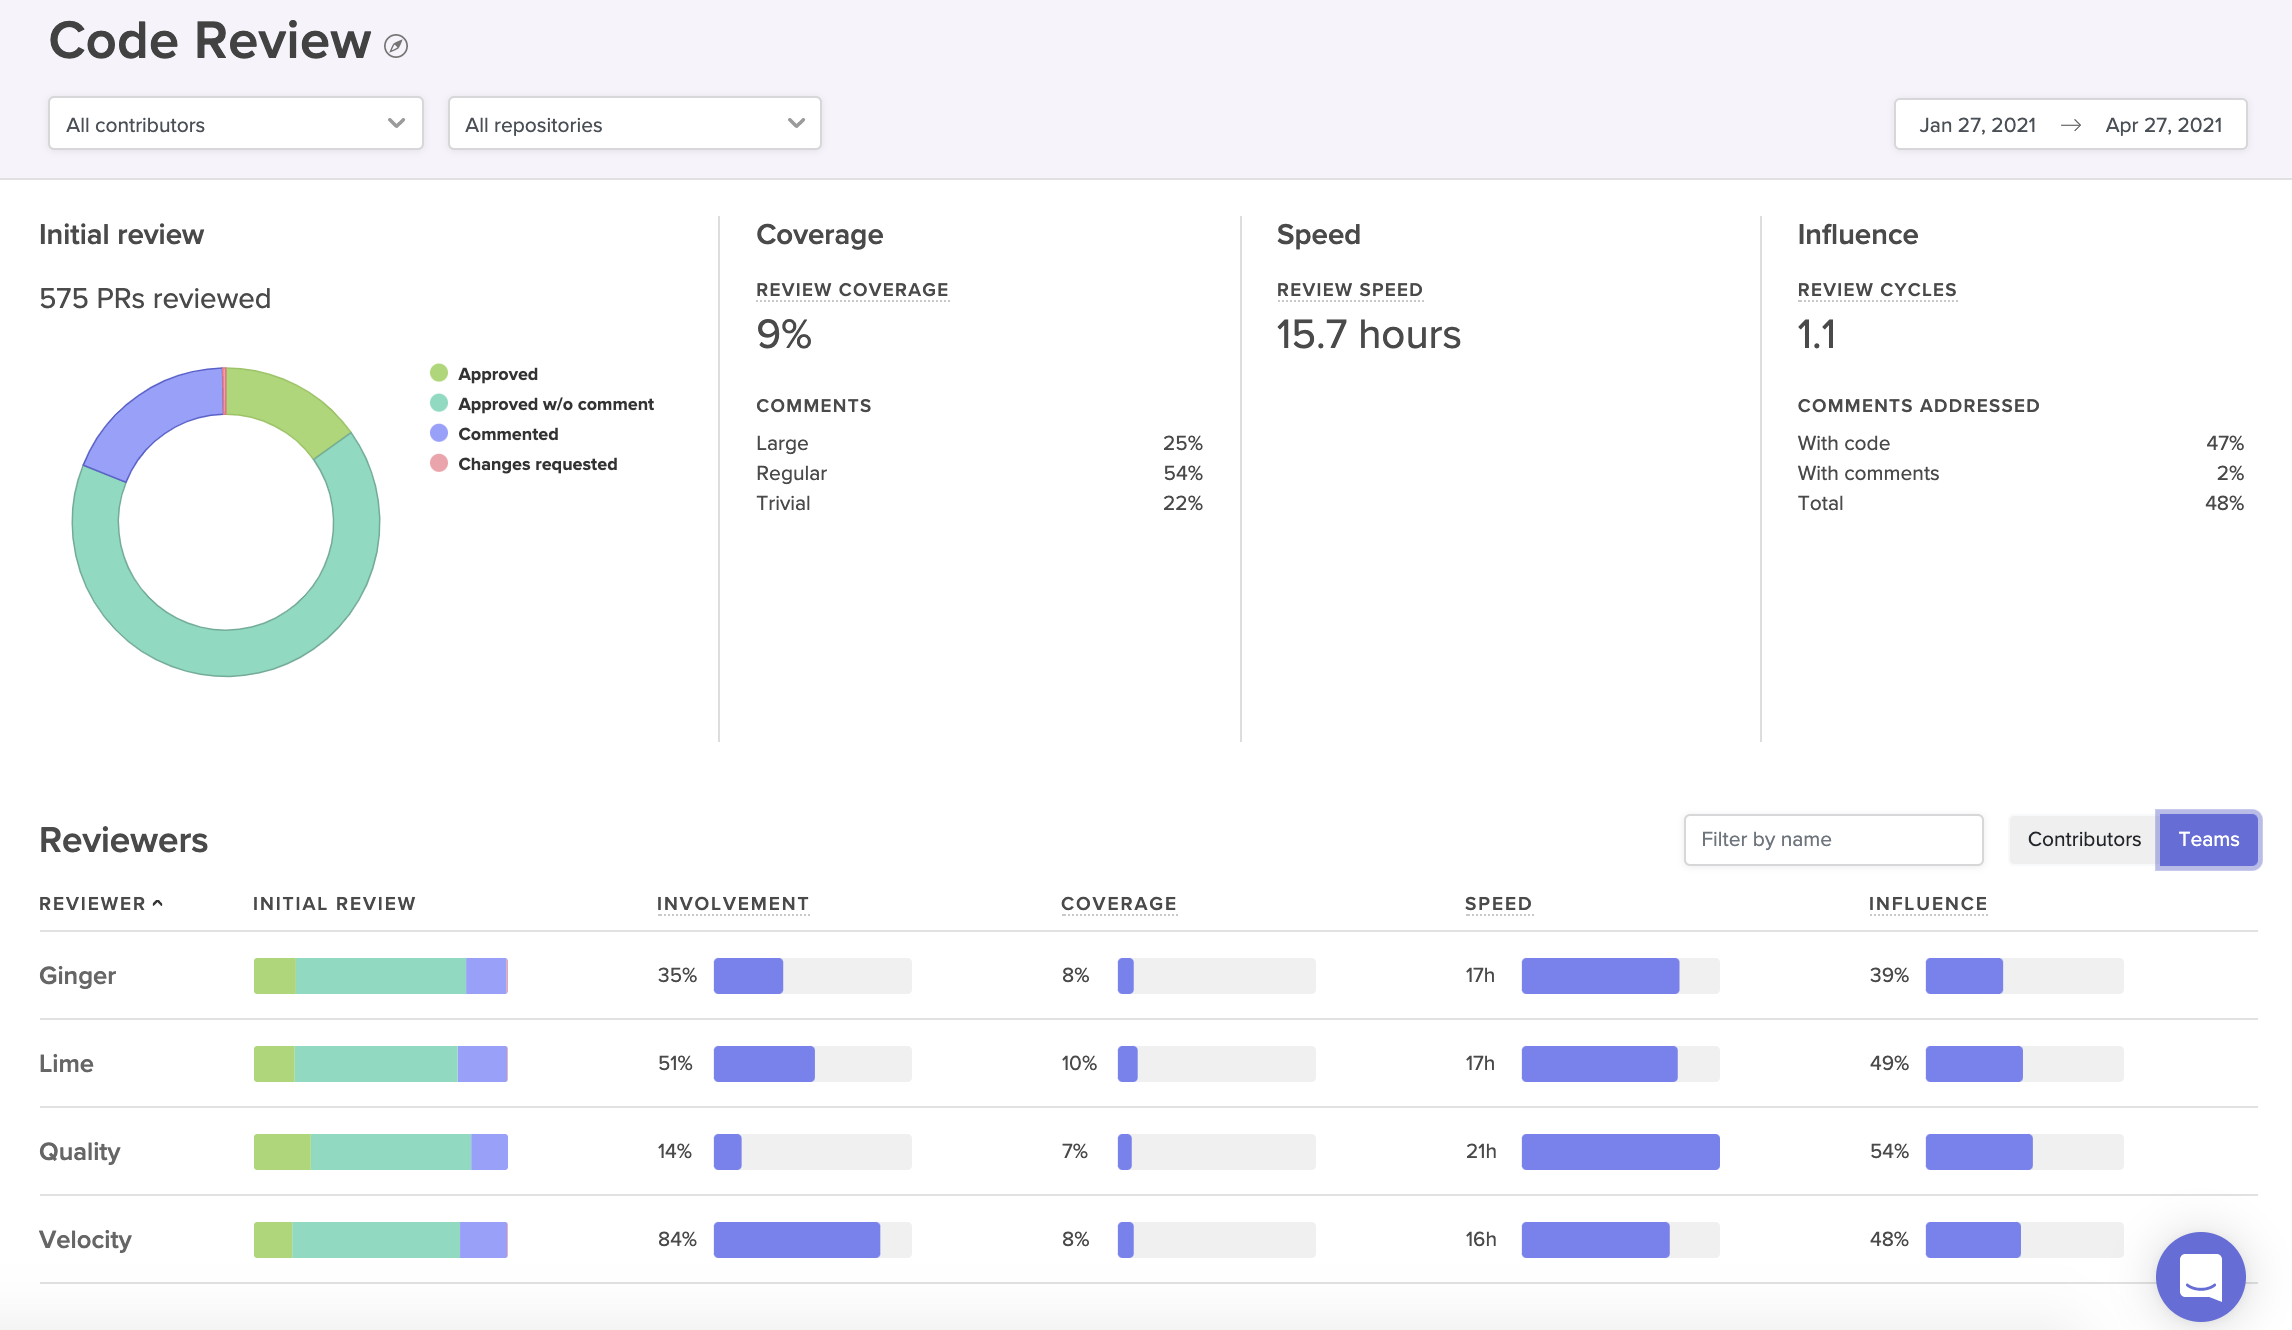
A Code Review Report provides a visual summary of the way PRs move through your review process.
For example, some globally distributed teams prefer to allow low-impact changes to bypass the review process entirely, rather than waiting around to be approved by teammates in different timezones. One Code Climate customer dealt with a Code Review bottleneck by letting pair-programmed PRs skip review — these PRs are already well-vetted, because they’ve been worked over by two developers. This change, among others, helped the customer decrease their Cycle Time by 35% within 10 months of implementing Code Climate's Software Engineering Intelligence (SEI) solution and becoming a data-driven engineering organization.
- Look at change over time. Data makes it possible to compare your current progress to past trends. Not only will you be able to tell if your team is, in fact, moving more slowly, you’ll have the information you need to investigate each phase of development and identify the source of the slowdown. A team in the midst of a transition, like a hiring push or a switch to remote work, might find this kind of comparison to be particularly useful. Looking at key metrics before and after a big change can make it easier to identify which parts of the process are most impacted by the change and therefore most in need of attention.
Visualize trends in the way your team is working.
La Haus started using Code Climate's solution to investigate a general feeling that their newly-remote engineering team was moving slowly. As Co-Founder and CTO Santiago García explains, “you can’t make decisions with a feeling.” You can, however, guide decisions with concrete data. García was able to leverage Code Climate to identify exactly which metrics were trending in the wrong direction, design improved processes to address those concerns, and then measure their success. Improving inefficient processes more than doubled the team’s engineering speed, and La Haus’s engineers were able to cut their Cycle Time from 72 to 30 hours.
- Find opportunities for improvement upstream. Data allows you to measure and track the impact of small adjustments, some of which may have a big impact on overall productivity and efficiency. A team that’s struggling to keep code moving through Code Review could focus on refining their review process, but should first take a look at some key metrics earlier on in their pipeline. The true source of the bottleneck might not be the review process at all, but something else entirely.
Identify these impactful, early-process issues by looking at metrics like Time to Open and PR Size. Time to Open can help you spot developers who are taking a long time to open a PR, which could be a sign of anything from unclear technical direction, to a lack of time to work in the codebase. A large PR Size may signal a tendency to open large Pull Requests, which can get stuck in even the most efficient development workflow.
- Identify and scale effective processes. Data can make it easier to spot high-performing teams in your organization and determine the reasons for their success. If you look at key metrics for specific parts of the development pipeline, you’ll be able to see where your best teams are at their strongest. From there, you can borrow their most effective practices and adapt them for other engineering teams, making it possible for your teams to learn from each other and contribute to the success of the entire department.
See where each team excels in relation to the rest of your organization.
Roger Deetz used this strategy successfully at Springbuk. When he joined the company as VP of Engineering, he used Code Climate's solution to identify and replicate the practices of the most effective teams, ultimately boosting PR throughput by 64%. “Measurement helped us find focus. We saw what agile practices were working and shared them across teams.”
- Help individual engineers get unstuck. Data enables a granularity and immediacy that isn’t possible through stand ups and sporadic check-ins. With the proper tools, you can quickly surface at-risk work and step in with the appropriate support before it becomes a true bottleneck. For example, with Code Climate's solution you can spot a developer who is churning, or one with a long-running PR, and help them get moving again, perhaps by clearing up a confusion with the codebase, or removing a roadblock caused by a third party.
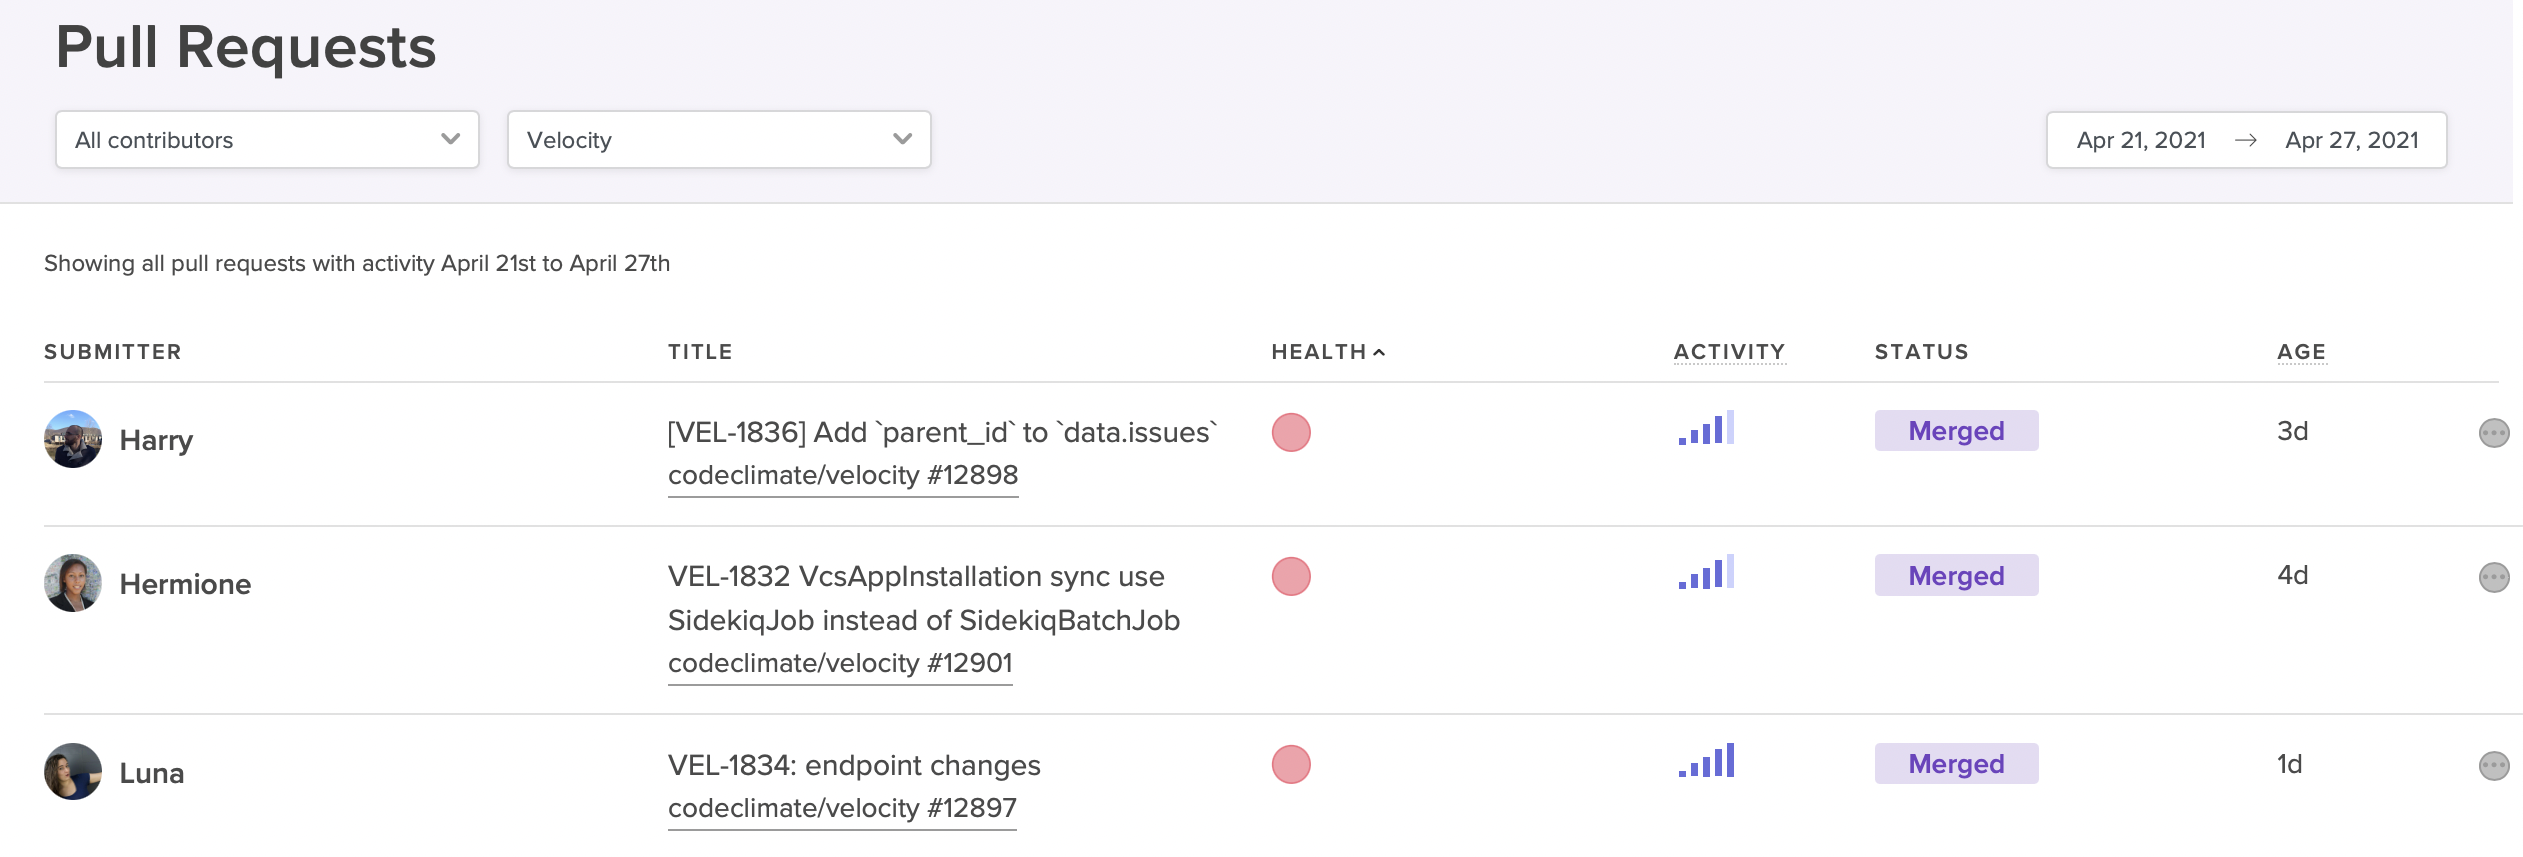
View at-risk PRs that might derail your sprint.
Prioritize Unblocking Engineers With A Dedicated Team
Product features and fixes tend to get prioritized over the critical work of improving developer productivity and experience. In order to ensure that a department is making the necessary investment in removing bottlenecks and improving overall efficiency, many leaders, especially those in large organizations, will give the responsibility to a designated team or individual. The exact title or team name may vary — “developer experience team” is common — but the mandate is usually to help improve developer experience (and, as a result, improve developer productivity) by solving problems that frustrate developers and slow down development. This can be anything from standardizing tooling to implementing code review best practices to improving new developer onboarding, and it includes the very important work of helping teams identify and dismantle common bottlenecks.
Remove Blockers By Empowering Developers
Whether or not they have a team or individual responsible for developer experience, the most successful engineering leaders will still ensure that all team members have some involvement in the process of spotting and removing bottlenecks. At the most basic level, you’ll need to involve your team members to contextualize quantitative information. Data is not diagnostic, and though it can point you in the right direction, it’s impossible to know exactly what is happening without talking to your team members.
Your team members will be even more invested if given the opportunity to propose process improvements and take some ownership of their implementation. This collaborative approach ensures that developers understand why certain changes are being made, that they’re on board with new processes from the start, and that they have a vested interest in sticking with them.
As teams work together to remove blockers and optimize processes, each improvement will motivate further improvements. You’ll set a critical engineering flywheel in motion, setting off the Virtuous Circle of Software Delivery, in which developers reap the benefits of improved processes and are motivated to keep seeking opportunities for continued growth and success.
With fewer blockers standing in their way, developers will be happier, more productive, and more likely to excel — and you’ll be one step closer to building a high-performance team.
To find out how Code Climate can provide the data you need to remove bottlenecks from your engineering pipeline, request a consultation.

Engineering leaders looking to drive high performance and achieve Continuous Delivery often hear that metrics are the answer.
With metrics, it’s possible to objectively evaluate your team’s progress, measure it against industry benchmarks, and set targets for improvement.
But how should metrics be used? If you’re looking to translate Continuous Delivery ideals into actual practices and processes, where should you start?
In this free, 30-minute on-demand webinar, Code Climate Engineering Data Specialist, Nico Snyder, explains how Velocity metrics can help you implement Continuous Delivery best practices on your team.
He offers actionable strategies for:
- Identifying the metrics that matter most in your organization
- Using metrics to understand where your team stands
- Setting quantitative targets and driving progress towards those goals
To find out more about how engineering metrics can help your team, reach out to one of our product specialists.