Resources & Insights
Featured Article
Navigating the world of software engineering or developer productivity insights can feel like trying to solve a complex puzzle, especially for large-scale organizations. It's one of those areas where having a cohesive strategy can make all the difference between success and frustration. Over the years, as I’ve worked with enterprise-level organizations, I’ve seen countless instances where a lack of strategy caused initiatives to fail or fizzle out.
In my latest webinar, I breakdown the key components engineering leaders need to consider when building an insights strategy.
Why a Strategy Matters
At the heart of every successful software engineering team is a drive for three things:
- A culture of continuous improvement
- The ability to move from idea to impact quickly, frequently, and with confidence
- A software organization delivering meaningful value
These goals sound simple enough, but in reality, achieving them requires more than just wishing for better performance. It takes data, action, and, most importantly, a cultural shift. And here's the catch: those three things don't come together by accident.
In my experience, whenever a large-scale change fails, there's one common denominator: a lack of a cohesive strategy. Every time I’ve witnessed a failed attempt at implementing new technology or making a big shift, the missing piece was always that strategic foundation. Without a clear, aligned strategy, you're not just wasting resources—you’re creating frustration across the entire organization.
Sign up for a free, expert-led insights strategy workshop for your enterprise org.
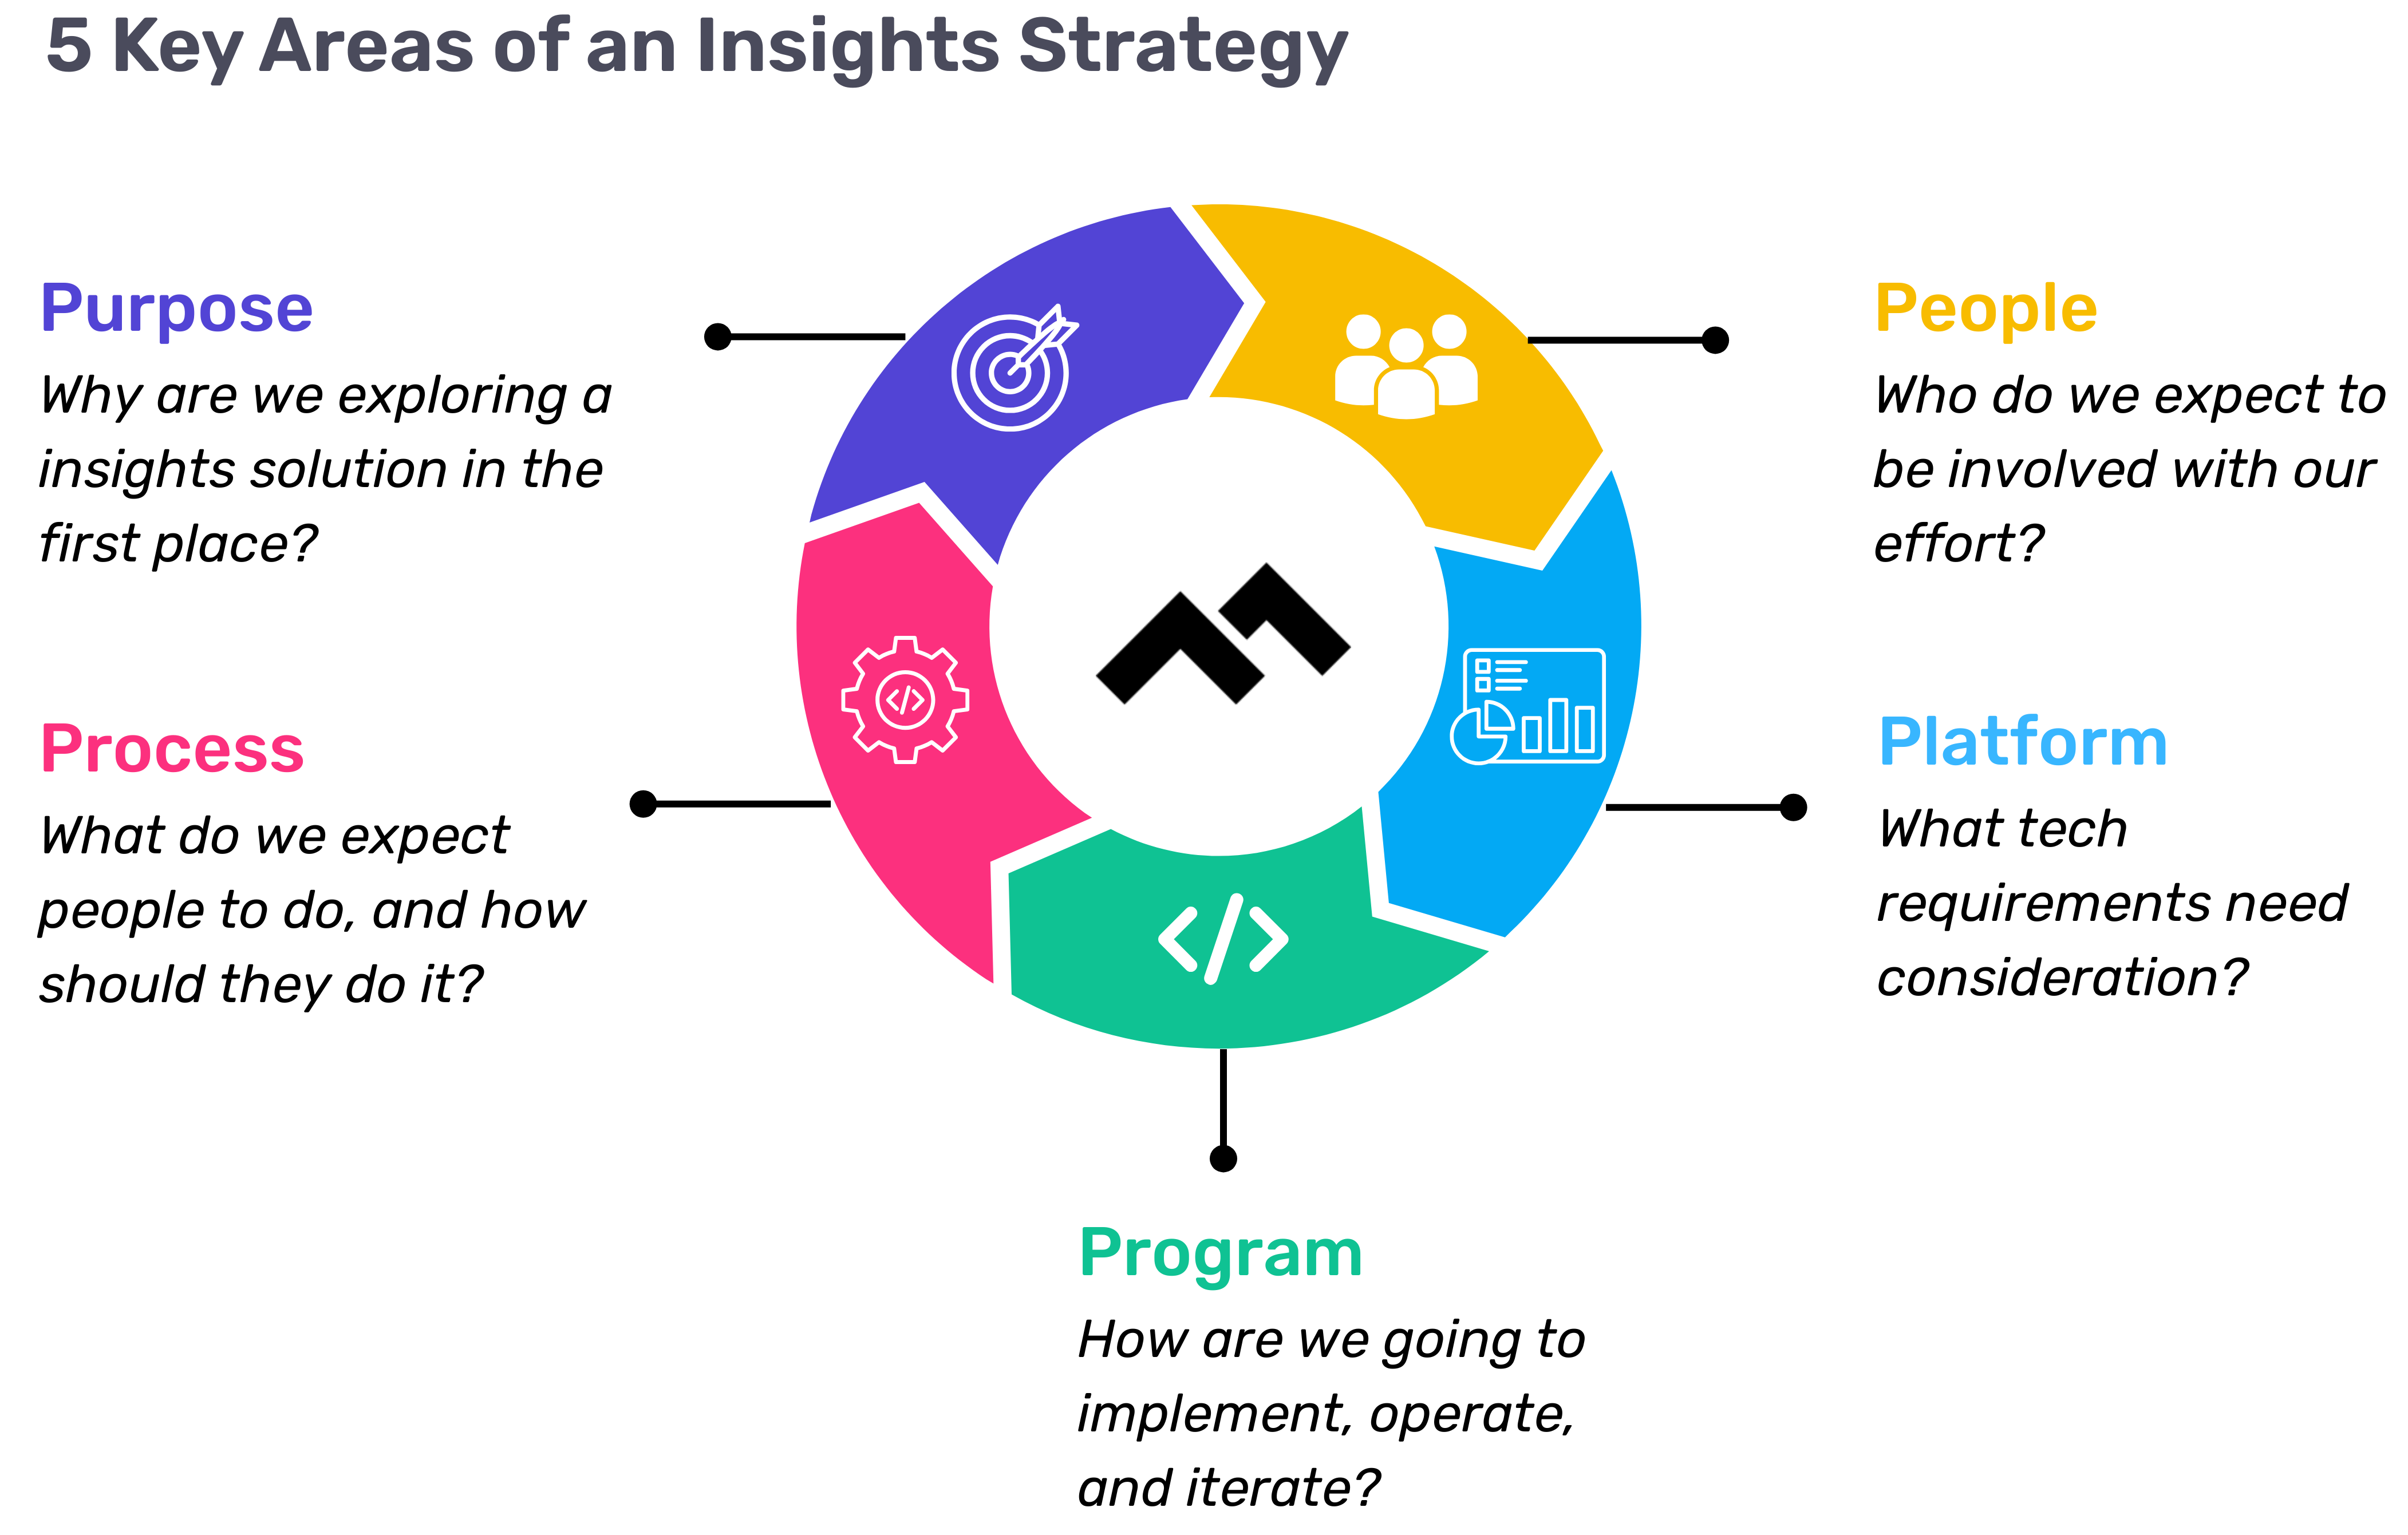
Step 1: Define Your Purpose
The first step in any successful engineering insights strategy is defining why you're doing this in the first place. If you're rolling out developer productivity metrics or an insights platform, you need to make sure there’s alignment on the purpose across the board.
Too often, organizations dive into this journey without answering the crucial question: Why do we need this data? If you ask five different leaders in your organization, are you going to get five answers, or will they all point to the same objective? If you can’t answer this clearly, you risk chasing a vague, unhelpful path.
One way I recommend approaching this is through the "Five Whys" technique. Ask why you're doing this, and then keep asking "why" until you get to the core of the problem. For example, if your initial answer is, “We need engineering metrics,” ask why. The next answer might be, “Because we're missing deliverables.” Keep going until you identify the true purpose behind the initiative. Understanding that purpose helps avoid unnecessary distractions and lets you focus on solving the real issue.
Step 2: Understand Your People
Once the purpose is clear, the next step is to think about who will be involved in this journey. You have to consider the following:
- Who will be using the developer productivity tool/insights platform?
- Are these hands-on developers or executives looking for high-level insights?
- Who else in the organization might need access to the data, like finance or operations teams?
It’s also crucial to account for organizational changes. Reorgs are common in the enterprise world, and as your organization evolves, so too must your insights platform. If the people responsible for the platform’s maintenance change, who will ensure the data remains relevant to the new structure? Too often, teams stop using insights platforms because the data no longer reflects the current state of the organization. You need to have the right people in place to ensure continuous alignment and relevance.
Step 3: Define Your Process
The next key component is process—a step that many organizations overlook. It's easy to say, "We have the data now," but then what happens? What do you expect people to do with the data once it’s available? And how do you track if those actions are leading to improvement?
A common mistake I see is organizations focusing on metrics without a clear action plan. Instead of just looking at a metric like PR cycle times, the goal should be to first identify the problem you're trying to solve. If the problem is poor code quality, then improving the review cycle times might help, but only because it’s part of a larger process of improving quality, not just for the sake of improving the metric.
It’s also essential to approach this with an experimentation mindset. For example, start by identifying an area for improvement, make a hypothesis about how to improve it, then test it and use engineering insights data to see if your hypothesis is correct. Starting with a metric and trying to manipulate it is a quick way to lose sight of your larger purpose.
Step 4: Program and Rollout Strategy
The next piece of the puzzle is your program and rollout strategy. It’s easy to roll out an engineering insights platform and expect people to just log in and start using it, but that’s not enough. You need to think about how you'll introduce this new tool to the various stakeholders across different teams and business units.
The key here is to design a value loop within a smaller team or department first. Get a team to go through the full cycle of seeing the insights, taking action, and then quantifying the impact of that action. Once you've done this on a smaller scale, you can share success stories and roll it out more broadly across the organization. It’s not about whether people are logging into the platform—it’s about whether they’re driving meaningful change based on the insights.
Step 5: Choose Your Platform Wisely
And finally, we come to the platform itself. It’s the shiny object that many organizations focus on first, but as I’ve said before, it’s the last piece of the puzzle, not the first. Engineering insights platforms like Code Climate are powerful tools, but they can’t solve the problem of a poorly defined strategy.
I’ve seen organizations spend months evaluating these platforms, only to realize they didn't even know what they needed. One company in the telecom industry realized that no available platform suited their needs, so they chose to build their own. The key takeaway here is that your platform should align with your strategy—not the other way around. You should understand your purpose, people, and process before you even begin evaluating platforms.
Looking Ahead
To build a successful engineering insights strategy, you need to go beyond just installing a tool. An insights platform can only work if it’s supported by a clear purpose, the right people, a well-defined process, and a program that rolls it out effectively. The combination of these elements will ensure that your insights platform isn’t just a dashboard—it becomes a powerful driver of change and improvement in your organization.
Remember, a successful software engineering insights strategy isn’t just about the tool. It’s about building a culture of data-driven decision-making, fostering continuous improvement, and aligning all your teams toward achieving business outcomes. When you get that right, the value of engineering insights becomes clear.
Want to build a tailored engineering insights strategy for your enterprise organization? Get expert recommendations at our free insights strategy workshop. Register here.Register here.
Andrew Gassen has guided Fortune 500 companies and large government agencies through complex digital transformations. He specializes in embedding data-driven, experiment-led approaches within enterprise environments, helping organizations build a culture of continuous improvement and thrive in a rapidly evolving world.
Navigating the world of software engineering or developer productivity insights can feel like trying to solve a complex puzzle, especially for large-scale organizations. It's one of those areas where having a cohesive strategy can make all the difference between success and frustration. Over the years, as I’ve worked with enterprise-level organizations, I’ve seen countless instances where a lack of strategy caused initiatives to fail or fizzle out.
In my latest webinar, I breakdown the key components engineering leaders need to consider when building an insights strategy.
Why a Strategy Matters
At the heart of every successful software engineering team is a drive for three things:
- A culture of continuous improvement
- The ability to move from idea to impact quickly, frequently, and with confidence
- A software organization delivering meaningful value
These goals sound simple enough, but in reality, achieving them requires more than just wishing for better performance. It takes data, action, and, most importantly, a cultural shift. And here's the catch: those three things don't come together by accident.
In my experience, whenever a large-scale change fails, there's one common denominator: a lack of a cohesive strategy. Every time I’ve witnessed a failed attempt at implementing new technology or making a big shift, the missing piece was always that strategic foundation. Without a clear, aligned strategy, you're not just wasting resources—you’re creating frustration across the entire organization.
Sign up for a free, expert-led insights strategy workshop for your enterprise org.
Step 1: Define Your Purpose
The first step in any successful engineering insights strategy is defining why you're doing this in the first place. If you're rolling out developer productivity metrics or an insights platform, you need to make sure there’s alignment on the purpose across the board.
Too often, organizations dive into this journey without answering the crucial question: Why do we need this data? If you ask five different leaders in your organization, are you going to get five answers, or will they all point to the same objective? If you can’t answer this clearly, you risk chasing a vague, unhelpful path.
One way I recommend approaching this is through the "Five Whys" technique. Ask why you're doing this, and then keep asking "why" until you get to the core of the problem. For example, if your initial answer is, “We need engineering metrics,” ask why. The next answer might be, “Because we're missing deliverables.” Keep going until you identify the true purpose behind the initiative. Understanding that purpose helps avoid unnecessary distractions and lets you focus on solving the real issue.
Step 2: Understand Your People
Once the purpose is clear, the next step is to think about who will be involved in this journey. You have to consider the following:
- Who will be using the developer productivity tool/insights platform?
- Are these hands-on developers or executives looking for high-level insights?
- Who else in the organization might need access to the data, like finance or operations teams?
It’s also crucial to account for organizational changes. Reorgs are common in the enterprise world, and as your organization evolves, so too must your insights platform. If the people responsible for the platform’s maintenance change, who will ensure the data remains relevant to the new structure? Too often, teams stop using insights platforms because the data no longer reflects the current state of the organization. You need to have the right people in place to ensure continuous alignment and relevance.
Step 3: Define Your Process
The next key component is process—a step that many organizations overlook. It's easy to say, "We have the data now," but then what happens? What do you expect people to do with the data once it’s available? And how do you track if those actions are leading to improvement?
A common mistake I see is organizations focusing on metrics without a clear action plan. Instead of just looking at a metric like PR cycle times, the goal should be to first identify the problem you're trying to solve. If the problem is poor code quality, then improving the review cycle times might help, but only because it’s part of a larger process of improving quality, not just for the sake of improving the metric.
It’s also essential to approach this with an experimentation mindset. For example, start by identifying an area for improvement, make a hypothesis about how to improve it, then test it and use engineering insights data to see if your hypothesis is correct. Starting with a metric and trying to manipulate it is a quick way to lose sight of your larger purpose.
Step 4: Program and Rollout Strategy
The next piece of the puzzle is your program and rollout strategy. It’s easy to roll out an engineering insights platform and expect people to just log in and start using it, but that’s not enough. You need to think about how you'll introduce this new tool to the various stakeholders across different teams and business units.
The key here is to design a value loop within a smaller team or department first. Get a team to go through the full cycle of seeing the insights, taking action, and then quantifying the impact of that action. Once you've done this on a smaller scale, you can share success stories and roll it out more broadly across the organization. It’s not about whether people are logging into the platform—it’s about whether they’re driving meaningful change based on the insights.
Step 5: Choose Your Platform Wisely
And finally, we come to the platform itself. It’s the shiny object that many organizations focus on first, but as I’ve said before, it’s the last piece of the puzzle, not the first. Engineering insights platforms like Code Climate are powerful tools, but they can’t solve the problem of a poorly defined strategy.
I’ve seen organizations spend months evaluating these platforms, only to realize they didn't even know what they needed. One company in the telecom industry realized that no available platform suited their needs, so they chose to build their own. The key takeaway here is that your platform should align with your strategy—not the other way around. You should understand your purpose, people, and process before you even begin evaluating platforms.
Looking Ahead
To build a successful engineering insights strategy, you need to go beyond just installing a tool. An insights platform can only work if it’s supported by a clear purpose, the right people, a well-defined process, and a program that rolls it out effectively. The combination of these elements will ensure that your insights platform isn’t just a dashboard—it becomes a powerful driver of change and improvement in your organization.
Remember, a successful software engineering insights strategy isn’t just about the tool. It’s about building a culture of data-driven decision-making, fostering continuous improvement, and aligning all your teams toward achieving business outcomes. When you get that right, the value of engineering insights becomes clear.
Want to build a tailored engineering insights strategy for your enterprise organization? Get expert recommendations at our free insights strategy workshop. Register here.Register here.
Andrew Gassen has guided Fortune 500 companies and large government agencies through complex digital transformations. He specializes in embedding data-driven, experiment-led approaches within enterprise environments, helping organizations build a culture of continuous improvement and thrive in a rapidly evolving world.
All Articles

Engineering is an expensive department. And given that global circumstances are cinching purse strings even tighter, it’s never been more important for a CTO to track and optimize where the money is going.
In this 45-minute webinar, Code Climate Engineering Data Specialist, Bob Brown, talks about how to use data-driven insights to build a leaner process at scale and get the intended ROI from your organization.
Bob covers how to dig into engineering data from Velocity to answer questions like:
- How does our Time to Market compare to industry standards?
- Why does engineering typically get blocked? What process changes can we make to eliminate bottlenecks?
- What are the distinguishing characteristics of our strongest teams, and how can we replicate them at scale?
To uncover your own data-driven insights, request a demo of Velocity.
To create a culture that both motivates engineers and improves their ability to drive innovation, managers need a comprehensive picture of where their team members are succeeding and where they can improve.
In this 45-minute webinar, Code Climate Engineering Data Specialist, Nico Snyder, talks about how to create measurable improvement (20% or more) in Cycle Time and team performance with holistic visibility into engineering work.
Nico covers how to dig into data from Velocity’s newest features to answer questions like:
- How are teams or developers performing? How do we improve?
- How do we drive continuous improvement across engineering processes?
- How do we communicate engineering success both within the department and to others in the organization?
If you’re not already using Velocity, you can request a demo here.
While most board decks will include business metrics like ARR, churn rates, and cash in the bank, these metrics only provide a snapshot of business health. They don’t speak to the strategic priority of how you plan to deliver real value. They also don’t illustrate engineering’s ability to execute on product timelines.
In this 30-minute webinar, Alexandra Paredes, VP of Engineering at Code Climate, runs through her method of communicating with technical and non-technical stakeholders in the board room. She covers:
- Representing both the speed and direction of your engineering department’s work
- Summarizing engineering challenges and opportunities
- Visualizing improvement against OKRs quarter over quarter
Armed with this framework, an engineering leader can illustrate the importance of their department and engage senior leadership on the best way to endure and thrive during these unprecedented times.
To incorporate this data into your own board deck, request a demo of Velocity.
It’s impossible to step into technical leadership fully prepared. The most successful technical leaders are always supplementing their own hard-earned expertise with the wisdom of others, drawing on the experiences of their peers and predecessors.
Over the past year, we’ve been speaking to engineering leaders from a range of industries, seeking out their advice on everything from fostering a strong company culture to helping your developers avoid burnout.
Now, for the first time ever, we’re making that collective knowledge available in one place.
It’s our inaugural Leadership Development Month – a December packed with resources for everyone from seasoned VPs to soon-to-be Engineering Managers. All of this year’s webinars and virtual events are now available on-demand, supplemented with blog posts and e-books, all aimed at helping you hone your leadership skills and build a high-performance engineering team.
Check out the materials below, and start preparing to be a stronger leader in 2021. There’s more to come, so be sure to subscribe to our newsletter and follow us on Twitter and LinkedIn for updates.
Data-Driven Leadership
- Roger Deetz, VP of Technology at Springbuk – Using Metrics to Reinforce Company Culture [Fireside Chat]
- Ale Paredes, VP of Engineering at Code Climate – Managing with Metrics [Fireside Chat]
- Juan Pablo Buriticá, Head of Engineering, LatAm at Stripe – Delivery Metrics [Fireside Chat]
- Edith Harbaugh, CEO and Co-Founder of LaunchDarkly – Continuous Improvement [Fireside Chat]
- The Moneyball Approach to Engineering Metrics [Blog Post]
- The Essential Data for Leading a Remote Engineering Team [Blog Post]
- How Our VP of Engineering Used Data to Support Our Engineering Team on a Human Level [Blog Post]
- So You Read Accelerate. Now What? [Blog Post]
Cycle Time: The Most Critical Metric
- The Engineering Leader’s Guide to Cycle Time [E-book]
- Perspectives on Cycle Time [Round Table]
- What is Cycle Time and Why Does it Matter? [Blog Post]
- The Virtuous Circle of Software Delivery [Blog Post]
- The Single Greatest Lever in Shortening Cycle Time [Blog Post]
- How to Stop Code Review from Bottlenecking Shipping [Blog Post]
- Keep Code Review from Wasting Everyone’s Time [Blog Post]
- The Last Mile to True Continuous Delivery [Blog Post]
Communicating with Executive Stakeholders
- What Your Engineering Board Slides are Missing [Webinar]
- How to Build a Leaner Process and Boost Your Engineering ROI [Webinar]
- Engineering Metrics are Business Metrics [Blog Post]
- Startup CEOs: Here’s Good News You Can Include in Your Q4 Board Deck [Blog Post]
- How to Choose Software Development KPIs for Your Board Deck [Blog Post]
- Hire People or Optimize Processes: A Cost-Benefit Analysis for Engineering Leaders [Blog Post]
- Hire or Optimize [Calculator]
Running Effective Meetings
- Running Remote Meetings with Data [Webinar]
- How 5 Minutes of Preparation Can Finally Make Standup Meetings Productive [Blog Post]
- Why Retro Action Items Fail (And What to Do About It) [Blog Post]
Leading High-Performance Teams
- Katie Womersley, VP of Engineering at Buffer – Be a Leader and a Manager [Fireside Chat]
- Dr. Aneika Simmons, PhD, and Anjuan Simmons, Technology Translator – Preventing and Addressing Burnout [Fireside Chat]
- Measure and Improve How You Innovate [Round Table]
- Developer360: Building a High-Performance Team with Data [Webinar]
- You Can’t Set Effective Engineering Goals Without Data [Blog Post]
Debugging Processes
Innovation is critical to startup success. To satisfy your customers, stay ahead of your competition, and keep your team engaged, you need to be shipping often — and at high quality.
But how can engineering departments measure and improve their ability to innovate?
With the right data, you can streamline processes and unblock your engineers, clearing the way for developers to work on fresh ideas and deliver new value to your customers.
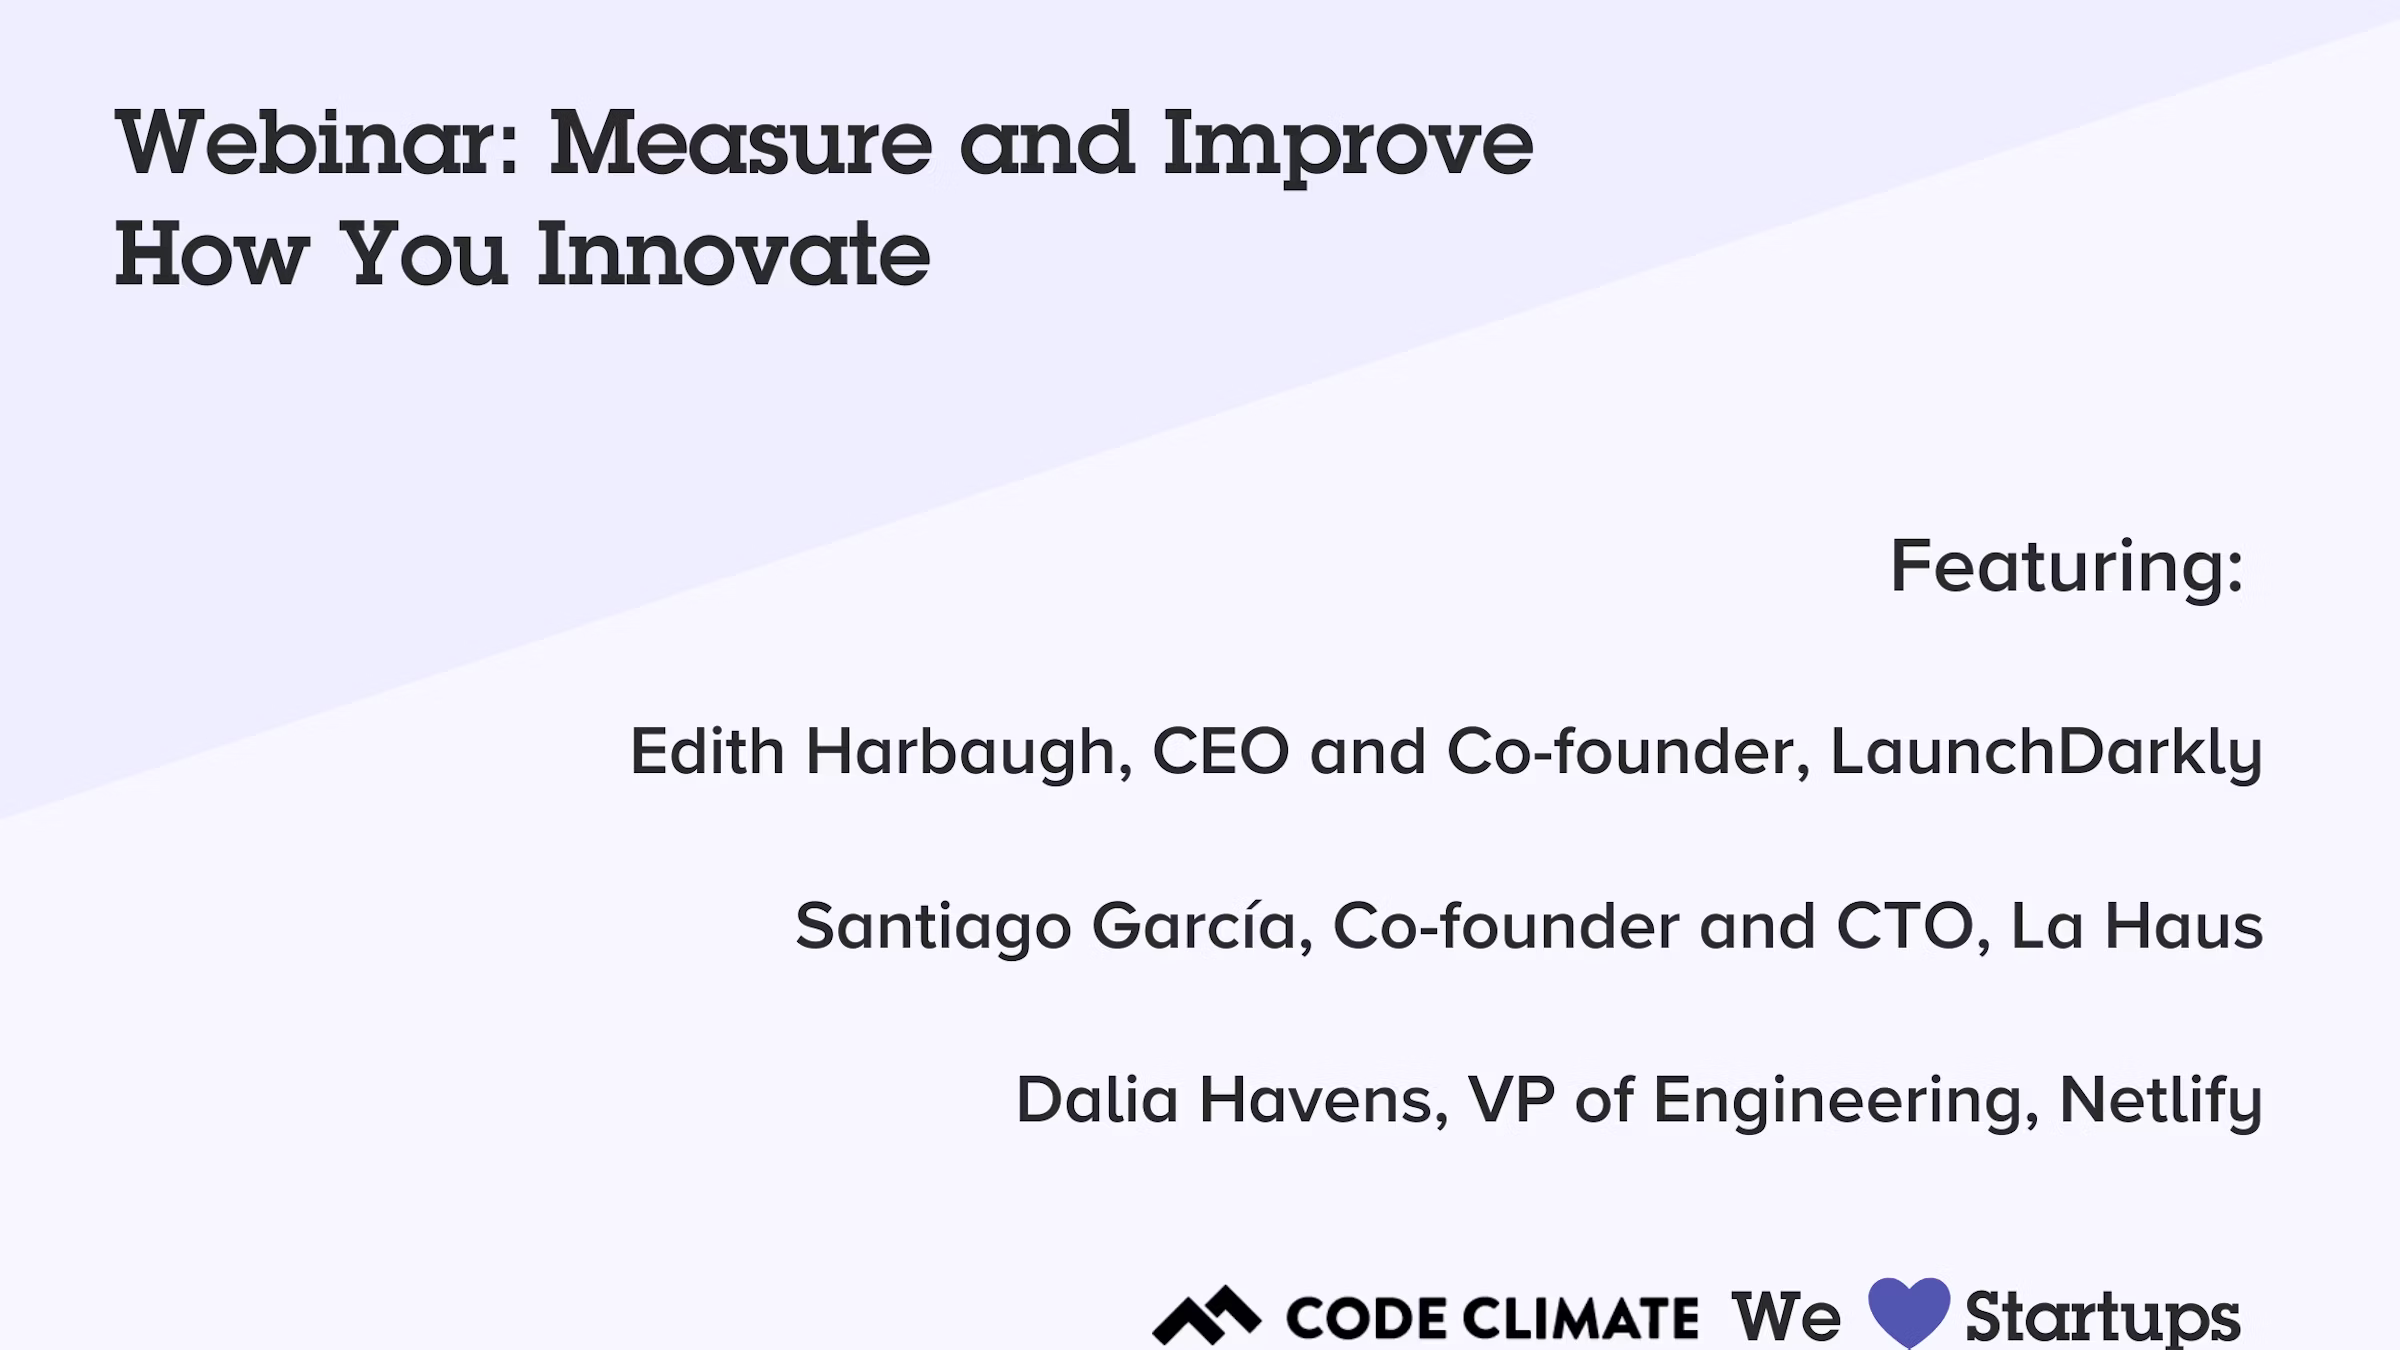
In this 45-minute webinar, three startup leaders share how they use data to boost innovation on their engineering teams. You’ll hear from:
- Edith Harbaugh, CEO and Co-founder, LaunchDarkly
- Santiago García, Co-founder and CTO, La Haus
- Dalia Havens, VP of Engineering, Netlify
Here are some of the key takeaways:
Innovation requires iteration.
Edith Harbaugh: One of the things that really helped us innovate is we just had more swings at bat. If you’re in a cadence where you can release not every year, which is incredibly stale if you’re in the app store, but every month, or every week, and then do backend updates so you can update hourly – you’re going to win. ‘Cause part of the fact is that not everything you do is going to be perfect. But you just have to keep swinging and swinging and swinging, and one of those things is going to land.
Dalia Havens: One of the things I love about the way at Netlify we define innovation is that we focus on the simplicity of the solution to these complex problems…It’s about those quick iterations. It’s a learning journey. And it’s really hard to figure out which path will take you to the right solution if you’re not iterating.
Santiago García: To bring you some context, [La Haus is] in Latin America. So in this market, we have to invent actually everything. We don’t have [real estate] databases, like you in the US have…From here, we have to create everything from scratch. And that means you need to start to create everything with a good pace, with very fast experimenting because there are things that you don’t know.
Building a metrics-driven culture.
Dalia Havens: [Metrics] are operational measures. They are not punitive, they are very much a tool to help us improve at the end of the day.
Part of my responsibility is to create a quality of life for developers to do their best work. How are we measuring that? How are we removing roadblocks? How are we identifying that there was a roadblock? That’s where the data comes in. And when you bake it into the culture and not make it a taboo to talk about or hide it from this stakeholder or not communicate the incentive behind it, it creates a different shift…creating that metrics-driven culture is actually really important for the success of using metrics in your organization.
Edith Harbaugh: I think you really need to have metrics that people buy into in terms of, “How often do we ship?” because that means that I can feel pride that my code is out there. “How often are we able to roll back?” because that means that I can feel confidence.
Santiago García: What I think about it is what Peter Drucker said — “What you don’t measure, you can’t improve.” And that’s very important, that is very cultural. You can give feedback based on metrics, and people [can] feel comfortable with that. At La Haus, we have two values at the company…We have one that is, “Strive for more.” People want to improve, so it’s good to show the metrics, so they can see they are doing things [that] could have been better. Also, we have something that is called, “Extreme openness.” When you are open to feedback…you can take your data and make these data-informed decisions. For me, it’s very cultural.
Data provides objective insights.
Santiago García: When we started working remotely, some engineers started to complain — not complain, but they started to say, “Hey, we’re working more hours, we are exhausted, we have been working more.” My feeling was that we were delivering the same amount of work or less. But in that moment, I couldn’t measure [that feeling]. The first decision was to start measuring that, so I started using Code Climate.
Edith Harbaugh: When you get bigger, you just have to get a lot more deliberate about communication and about what you’re measuring and how teams work together. And then also still make sure that you are measuring, “Are we moving forward? Are we having meetings for the sake of having meetings?” So one question that the engineering side has to understand is, “How much new versus old features are you doing?” Like tech debt versus new, which is a really tricky balance. If it swings too far in either direction, you know that you’re going amiss. If 80% of my time is on maintenance, you’re not innovating. If 100% of my time is on innovation, and I’m not doing any code maintenance, stuff is going to start breaking in the field. So just keeping a close eye on metrics like that, in terms of “Does the team have the right pressure and direction?”
Dalia Havens: I fell in love with metrics because…through this organic journey to engineering management, I found that a lot of times without them, it’s a gut-feel conversation. And those are really hard to have without it seeming personal or you’re saying that someone is not putting in more hours or the right level of effort and so on. So what metrics have allowed us to do is sort of come objectively to the conversation. We are all trying to remove these roadblocks that are getting in your way and so on.
Transparency is critical.
Santiago García: [Transparency is] very important…I went with my team in a one hour meeting, I showed them the tool, how we are going to measure the process. And this was very clear, it was to improve the process. It was not going in a very punitive way or something like that. We wanted to improve our process, and everyone wants to improve. Actually, the next day, all the engineers were asking me for access to the tools so they could see their metrics and how they could improve them.
Dalia Havens: I’ve had an experience with an established team where it…the team was not talking about them being blocked to ship. And it was because we had metrics that we could see our week-to-week trend. And we’re like, “This is weird. For some reason, all of a sudden, we are not able to get things to production. Let’s talk about it.” So I found that it’s a really, really great way to be transparent and honest with everyone on the team. And also disarms sort of that tension. Because at the end of the day, just like all the the monitoring tools we have in infra, it’s to allow us to improve and iterate and create a better environment for development.
Innovation can be game-changing or destructive — make sure you’re moving in the right direction.
Edith Harbaugh: I think innovation in and of itself is a hard word. I think there’s the bright shiny answer that innovation is game-changing stuff that moves the business forward. The flip of that coin is innovation is sometimes harmful and destructive. And you don’t really know sometimes until you flip that coin, what way it’s going to land.
Dalia Havens: A product full of bells and whistles that are not really giving a seamless user experience is not going to be as effective or as useful to the potential end-user as one that is more thought out…Innovation is a big word for us. What I translate that to is iteration. Are we able to iterate? Are we able to learn? Do we have the tools to be able to learn to gradually get things out, or to decide on killing something? …having these tools allows the team to really define what is success or how are they working toward that success metric.
Santiago García: I think is very difficult to innovate in the tech team if you are not aligning with your business, with your customers…For my team, the engineering team, its mission is to deliver value to our customers as fast as we can, with the best quality.
To learn how to start gathering insights from your own data, request a consultation.

When teams go remote, the function of meetings changes. Lacking context, team members end up using meetings to play catch-up rather than to discuss and make critical improvements.
In this 45-minute webinar, Code Climate Co-Founder Noah Davis discusses how leaders can use data to better support their remote teams. He explains how to dig into engineering data from Velocity reports to get your team on the same page and keep meetings focused and productive.
You’ll learn how to use:
- Stand-ups to unblock engineers
- Retros to diagnose problems and process fault lines
- 1:1s to give constructive feedback and encourage career development
To start bringing data to your remote meetings, request a demo of Velocity.


What is Cycle Time?
One of the more important metrics we look at for our own engineering team, as well as for the engineering teams using Code Climate's Software Engineering Intelligence (SEI) platform, is Cycle Time. Cycle Time is a rough measure of process speed. We’ll explore the definition in more depth, but first, it’s important to understand…
Why Does Cycle Time Matter?
Cycle Time is engineering’s speedometer. Measuring and improving on Cycle Time can help you innovate faster, outrun your competition, and retain top talent. Cycle Time even has implications beyond engineering — it’s also an important indicator of business success.
And yet, a number of engineering organizations practicing lean and/or agile development seem satisfied having their process be proof enough that they care about speed and are moving quickly. And, yet, these teams are likely not measuring any kind of speed. Or worse, they are using metrics more likely to lead to dysfunction than speed.
Mary and Tom Poppendieck, who popularized the idea of applying lean manufacturing principles to software engineering, discuss this phenomenon, specifically for Cycle Time, in their book Lean Software:
“Software development managers tend to ignore Cycle Time, perhaps because they feel that they are already getting things done as fast as they can. In fact, reducing batch sizes and addressing capacity bottlenecks can reduce Cycle Time quite a bit, even in organizations that consider themselves efficient already.”
In other words, rather than trust your gut that you’re moving as fast as possible, why not supplement your understanding with a quantitative measure? As with other metrics, tracking Cycle Time can reduce bias and provide a trustworthy baseline from which to drive improvement.
Back To: What is the Definition of Cycle Time?
Since the term originates in Lean Manufacturing, where “start” and “end” can be unambiguously defined, it’s not always obvious how to apply it to software engineering. Starting at the end of this process, the delivery, is in some ways the easiest: delivery of software is the deployment of production code.
The beginning of the process is more difficult to define. Asking when software development begins is an almost philosophical question. If you’re doing hypothesis-driven product work and are testing your hypothesis, has work started? In his book Developing Products in Half the Time, to illustrate the inherent ambiguity, Donald Reinertsen calls this phase the “fuzzy front end.”
This is why we tend to see development broken into two phases, design and delivery, where design encapsulates activities prior to writing code. Since the delivery phase has a more regular and reliable cadence — and is more completely within engineering’s control — it’s better suited to regular observation and measurement.1
Here at Code Climate, when we discuss Cycle Time, we’re usually referring to “Code Cycle Time,” which isolates the delivery phase of the software development process.
With that in mind, we define Cycle Time as the period of time during which code is “in-flight.” That period may be slightly different depending on an organization’s workflow. Some engineering teams might define Cycle Time as the time between a developer’s first commit in a section of code and when that code is deployed, while others will find it more useful to track the time from when a commit is first logged to when it is merged.
Ultimately, the goal is to quantify and understand the speed at which an engineering team can deliver working software, so the exact definition of Cycle Time you use is not important, as long as you’re consistent across your organization. The key to measuring Cycle Time is the directionality of the metric. You want an objective picture of how quickly your engineering department is moving, whether it’s getting faster or slower, and how specific teams compare to the rest of the department or others in your industry.
What Can Measuring Cycle Time Do for You?
Measuring and improving Cycle Time will boost your engineering team’s efficiency. You’ll deliver value to your users more quickly, which will shorten the developer-user feedback loop and can help you stay ahead of your competition.
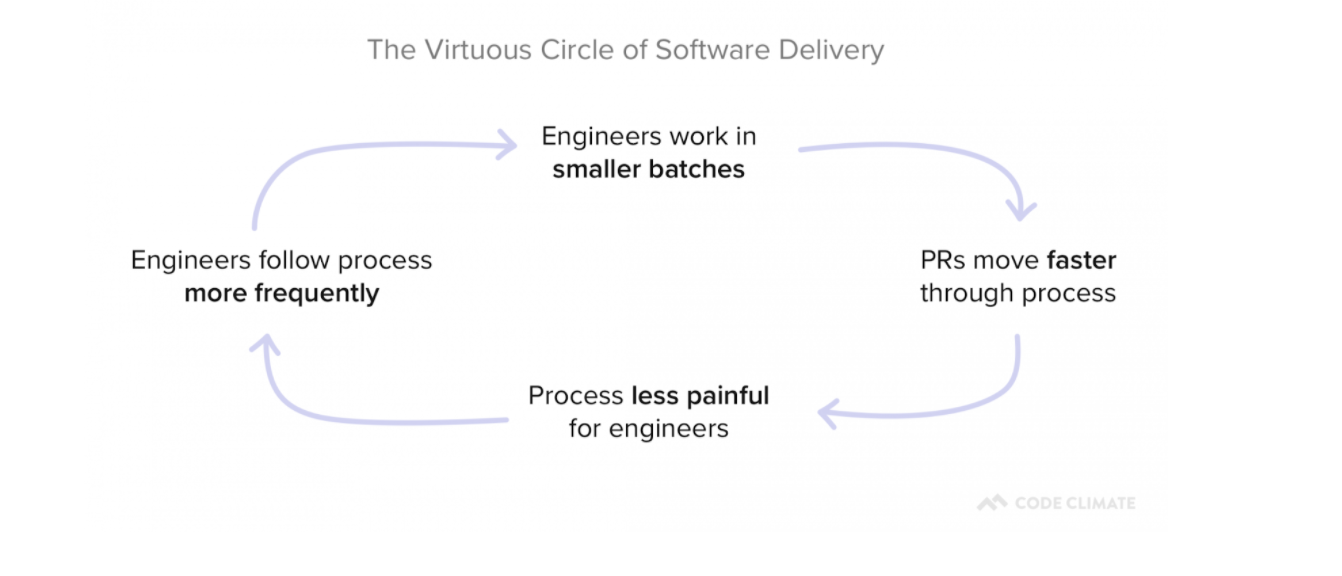
In addition, as you remove roadblocks from your development process, you’ll also reduce sources of frustration for your developers. This can have a positive impact on developer happiness and will set in motion a Virtuous Circle of Software Delivery, in which developers reap the benefits of optimization and are motivated to find even more ways to improve.
What’s Next?
Hopefully, you now have a better understanding of what Cycle Time is and why it matters. As a next step, you’re probably starting to think about ways to effectively minimize Cycle Time.
We took a data-driven approach to this question and analyzed thousands of pull requests across hundreds of teams. The results were interesting.
We turned that data into a tactical resource, The Engineering Leader’s Guide to Cycle Time, which offers a research-backed approach to minimizing Cycle Time.
If you’re interested in learning more about the origins of Cycle Time in Software Engineering, Mary and Tom Poppendieck’s book Lean Software, Chapter 4 “Deliver as Fast as Possible” is a great starting point.
If you would like to start tracking your own Code Cycle Time, request a consultation.
Related Resources
- What Data Science Tells Us About Shipping Faster
- The Engineering Leader’s Guide to Cycle Time
- Round Table: Perspectives on Cycle Time
Cycle Time in Lean Manufacturing
- “Takt Time – Cycle Time” – Describes some fundamental misconceptions around these terms. (Fittingly, the post includes a now 8-year running comment thread.)
- “How to Measure Cycle Times – Part 1”
- “How to Measure Cycle Times – Part 2”
Cycle Time in Software Engineering
- Lead time versus Cycle Time – Untangling the confusion
- The difference between Cycle Time and Lead Time… and why not to use Cycle Time in Kanban
- Measuring Process Improvements – Cycle Time?
Related Terminology
- Takt Time
- Lead Time
- Wait Time
- Move Time
- Process Time
- Little’s Law
- Throughput
- WIP
1 Thank you to Accelerate: Building and Scaling High Performing Technology Organizations, by Nicole Forsgren, Jez Humble and Gene Kim for the Donald Reinertsen reference, as well as the articulation of software development as having two primary phases (Chapter 2, p. 14 “Measuring Software Delivery Performance”). Accelerate is an excellent resource for understanding the statistical drivers behind software engineering. We were proud to have Nicole Forsgren speak at our Second Annual Code Climate Summit.

Velocity or GitPrime? Read a head-to-head analysis to decide which is best for your team.
In competitive markets, the viability of a business depends on engineering performance. In their 2020 study of 400+ enterprises across 12 industries, McKinsey concluded that engineering departments performing in the top quartile of the Developer Velocity Index (DVI) “outperform others in the market by four to five times.”
Historically, however, engineering has been a black box. The average company invests millions of dollars a year into the department, but most have no way of assessing the returns.
This is why many market-leading organizations, like Kickstarter, Gusto and VMWare, are starting to adopt Engineering Intelligence to get visibility into their software development workflows. Doing so has enabled them to effectively improve performance, boost Time to Market, and out-innovate competitors.
The two most popular engineering analytics platforms, Velocity and GitPrime (recently acquired by Pluralsight Flow), both offer transparency into engineering performance and process efficiency but differ in their approaches.
To help you make a decision about which approach to engineering metrics works best for your team, we put together a thorough head-to-head comparison of Velocity and GitPrime. Read the post through, or click on a link to skip to the section that’s most important to you.
Setting Up
Coaching
Tracking Progress
Goal Setting
Scope of Visibility
Surfacing Issues
Customization
Cost
Setting Up
Tl;dr: The setup process can be just as fast for both, GitPrime and Velocity, so you can be up and running as soon as your data imports.
First, you’ll want to know the time and effort it takes to get set up, so you can have an accurate expectation of how soon you’ll be up and running. Both analytics tools recognize the friction involved with process changes, so they’ve done their best to streamline this experience.
Velocity
Start setting up Velocity by first signing in with your GitHub or Bitbucket account. Once you’re in, you’ll be prompted to add your repositories, so you can start seeing your engineering data in the app.
GitPrime
GitPrime has a similar setup process. You start by creating a new GitPrime account and then setting up integrations with whichever Git or product management tools you might be using.
GitPrime supports more version control systems than Velocity, and each has a slightly different workflow. You can import repos accessible over HTTPS or SSH from any server, or use OAuth to connect to your GitHub, GitLab, or Bitbucket organization.
From there, you’ll also have to organize your data. You won’t be able to assign repos to applications, but you organize them by tag. Contributors can similarly be hidden from reports, merged or assigned to teams.
Coaching
Tl;dr: Velocity has a more robust set of coaching features than GitPrime. Whereas GitPrime offers a few metrics per developer, Velocity offers a 360 degree view that covers the day-to-day, week-to-week improvement, and long-term development.
A top priority that we often hear from organizations looking to invest in engineering analytics is the need to improve team and individual performance.
Velocity’s 360 reports combine all coaching features in one comprehensive report that provides a complete picture of developers’ and teams’ work habits. GitPrime reduces developer performance to a few key metrics, and offers more prescriptive guidelines.
Velocity
Velocity’s Developer360 report gives managers instant visibility into your developer’s active work, improvements along key metrics, and skills.
The report includes four tabs:
- Snapshot shows what a developer is working on right now and the impact of that work. A manager can leverage this data to spot bottlenecks before they have significant, negative downstream effects.
- Activity provides a visual summary of what an engineer has been working on over the past month. Many managers scan this report to see how an individual’s workload has changed over time and to ensure that work distribution matches their expectations.
- Foundations depict how a member of your team is trending according to every critical Velocity metric. Incorporate this data into 1:1s and/or performance conversations to check your biases, come to a shared understanding of where strengths and weaknesses lie, and set quantitative, actionable goals.
- Skills displayswhat coding languages a developer has been working with. This data can be helpful to glance over before a coaching session, so you can get a sense for an engineer’s language gaps and work with them to improve their expertise.
Velocity’s Developer360 report focuses on objective metrics and does not presume what they may indicate. We recommend Velocity for teams who are looking to avoid reductive metrics.
GitPrime
GitPrime has two main reports for coaching developers:
- The Player Card, which is limited to performance along three key categories: the core metrics included in the Code, Review, and Submit Fundamentals. At a glance, a manager can see a contributor’s percentile performance, a work log of what an engineer has been working on, as well as how collaborative engineers are in the review process. This report can be used to inform 1:1s or quarterly reviews.
- Snapshot, a report which plots contributors on a quadrant, based on their average throughput and churn. This report shows how the contributor compares to other engineers org-wide and offers feedback suggestions, based on where the engineer falls on the graph
GitPrime’s coaching reports are a fit for leaders who desire suggestions towards specific action based on how a given contributor is performing relative to their peers. For those who prefer GitPrime’s more prescriptive approach to coaching, however, we recommend keeping in mind that metrics don’t always paint a full picture.
For example, if you look at PR Throughput on this graph, you’ll see how many changes a given developer has shipped in contrast to his or her team members. But a data point on the top right of the graph doesn’t include the context that many of the deploys were relatively small in impact.
Tracking Progress
Tl;dr: Both tools provide at-a-glance dashboards that let you see trends over weeks, months or quarters. Velocity provides more PR-related metrics and has a real-time view into how you’re doing this sprint. These metrics allow you to evaluate progress across projects, sprints, and cohorts, making it possible to implement high-level process changes that can fundamentally improve the way your team works. GitPrime has more contributor-based metrics, which make it more difficult to help your entire team improve together.
The same insights that previously required hours of digging through repos and countless 1:1s are available at-a-glance in both analytics tools. But each application tracks “progress” slightly differently. Where Velocity makes it easy to track process-level metrics like Push Volume and compare progress across teams and time periods, GitPrime prioritizes reports that track metrics by individual contributor.
Velocity
Velocity has two main features that allow for progress tracking:
- Overview: This is the home dashboard, and it offers a summary of the progress your team has made over time, based on metrics like Impact, PRs Merged, or Push Volume. By pulling these together in one place, the Overview provides an at-a-glance look at the way your team’s progress is trending across a variety of metrics, so you can dig deeper into the ones that are most aligned with your goals.
- Analytics: Every team works differently, which is why the Analytics feature is designed to give you the data you need most. Managers can create customized reports, slicing and dicing 50+ metrics available within the app to understand how various development behaviors have changed over time on an org, team, or individual level.
Velocity makes it easier to do things like identify and learn from your highest-performing teams, or track the success of particular initiatives. For example, you might track new developers’ Deploy Volume to evaluate how they’re progressing with onboarding based on how much of their work is making it into the codebase. And if our standard reports don’t include the insights you need, you can use our customizable Analytics report to dig even deeper into your data.
Velocity’s progress tracking reports are most suitable for managers who interpret metrics as insights about the work, not the person.
GitPrime
GitPrime has its own report for progress tracking:
- Project Timeline: This dashboard is similar to Velocity’s Overview dashboard, reporting work progress over time in terms of Impact, Commit Volume, Impact, and Velocity. The subtle difference is that instead of including a PR-related metrics, like Velocity’s PRs Merged, they look at Velocity, which they measure by number of valuable commits per person.
GitPrime’s Project Timeline report best complements a management style that prioritizes tracking contributor performance over PR- and process-related metrics.
Goal Setting
Tl;dr: Both applications include robust goal-setting features. The approaches differ in the types of goal-setting capabilities provided.
The goal of adopting an Engineering Intelligence tool is to use the greater visibility found in metrics to drive positive change in your organization.
Both Velocity and GitPrime include target-setting reports, but whereas Velocity tracks progress in terms of success rates, GitPrime tracks averages in their goal-setting system.
Since high-performance in engineering is critical to business success, you can use Velocity’s Targets feature to measure, improve, and communicate progress using objective metrics that support departmental initiatives. This report serves as concrete data to inform any OKR or KPI-related conversation, while the ability to drill-down into outliers enables team members to diagnose why targets aren’t met.
Velocity
Within Velocity’s Targets feature, executives, leaders, and front-line managers can build a dashboard of reports that visualize progress toward goals in terms of success rates or averages.
- Targets: Velocity has a first-class, highly structured goal-setting system that goes beyond simple averages, with percentile-based OKR-style goals. To meet this type of goal, a target percent of data points must be above or below an agreed-upon benchmark. For example: Keep 95% of Pull Requests under 250 lines of code.
When setting a goal, many leaders find that tracking averages over time doesn’t properly represent the progress that’s being made toward that goal.
If you’re tracking PR size, for example, a single, long-running PR might obscure the dozens of PRs that moved quickly through the pipeline. If you’re tracking Review Speed, a single neglected review inaccurately suggests inefficiencies in the review process.
Thus, Velocity’s Targets report is tailored to engineering leaders who acknowledge anomalies and believe that it’s acceptable for a few data points to be outside an expected target.
GitPrime
Instead of success rates, GitPrime tracks averages in their goal-setting systems.
- Fundamentals: The core of GitPrime’s product are four fundamental metrics that they assert are signals of productivity: Active Days, Commits per Day, Impact and Efficiency. They offer dashboards that show the 30-day average, industry benchmarks, and custom targets you can set.
GitPrime’s Fundamentals report is most compatible with managers who prefer the more common approach of tracking averages. However, it is important to note that if you have an outlier in your data — maybe one particularly complicated PR required a lot of back and forth in Code Review — that outlier will throw off your average. This can make it difficult to see the overall trend, and inaccurately suggest inefficiencies.
Scope of Visibility
Tl;dr: If you want to evaluate your process from end-to-end, you’re better off going with Velocity, which was built specifically for CD. Conversely, GitPrime was built for coding efficiency with an emphasis on Code Review and doesn’t include data from before a PR is opened and when it is merged.
While most of the industry is actively adopting Continuous Delivery, few have set up any way to measure their progress.
To optimize or adopt CD processes, organizations need a complete, end-to-end picture of their engineering processes. Concrete metrics, such as those found within Velocity and GitPrime, are a prerequisite for ensuring success in this transition.
Velocity
Velocity is the only application in its category to shine a light on the entire software development process. Key metrics you need when measuring CD include: Cycle Time, Deploy Volume, Time to Open, Time to Review, and Time to Merge, the majority of which are not available in GitPrime.
Our objective is to eventually incorporate data from every important tool that an engineer touches.
Teams looking to optimize each part of their software delivery pipeline, not just Code Review, are better off going with Velocity.
GitPrime
GitPrime was originally built to improve coding efficiency and has since built Code Review features as an add-on. This leaves important parts of the software delivery processes obscure–such as what happens before a PR is opened or after it is merged.
Teams focused exclusively on optimizing their Code Review processes will benefit more from the granularity found in GitPrime’s Review Workflow report.
Surfacing Issues
Tl;dr: Velocity, with PR-related metrics at the core of the product, does a better job drawing attention (inside and outside of the app) to actual artifacts of work that could be stuck or problematic. GitPrime, with mostly people-focused metrics, draws attention to contributors who could be stuck or problematic.
Engineering is expected to continuously deliver business value to your organization, but a single bottleneck can hold up the entire team during any given sprint. The larger your team gets, the harder it becomes for you to discern what work is stuck in the pipeline and why.
Velocity and GitPrime take different approaches to identifying outliers or irregular work patterns.
Velocity
Velocity employs a variety of visualizations to help you find the root cause of any issue that might slow down your team:
- Activity: This report displays the number and size of commits, merge commits, and PRs on a developer-by-developer or team-by-team basis over time. Scanning this page will enable you to see whether what developers are working on meets your expectations.
- Pull Requests: This view keeps the WIP/contributor on top, but also shows you how far along each PR is from being merged. You can see at-a-glance which PRs are at-risk and who’s working on them. Click on an item to navigate to the original Pull Request in GitHub.
Your team is also able to spot issues outside the application through daily standup reports, available via email or Slack. Velocity, thus, isn’t an analytics tool for top-down management but for leaders wishing to keep the whole team on track.
GitPrime
GitPrime’s core product ties each issue to a contributor, which gives managers an easy way to determine who to go to when something goes wrong on a particular week or month. Only in the collaboration reports, available in higher tiers, is there insight into problematic work products, such as PRs.
Here’s where you’d look to find inefficiencies, bottlenecks, and stuck engineers:
- Work Log: The work log is the application’s homepage. Similar to Velocity’s Activity Log, this page displays different types of work that a contributor produces. In addition to commits, merges, and PRs, they also display ticket comments, since GitPrime also offers an integration with JIRA.
- Snapshot: This feature is basically an automated performance review of each contributor. It gives a summary of how their performance stacks up against their team members’, and plots them on a matrix that shows the speed (measured by Impact) and the quality (measured by Churn) of their work. A further breakdown can be seen below.
- Spot Check: This feature displays how contributor performance has increased or decreased as compared to the last week or last month. At-a-glance you can quickly spot abnormalities and know who to approach for more information.
We recommend GitPrime for managers who prefer visibility into low-performance developers over visibility into stuck work.
Customization
Tl;dr: Velocity includes customizable reports that allow you ask questions of your data to derive more meaningful insights. GitPrime does not have custom reporting, but they do offer an API.
If you have unique requirements or track a unique metric, you might require a more flexible platform. Here’s how your two options compare.
Velocity
Velocity has an entire feature set dedicated to making the product more flexible for teams who work off the beaten path:
- Analytics Report: Velocity exposes all of your Pull Request, Code Review and commits data for you to create custom reports. You simply pick your data set, determine how you want it summarized (by average, sum, etc.), and then how you’d like it displayed. You can choose from 9 different views, including line graphs, bar graphs, and area graphs.
- Reports and Metric Permissions:Not all teams find the same analytics valuable, so Velocity gives users the ability to turn on and off whatever metrics or full features that they’d like. You can also control whether each metric can be segmented by team or individual, or only available at the organization level.
- Contributor-wide, team-wide, or org-wide targets: Once you’re familiar with how your team performs week to week or month to month, you can set targets to push your team to improve along whatever criteria you’re prioritizing. You can attach tags and metadata to these targets, and they’ll be sent out to your team on a weekly basis.
Velocity is the best option for engineering organizations who’d like the flexibility to build any charts that aren’t already available out-of-the-box.
GitPrime
GitPrime does not have custom reporting, but they do offer an API in their Enterprise package for customers who have the resources to build out their own reports.
There is also portion of the application where users can set simple targets for the entire organization, teams, and contributors.
GitPrime is a good fit for customers who have the resources to build out their own reports.
Cost
Tl;dr: While pricing of the two products is competitive, GitPrime restricts more features in their lower tiers. Velocity offers more capabilities for less, and the flexibility of their platform allows for customizability irrespective of cost.
The two products do not differ much in terms of pricing, so if you’re operating within significant budget constraints, a built-it-yourself solution is probably most feasible. Otherwise, both products tier slightly differently, so make sure you’re getting the core features that are most important to your team.
Velocity
Velocity has four pricing packages based on team size, including a free option for teams of 10 or fewer. For teams of 10+, pricing starts at $449/seat per year. Each tier includes access to all metrics and reports (including the flexible Analytics report) and gives teams access to unlimited historical data.
The small and medium tiers are limited in number of repos (50 and 100, respectively), while the largest priced tier is not. The team reporting function, which lets you see metrics summarized on a team-by-team basis, is not available until the largest tier.
GitPrime
GitPrime has a more complex pricing system. They have 3 tiers with different features, and a sliding pricing scale, based on how many engineers are in your organization. Their pricing starts at $499, but they limit a lot of their features in the lower tiers.
The lowest tier does not include their “code review collaboration insights.” They also restrict the historical data they make available– 12 months for the first tier and 36 months for the second tier.
Different Strokes for Different Management Folks
Engineering excellence drives business performance. The teams that are excelling in the space are the ones that have the vernacular to talk about developer performance and the tools to improve it.
To this end, Velocity data serves three primary purposes. It’s used to:
- Help improve team and developer performance,
- Drive continuous improvement across engineering processes, and
- Communicate engineering’s progress both within the department and to others in the organization.
Most importantly, Velocity has a few more tools to put your learnings into action. You can set up Slack and email alerts for irregular activity and you have a first-class targets system to encourage your team to improve.
Conversely, GitPrime’s main focus is individual performance, importing data from Git, which means their tool primarily works off of source-code level data, not collaborative work data.
GitPrime equips a manager to keep closer track of their engineers, so they have a clear idea of the strongest and weakest performers of the team. This approach is for hands-on managers who still want an active role in how their direct reports work.

Gathering context and showing empathy may be the most difficult parts of a performance review, but they’re also the most important — this year, more than ever.
Even in the best of times, performance reviews can be harmful. In the era of COVID, with team members already contending with external stressors and verging on burnout, a poorly-executed performance review is likely to be even more damaging to your team members’ morale.
With a little extra care, leaders can avoid giving a review that focuses on business goals at the expense of the individual — and hopefully, can take a few additional steps towards boosting their team members’ motivation and well-being.
After working with 1000s of engineering teams on improving performance, we’ve learned a few things about successful end-of-year reviews. We recommend that reviewers:
- Take measures to check assumptions and assume best intentions
- Contextualize the limited information available
- Be specific and focus on coaching opportunities
These strategies will help you give an effective yet compassionate review, and are worth keeping in mind any time you need to give constructive feedback.
Check your biases and assumptions with data
Most managers are aware that they have innate biases that can hamper their ability to fairly and accurately evaluate their team members. But awareness isn’t enough. The most effective way to reduce bias is to check your instincts against objective data.
For example, performance reviews are particularly subject to recency bias. The last few weeks or even months of work loom largest in your memory, which means they are most likely to influence your opinion about your team member’s performance, even if they represent a small sliver of the past year.
If your team member has been writing fewer commits than usual over the last month, you might remember them as writing less code for the entire year, even if that is not the case. Objective data can help you check that bias, as a quick look at your team member’s Commit Volume for the past year can confirm that their current drop in productivity is temporary and not representative of their performance as a whole.
You can use data to check other assumptions as well. Let’s say one of your team members has been taking afternoons off to supervise remote learning or to care for an elderly relative. You might fall prey to negativity bias, a universal bias in which negative impressions — in this case, your team member’s truncated working hours — make a larger impact than positive ones. As a result, you might overlook your team member’s positive contributions to the team and assume that they have been less productive because they’ve been working fewer hours.
But with objective data, you’ll know for sure. You might check their Pull Request Throughput over the last year and find out that, in fact, your team member has been just as productive than usual, if not more, because they’ve been hyper-focused during their limited working hours in an effort to get everything done.
Put everything in context
Of course, data doesn’t tell the whole story. It’s always important to put all quantitative data in context, but it’s particularly important now, when everyone is in need of a little extra compassion and support. With the right context, you can get a more complete picture of your team members’ circumstances, and gain a better understanding of their current needs.
Let’s go back to the example of the team member who has been writing fewer commits than usual over the past month. It might be helpful to use that information to start a conversation and find out why they’ve had a hard time getting into the codebase. You might find out that schools in their area recently shut down, and they’ve been struggling to get into a new routine with the added responsibility of supervising remote learning.
With that information, you can develop a plan to better support that team member, whether it’s temporarily taking some work off their plate or offering them a little time off until they can get their bearings.
On the other hand, your conversation might reveal information that has nothing to do with their personal circumstances at all. For example, you might find out that the team member who has been logging fewer commits has been taking time out of their workday to help with onboarding new team members and improving process documentation.
With that knowledge, you can have a more targeted conversation about your team member’s interests and professional goals. If it turns out your team member prefers working with new developers to writing new code, you might be able to help them reshape their role and find more opportunities for coaching and mentorship.
And don’t forget — positive data needs context too. You might be pleased to find that a team member has been more productive than ever over the past year, with a consistently high Commit Volume and PR Throughput, but it’s still worth having a conversation about why that is and how it’s impacting them. That team member might reveal that they’ve been feeling overwhelmed and insecure due to the current economic and political climate, so they’ve been taking on extra projects and working long hours to ensure their job security.
As their manager, you can use this information to help reassure your team member that their contribution is valued and to help take some of the pressure off. You might even want to discuss their priorities and reallocate certain tasks, so you can help your team member avoid burning out.
Use data to provide specific, actionable feedback
The most effective feedback is specific and actionable. Data can help you focus your conversations on certain aspects of a developer’s workflow, or specific units of work, so you can more effectively coach each individual developer.
For example, let’s say one of the developers on your team is consistently opening large Pull Requests. You could simply encourage them to “open smaller Pull Requests,” but that feedback might not be effective if they’re having trouble finding ways to break down their work. Instead, it can be helpful to identify some of their largest Pull Requests and bring them to your evaluation. That way, you can take a look at some actual Pull Requests together and discuss ways they could be broken down into smaller parts. With concrete examples and a bit of focused coaching, that developer will walk away from your conversation with actionable strategies for opening smaller Pull Requests, and you’ll be more likely to see them achieve the desired result.
In cases where your team members are seriously underperforming to the point where their job really is at risk, it can be helpful to set clear, specific performance expectations. With easy-to-understand targets, that team member may have an easier time doing what they need to do to stay afloat.
Think beyond the annual review
Even if you’re able to run objective, compassionate performance reviews that leave your team members with actionable feedback, annual performance reviews happen too infrequently to maximize their potential for positive impact. It’s not always easy for a team member to speak up and ask for support, and it’s difficult for developers to keep growing when they’re only getting feedback once a year.
If you don’t use them already, consider making regular 1-on-1s part of your management repertoire. With frequent 1-on-1s, you’ll get to know your team members on a more personal level, and with more frequent check-ins, you’ll be able to more effectively support them through difficult situations, whether it’s a personal challenge, like a sick loved one, or a professional one, like a communication breakdown with a fellow team member.
Re-evaluate your evaluation process
If there was ever a year to re-evaluate the way you handle performance evaluations, this is it. While current circumstances may have generated extra pressure to meet business numbers, they have also created extra reason to be compassionate. As a leader, it’s your responsibility to ensure that business pressure doesn’t compromise your team member’s well-being, and to create the best possible circumstances for your team member to do their job.
No matter what you do, some of your team members may be struggling due to circumstances completely beyond either of your control. It may not be the right time for them to boost their productivity or reach the next level of professional success, and that’s ok.