Resources & Insights
Featured Article
Navigating the world of software engineering or developer productivity insights can feel like trying to solve a complex puzzle, especially for large-scale organizations. It's one of those areas where having a cohesive strategy can make all the difference between success and frustration. Over the years, as I’ve worked with enterprise-level organizations, I’ve seen countless instances where a lack of strategy caused initiatives to fail or fizzle out.
In my latest webinar, I breakdown the key components engineering leaders need to consider when building an insights strategy.
Why a Strategy Matters
At the heart of every successful software engineering team is a drive for three things:
- A culture of continuous improvement
- The ability to move from idea to impact quickly, frequently, and with confidence
- A software organization delivering meaningful value
These goals sound simple enough, but in reality, achieving them requires more than just wishing for better performance. It takes data, action, and, most importantly, a cultural shift. And here's the catch: those three things don't come together by accident.
In my experience, whenever a large-scale change fails, there's one common denominator: a lack of a cohesive strategy. Every time I’ve witnessed a failed attempt at implementing new technology or making a big shift, the missing piece was always that strategic foundation. Without a clear, aligned strategy, you're not just wasting resources—you’re creating frustration across the entire organization.
Sign up for a free, expert-led insights strategy workshop for your enterprise org.
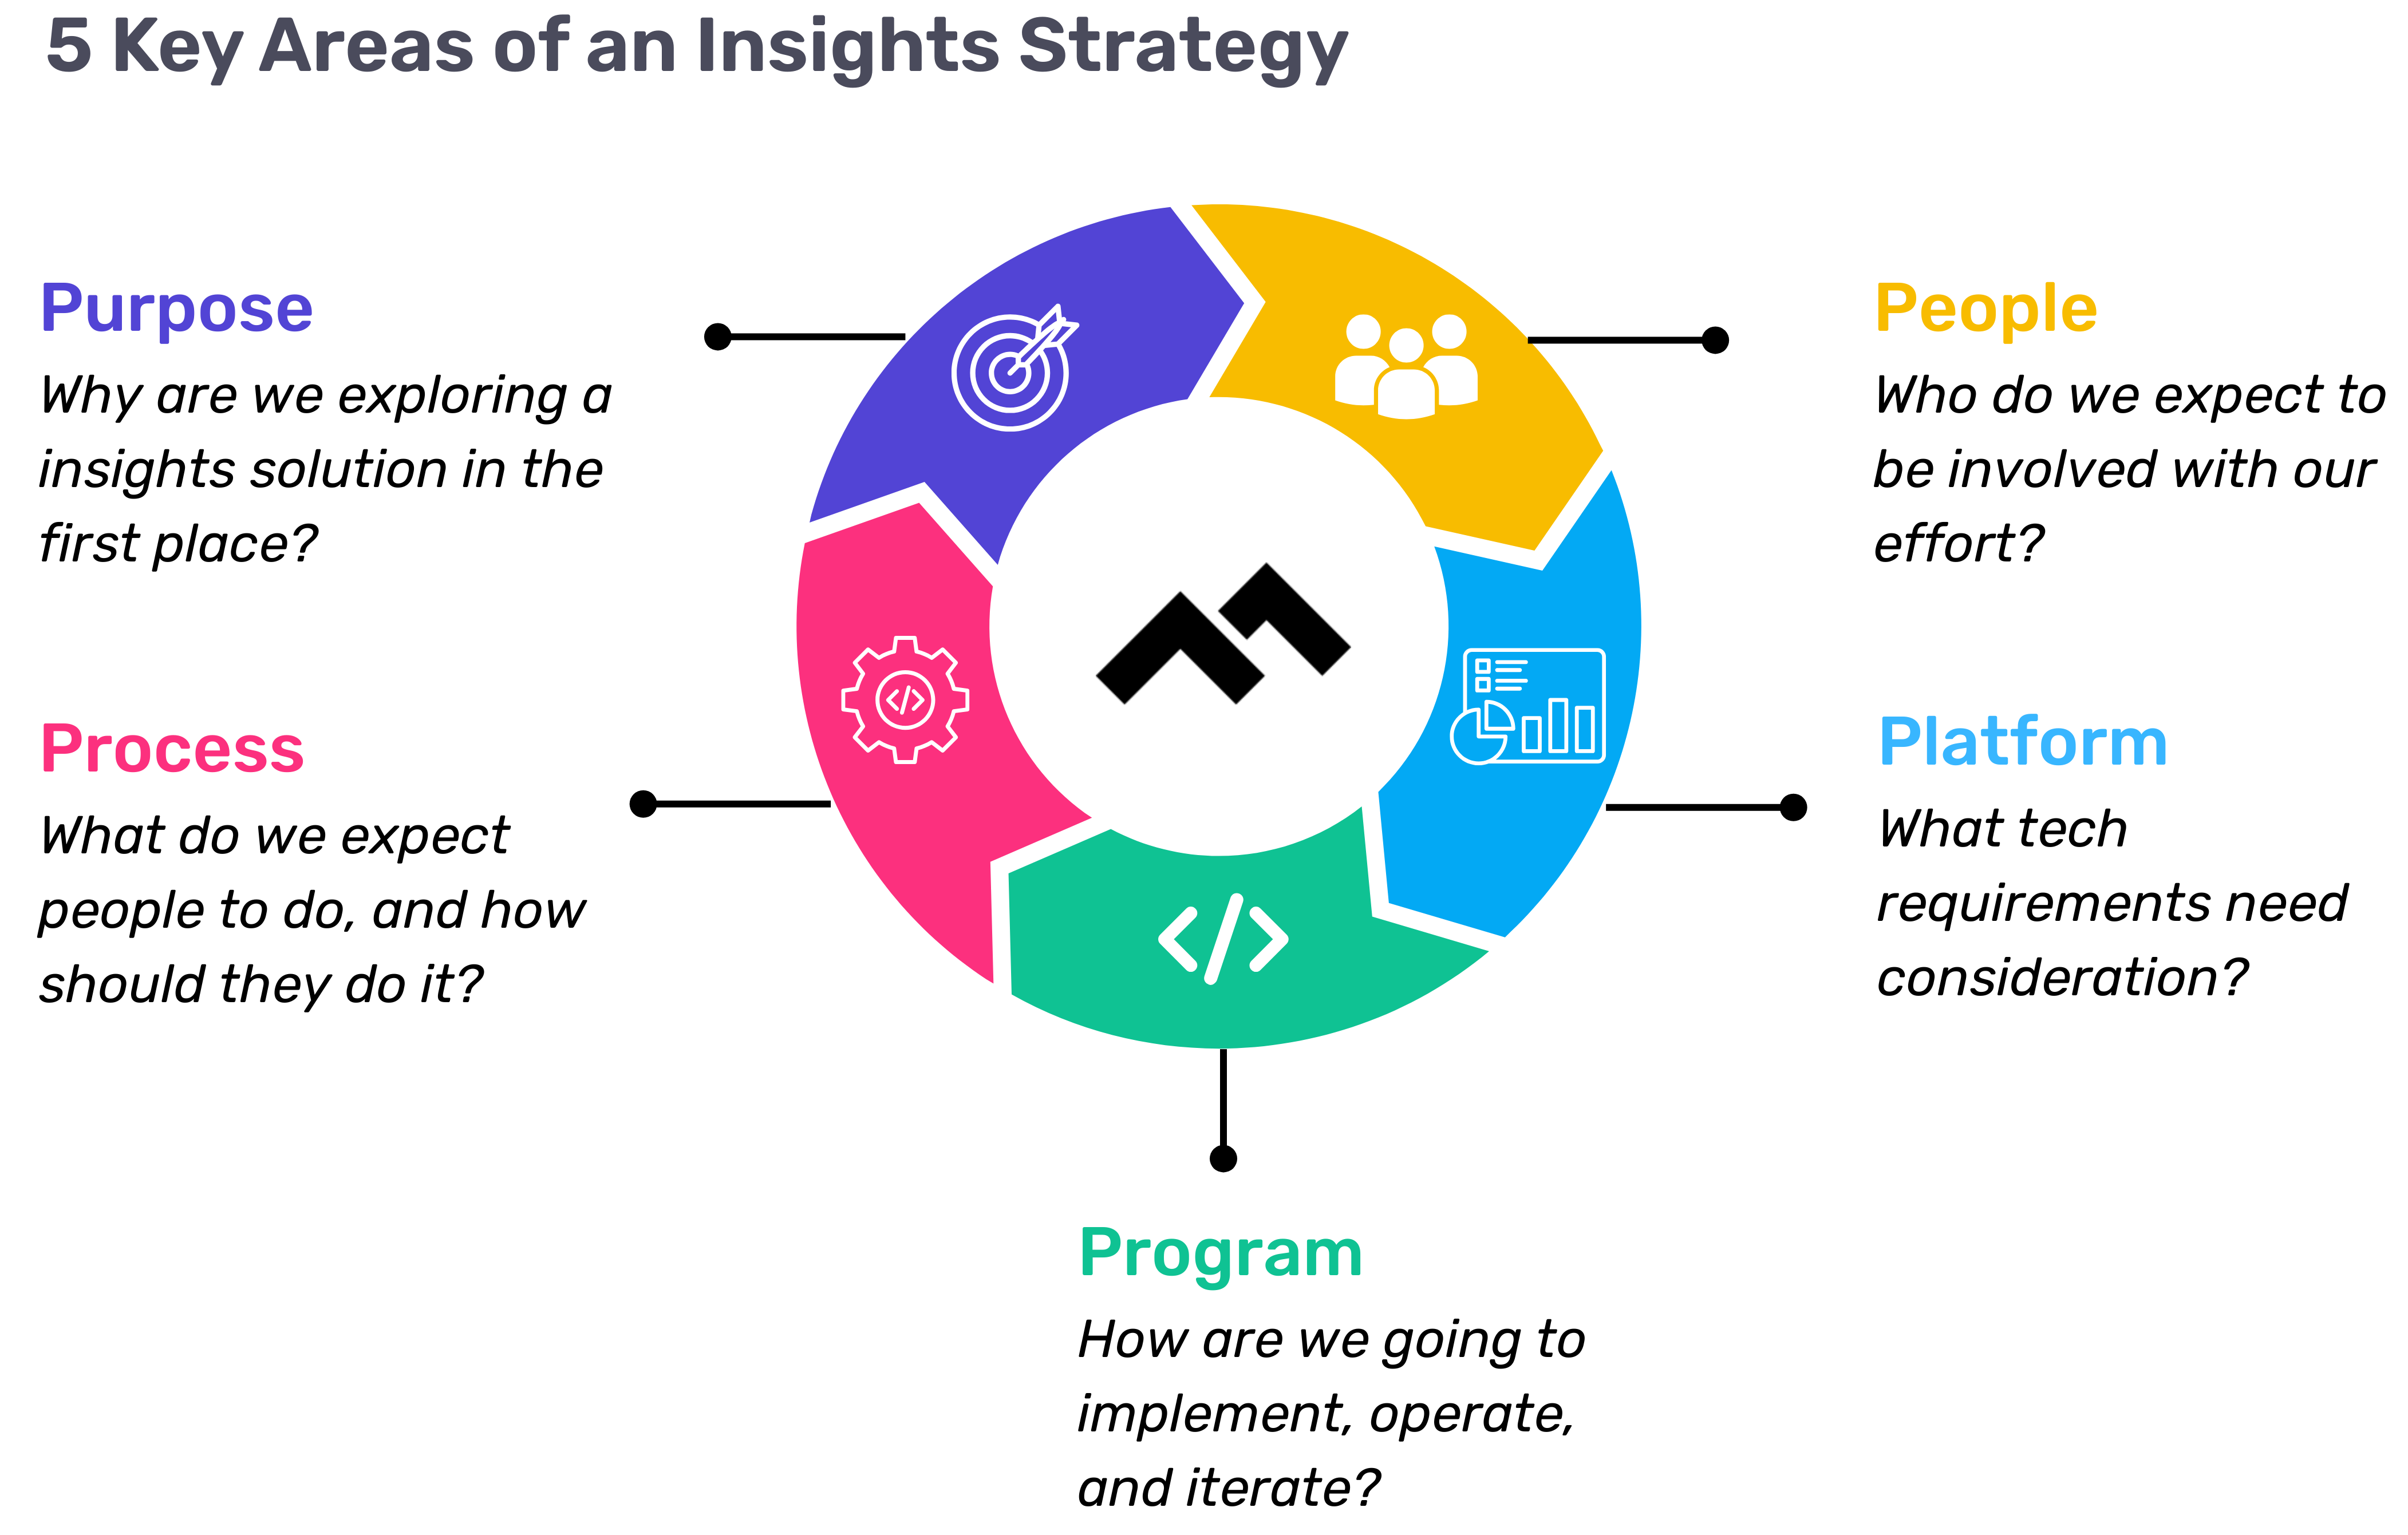
Step 1: Define Your Purpose
The first step in any successful engineering insights strategy is defining why you're doing this in the first place. If you're rolling out developer productivity metrics or an insights platform, you need to make sure there’s alignment on the purpose across the board.
Too often, organizations dive into this journey without answering the crucial question: Why do we need this data? If you ask five different leaders in your organization, are you going to get five answers, or will they all point to the same objective? If you can’t answer this clearly, you risk chasing a vague, unhelpful path.
One way I recommend approaching this is through the "Five Whys" technique. Ask why you're doing this, and then keep asking "why" until you get to the core of the problem. For example, if your initial answer is, “We need engineering metrics,” ask why. The next answer might be, “Because we're missing deliverables.” Keep going until you identify the true purpose behind the initiative. Understanding that purpose helps avoid unnecessary distractions and lets you focus on solving the real issue.
Step 2: Understand Your People
Once the purpose is clear, the next step is to think about who will be involved in this journey. You have to consider the following:
- Who will be using the developer productivity tool/insights platform?
- Are these hands-on developers or executives looking for high-level insights?
- Who else in the organization might need access to the data, like finance or operations teams?
It’s also crucial to account for organizational changes. Reorgs are common in the enterprise world, and as your organization evolves, so too must your insights platform. If the people responsible for the platform’s maintenance change, who will ensure the data remains relevant to the new structure? Too often, teams stop using insights platforms because the data no longer reflects the current state of the organization. You need to have the right people in place to ensure continuous alignment and relevance.
Step 3: Define Your Process
The next key component is process—a step that many organizations overlook. It's easy to say, "We have the data now," but then what happens? What do you expect people to do with the data once it’s available? And how do you track if those actions are leading to improvement?
A common mistake I see is organizations focusing on metrics without a clear action plan. Instead of just looking at a metric like PR cycle times, the goal should be to first identify the problem you're trying to solve. If the problem is poor code quality, then improving the review cycle times might help, but only because it’s part of a larger process of improving quality, not just for the sake of improving the metric.
It’s also essential to approach this with an experimentation mindset. For example, start by identifying an area for improvement, make a hypothesis about how to improve it, then test it and use engineering insights data to see if your hypothesis is correct. Starting with a metric and trying to manipulate it is a quick way to lose sight of your larger purpose.
Step 4: Program and Rollout Strategy
The next piece of the puzzle is your program and rollout strategy. It’s easy to roll out an engineering insights platform and expect people to just log in and start using it, but that’s not enough. You need to think about how you'll introduce this new tool to the various stakeholders across different teams and business units.
The key here is to design a value loop within a smaller team or department first. Get a team to go through the full cycle of seeing the insights, taking action, and then quantifying the impact of that action. Once you've done this on a smaller scale, you can share success stories and roll it out more broadly across the organization. It’s not about whether people are logging into the platform—it’s about whether they’re driving meaningful change based on the insights.
Step 5: Choose Your Platform Wisely
And finally, we come to the platform itself. It’s the shiny object that many organizations focus on first, but as I’ve said before, it’s the last piece of the puzzle, not the first. Engineering insights platforms like Code Climate are powerful tools, but they can’t solve the problem of a poorly defined strategy.
I’ve seen organizations spend months evaluating these platforms, only to realize they didn't even know what they needed. One company in the telecom industry realized that no available platform suited their needs, so they chose to build their own. The key takeaway here is that your platform should align with your strategy—not the other way around. You should understand your purpose, people, and process before you even begin evaluating platforms.
Looking Ahead
To build a successful engineering insights strategy, you need to go beyond just installing a tool. An insights platform can only work if it’s supported by a clear purpose, the right people, a well-defined process, and a program that rolls it out effectively. The combination of these elements will ensure that your insights platform isn’t just a dashboard—it becomes a powerful driver of change and improvement in your organization.
Remember, a successful software engineering insights strategy isn’t just about the tool. It’s about building a culture of data-driven decision-making, fostering continuous improvement, and aligning all your teams toward achieving business outcomes. When you get that right, the value of engineering insights becomes clear.
Want to build a tailored engineering insights strategy for your enterprise organization? Get expert recommendations at our free insights strategy workshop. Register here.Register here.
Andrew Gassen has guided Fortune 500 companies and large government agencies through complex digital transformations. He specializes in embedding data-driven, experiment-led approaches within enterprise environments, helping organizations build a culture of continuous improvement and thrive in a rapidly evolving world.
Navigating the world of software engineering or developer productivity insights can feel like trying to solve a complex puzzle, especially for large-scale organizations. It's one of those areas where having a cohesive strategy can make all the difference between success and frustration. Over the years, as I’ve worked with enterprise-level organizations, I’ve seen countless instances where a lack of strategy caused initiatives to fail or fizzle out.
In my latest webinar, I breakdown the key components engineering leaders need to consider when building an insights strategy.
Why a Strategy Matters
At the heart of every successful software engineering team is a drive for three things:
- A culture of continuous improvement
- The ability to move from idea to impact quickly, frequently, and with confidence
- A software organization delivering meaningful value
These goals sound simple enough, but in reality, achieving them requires more than just wishing for better performance. It takes data, action, and, most importantly, a cultural shift. And here's the catch: those three things don't come together by accident.
In my experience, whenever a large-scale change fails, there's one common denominator: a lack of a cohesive strategy. Every time I’ve witnessed a failed attempt at implementing new technology or making a big shift, the missing piece was always that strategic foundation. Without a clear, aligned strategy, you're not just wasting resources—you’re creating frustration across the entire organization.
Sign up for a free, expert-led insights strategy workshop for your enterprise org.
Step 1: Define Your Purpose
The first step in any successful engineering insights strategy is defining why you're doing this in the first place. If you're rolling out developer productivity metrics or an insights platform, you need to make sure there’s alignment on the purpose across the board.
Too often, organizations dive into this journey without answering the crucial question: Why do we need this data? If you ask five different leaders in your organization, are you going to get five answers, or will they all point to the same objective? If you can’t answer this clearly, you risk chasing a vague, unhelpful path.
One way I recommend approaching this is through the "Five Whys" technique. Ask why you're doing this, and then keep asking "why" until you get to the core of the problem. For example, if your initial answer is, “We need engineering metrics,” ask why. The next answer might be, “Because we're missing deliverables.” Keep going until you identify the true purpose behind the initiative. Understanding that purpose helps avoid unnecessary distractions and lets you focus on solving the real issue.
Step 2: Understand Your People
Once the purpose is clear, the next step is to think about who will be involved in this journey. You have to consider the following:
- Who will be using the developer productivity tool/insights platform?
- Are these hands-on developers or executives looking for high-level insights?
- Who else in the organization might need access to the data, like finance or operations teams?
It’s also crucial to account for organizational changes. Reorgs are common in the enterprise world, and as your organization evolves, so too must your insights platform. If the people responsible for the platform’s maintenance change, who will ensure the data remains relevant to the new structure? Too often, teams stop using insights platforms because the data no longer reflects the current state of the organization. You need to have the right people in place to ensure continuous alignment and relevance.
Step 3: Define Your Process
The next key component is process—a step that many organizations overlook. It's easy to say, "We have the data now," but then what happens? What do you expect people to do with the data once it’s available? And how do you track if those actions are leading to improvement?
A common mistake I see is organizations focusing on metrics without a clear action plan. Instead of just looking at a metric like PR cycle times, the goal should be to first identify the problem you're trying to solve. If the problem is poor code quality, then improving the review cycle times might help, but only because it’s part of a larger process of improving quality, not just for the sake of improving the metric.
It’s also essential to approach this with an experimentation mindset. For example, start by identifying an area for improvement, make a hypothesis about how to improve it, then test it and use engineering insights data to see if your hypothesis is correct. Starting with a metric and trying to manipulate it is a quick way to lose sight of your larger purpose.
Step 4: Program and Rollout Strategy
The next piece of the puzzle is your program and rollout strategy. It’s easy to roll out an engineering insights platform and expect people to just log in and start using it, but that’s not enough. You need to think about how you'll introduce this new tool to the various stakeholders across different teams and business units.
The key here is to design a value loop within a smaller team or department first. Get a team to go through the full cycle of seeing the insights, taking action, and then quantifying the impact of that action. Once you've done this on a smaller scale, you can share success stories and roll it out more broadly across the organization. It’s not about whether people are logging into the platform—it’s about whether they’re driving meaningful change based on the insights.
Step 5: Choose Your Platform Wisely
And finally, we come to the platform itself. It’s the shiny object that many organizations focus on first, but as I’ve said before, it’s the last piece of the puzzle, not the first. Engineering insights platforms like Code Climate are powerful tools, but they can’t solve the problem of a poorly defined strategy.
I’ve seen organizations spend months evaluating these platforms, only to realize they didn't even know what they needed. One company in the telecom industry realized that no available platform suited their needs, so they chose to build their own. The key takeaway here is that your platform should align with your strategy—not the other way around. You should understand your purpose, people, and process before you even begin evaluating platforms.
Looking Ahead
To build a successful engineering insights strategy, you need to go beyond just installing a tool. An insights platform can only work if it’s supported by a clear purpose, the right people, a well-defined process, and a program that rolls it out effectively. The combination of these elements will ensure that your insights platform isn’t just a dashboard—it becomes a powerful driver of change and improvement in your organization.
Remember, a successful software engineering insights strategy isn’t just about the tool. It’s about building a culture of data-driven decision-making, fostering continuous improvement, and aligning all your teams toward achieving business outcomes. When you get that right, the value of engineering insights becomes clear.
Want to build a tailored engineering insights strategy for your enterprise organization? Get expert recommendations at our free insights strategy workshop. Register here.Register here.
Andrew Gassen has guided Fortune 500 companies and large government agencies through complex digital transformations. He specializes in embedding data-driven, experiment-led approaches within enterprise environments, helping organizations build a culture of continuous improvement and thrive in a rapidly evolving world.
All Articles
As the adage goes, the best laid plans go awry, and that also applies to building software. The planning phase, including maintaining alignment, is critical in engineering, but even for the most mature teams, plans can change and evolve as they’re executed.
Engineering leaders need to keep teams aligned with the overall goals of their organization, and that includes setting and managing expectations for stakeholders so they won’t be blindsided when roadmaps need to change. How do CTOs successfully align on strategic priorities, navigate planning, and course-correct when things go off-track?
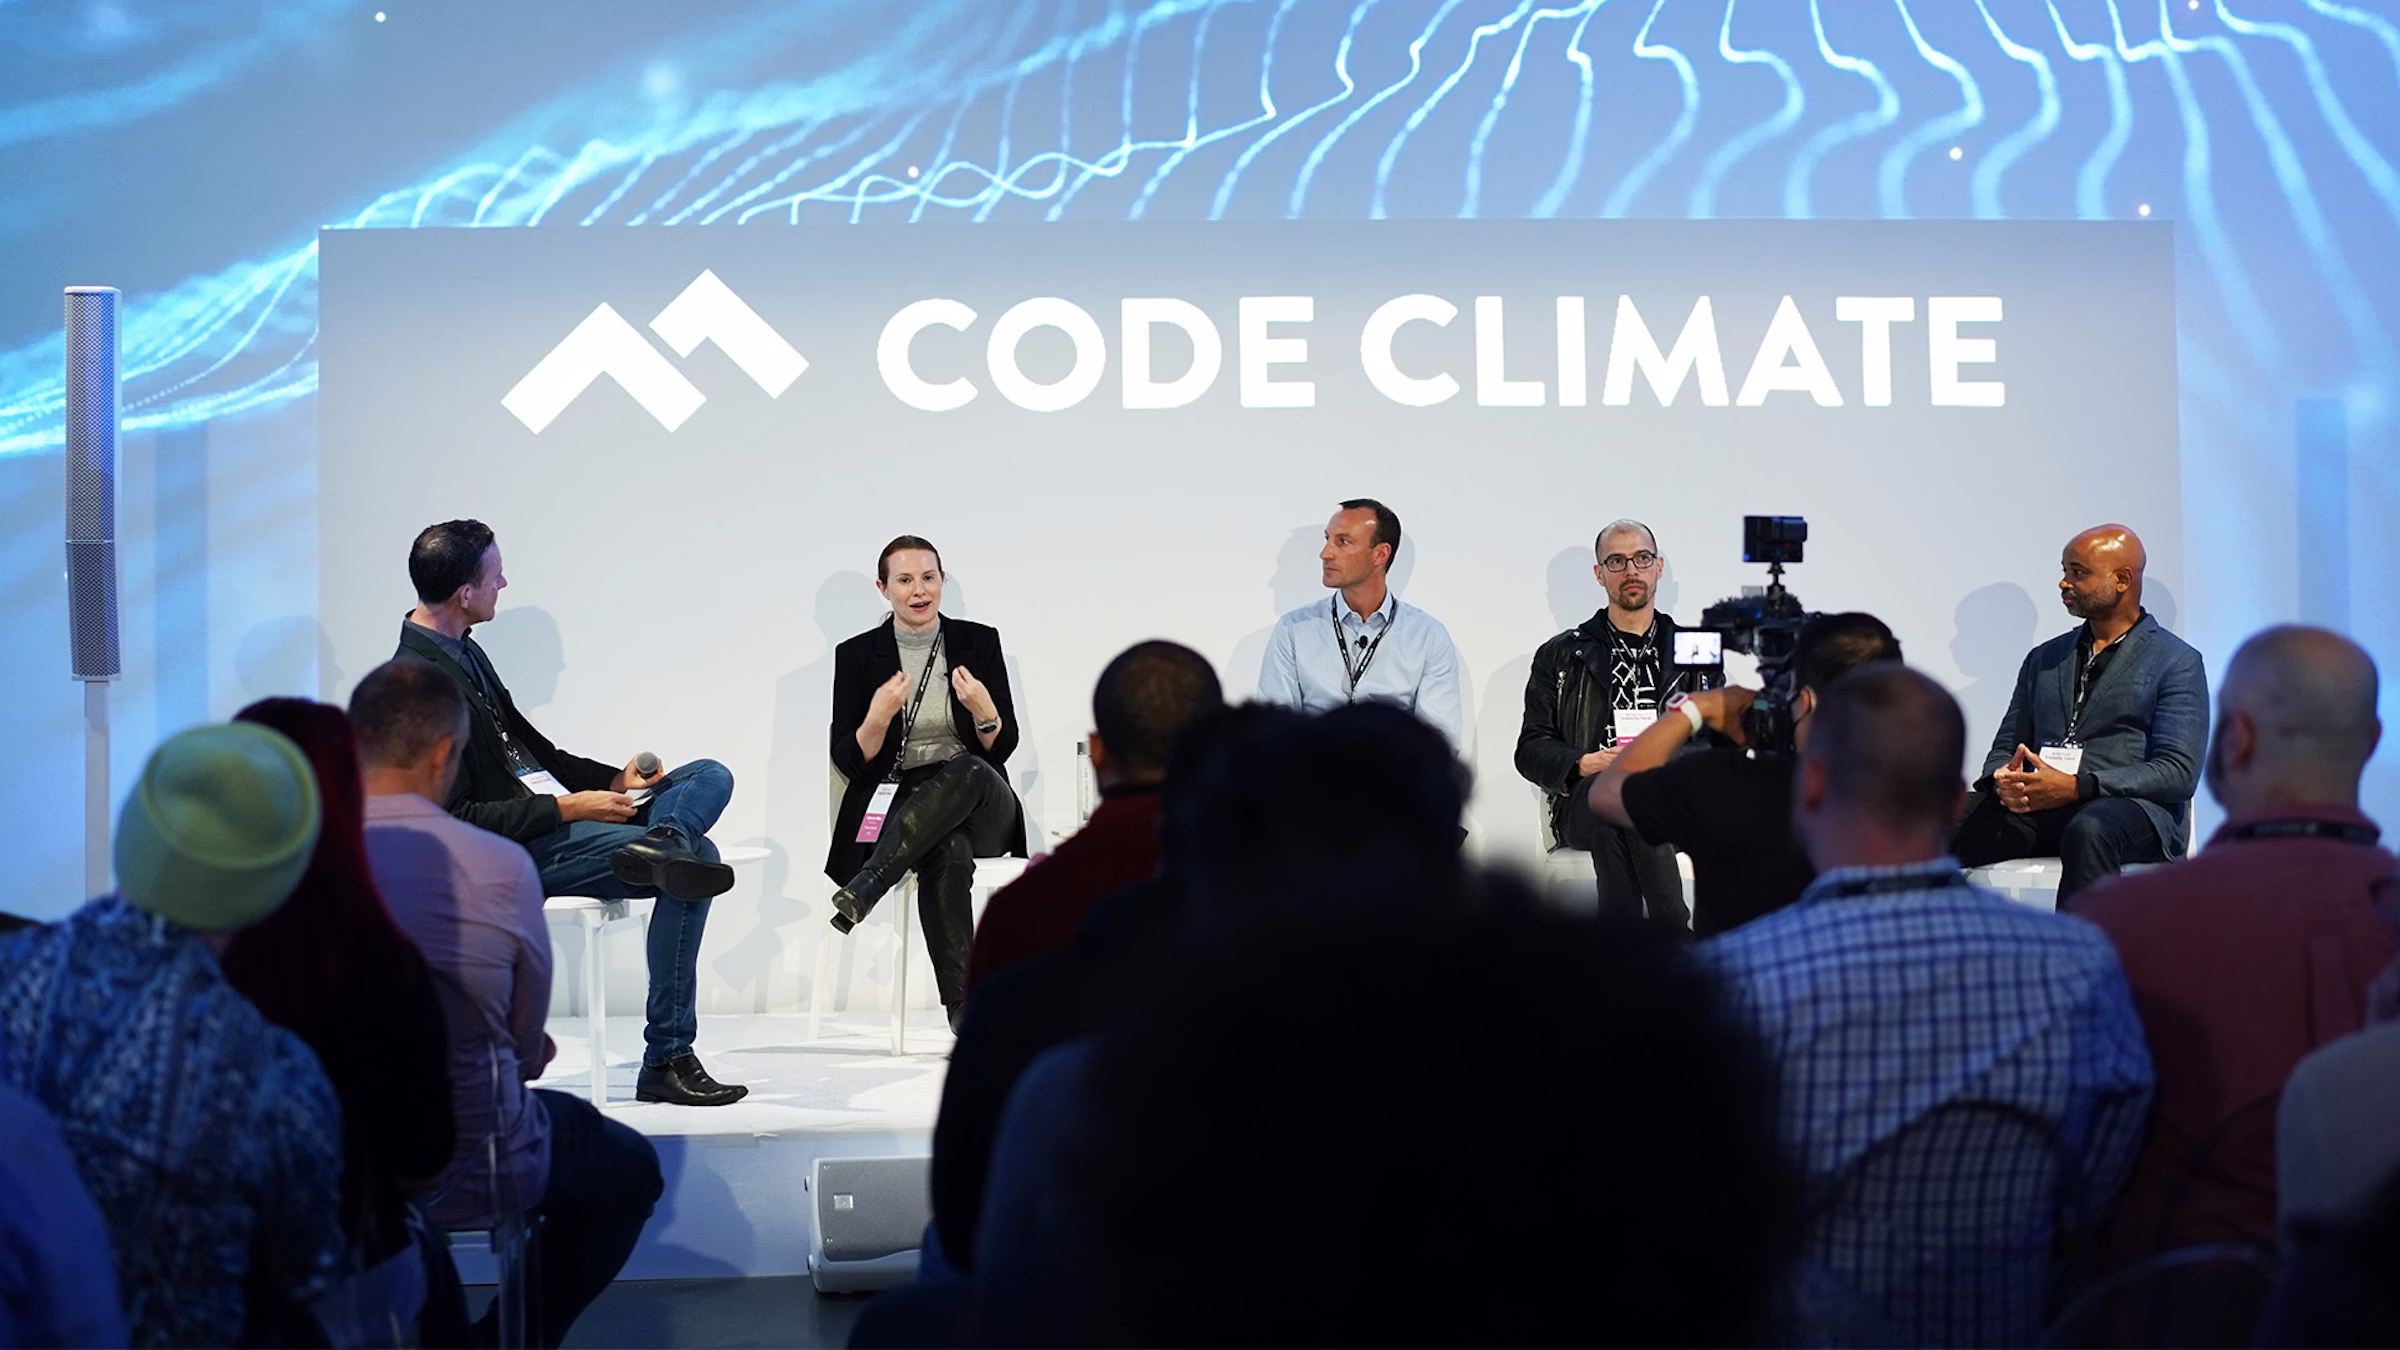
As part of Code Climate’s Next event, we invited engineering leaders Catherine Miller, CTO at Flatiron Health; Juan Pablo Buriticá, SVP of Engineering at Ritchie Bros.; Ryan Grimard, SVP of Engineering at EverQuote; and D Orlando Keise, Head of Banking Foundational Platform at UBS, to share their experience leading engineering teams while keeping the C-Suite at ease.
Read on for highlights from the panel discussion, led by Peter Bell, CTO and Founder of CTO Connection.
Peter Bell: An engineering leader’s responsibility is keeping the team aligned with a larger organization, and that starts at the top. What do you do to ensure that you’re on the same page with the rest of the C-Suite around things like resourcing, roadmap planning, and strategic priorities?
Ryan Grimard: Our teams use the Scaled Agile Framework, SAFe, for our planning and execution, and we involve our business leaders way in advance. They’re helping us with strategic planning for the company, and then our product and engineering teams are working through portfolio management and bringing things into the conveyor belt. When things are ready for final prioritization for a particular quarter, we use that process to go through “big room planning” and a one-week prioritization planning process. The end of that is effectively a confidence vote for all of the teams. We have 17 Agile teams, and the business leaders are in those meetings and hearing the confidence vote, and giving the thumbs up that they agree that these priorities that the teams have picked actually match up with the OKRs that we set at the company level.
Juan Pablo Buriticá: I have two techniques. One is to force the C-Suite to compromise on a single thing that they care about through a guiding principle. So, do we care about speed, do we care about quality? And then, I use that guiding principle to force decision making on the group for alignment.
The second thing is, a set of cascading strategies: you have business strategy, the product strategy that cascades from the business strategy, and the engineering strategy, which should enable both. And then, it forces resourcing, staffing, and prioritization to be aligned with the guiding principle. That guiding principle is the tiebreaker for everything.
D Orlando Keise: What I’ve found is important is to align on the mission. And I’m using “mission” in a sense that’s more than just the objective. I actually mean it almost in a military sense. What is our target? What are our threats? What’s the landscape and the terrain that we’re operating in? I think we all know that we’re going to come up with a plan, that we have a roadmap, but I find that the plan is not going to survive first light with the outside world.
I want to make sure that when that happens, we’re aligned not only on what we’re trying to do, but why we’re doing it, and the environment that we’re doing it in. Because when we start changing that plan, if we’re not aligned on all those other things, we’re going to run into problems.
Peter: What kind of conversation do you find the most difficult? Is it when you’re in the planning phase, and you have to say, ‘We’re not going to fit all that into this quarter,’ or is it once you’ve said, ‘Sure, we’ll do this by the end of the year,’ and then it’s December 12th and you’re realizing that Christmas might have to be canceled this year?
Catherine Miller: Planning conversations are about feelings, and execution conversations are about data. I like the execution conversations better, because the planning conversation ends up being a very abstract conversation that is based on trust. The more trust you have the better that goes, but you’re all just guessing, and at the end of the day, you are trading on some relationship or some extrapolation, and you know it’s wrong.
Then you get to the execution, and first of all, no one actually expects it to go on track, but what I love about execution is, you can check in along the way, you can see how it’s going, and it forces a conversation. What are you going to do? We literally cannot hit this deadline because of where we are. That is a fact. There is no hoping or wishing that will make that go away. So you’re forced into decision-making in a way that less mature teams often avoid at the planning stage where they just hope everything will be okay.
Ryan: I would say that our company has really evolved over the last two or three years. It used to be a much more difficult conversation upfront when business leaders asked, ‘These are the strategic priorities; how many of these can we complete in a quarter?’ Because they weren’t necessarily involved in the process that I described earlier, they were surprised when we couldn’t do everything at the same time and get everything out the door in that particular quarter. So since we’ve introduced this process, I feel like the more difficult part of that is through the backside, or partway through the quarter when the conversation might be: Why aren’t we executing? And those really get broken down into retrospectives. When something doesn’t quite go right, teams will do a full retrospective. They will come up with a root cause analysis through that retrospective, and line up whatever we need to fix, then present that to those business leaders. I think that builds confidence across the board.
More recently it’s been boiling down to either high levels of tech debt for a particular team, or our team isn’t onboarded to what we call our “paved path,” or our delivery pipeline.
Juan Pablo: I like solving problems by preventing them from happening, so I’m usually more uncomfortable when things have gone off track, because that means that we didn’t prevent what we were trying to prevent. Whereas, when I’m on the planning aspect, I feel very comfortable. Plans are lies we tell ourselves to get to the next stage and motivate our teams and motivate ourselves, so I have a much easier time on that end than the former.
Peter: When you realize for whatever reason that your team isn’t going to hit a date — there’s some commitment you’ve made, it’s clear now that it’s not going to happen — what’s the first thing you do?
Juan Pablo: The moment I find out, I broadcast that state to the organization, because rather than rebuilding trust, I prefer not losing trust. I’ve learned that people will usually handle transparency better than we think.
Since we’re building software and things tend to go wrong in software, I like building a culture where being off-track is not uncommon, and people don’t react with fear. We’re a good engineering team if we’re good at reacting quickly.
D: I want to underscore something that Juan Pablo said. The very first thing is to communicate it. The second thing is to understand what kind of problem we have. Did we plan poorly for the amount or type of resources that we have? Did we have great resources but the ground shifted under us?
I find that people think they’re solving the real problem but they’re really solving some symptom. So, I try to go a few layers down to find the real problem that caused us to be off track to begin with, and attack that.
Catherine: Part of what I would do is figure out whose problem this is to solve. Is this something that I should really be [calling on] one of my VPs or even directors for, and setting a framework for them to solve, or is this significant enough for me to dig into directly?
Ryan: Keeping it amongst the team is important, at least for a place to start, where the team is a handful of engineers and the product manager or the product owner. There’s a lot of trust that should have been built up over time. We’re pretty big on keeping teams whole and not rotating people around unless there’s some sort of internal mobility opportunity for folks.
Peter: So you found out things are off track, and you have to prepare for a difficult conversation with a senior stakeholder. Are there any things you do when preparing for that to try to make it just a little more likely to go smoothly?
D: A lot of my preparation for moments like that happens long before the moment. A lot of us have used the word trust at various times, and that’s huge. I’m trying to establish trust with stakeholders and partners from day one, because so many of these moments are going to rely on trust to go the way they need to go. The other thing I try to do in the moment, when it comes to explaining a difficult truth, is to take any of the emotions out of it. I try to lay out something that’s very fact-based.
Cat: I very much agree with the emotional regulation piece as a key part. If I have the leeway and the time, the best thing I can do is I can sit down with my coach. As we talk, I lose my emotional attachment to things, until I’m just thinking about options that are good and bad and what the cost to the business is.
Ryan: Data gathering, absolutely. Pre-reads I think are huge, meaning sending out what you plan on talking about beforehand, and making it clear that reading the pre-read is a requirement. You shouldn’t be going into the meeting and then learning about what you’re about to hear about. The pre-reads give you that opportunity to be informed before the meeting, and if successful, meetings are for making decisions.
We’ve run into situations where the pre-reads are pretty in-depth, all of the decision making and our suggestions on where to go next are already laid out, and the meeting is five minutes long.
Juan Pablo: I use paper as my coach. I believe writing is thinking, and I try to anticipate questions that might come from the conversation. If I’m walking into a board meeting, I try to minimize the times I say: I don’t know, let me get back to you.
I have my talking points. What is the outcome of the conversation that I’m seeking? Am I trying to inform? Am I trying to convince? Am I trying to drive to a decision? Based on that, I bring options or I shape my talking points.
Peter: Things didn’t go according to plan, you missed the deadlines, how do you rebuild trust both within your engineering org, and with your executive stakeholders?
Cat: It’s not inherently breaking trust to miss your deadlines if you’re being transparent about your metrics and what you’re seeing as it goes along. It’s mostly that transparent communication that will leave no one surprised.
Ryan: I think rebuilding trust is really about consistency and showing continuous improvement. We’ve been using some of the DORA Metrics that Code Climate has been putting out.
We have custom reports for DORA Metrics, and they’ve been really awesome. Being able to show that the team is performing, that the issue that we ran into was kind of out of our control, and showing there’s an upward progression to how they’re performing…it’s big to show that they’re not not performing.
Juan Pablo: I usually lead product engineering teams, and so the focus is less the plan or the deadline and more the outcome, so ensuring that the teams understand the goal that they’re supposed to be driving. And in product, your goals are so variable, and you can invest 6 months launching a feature that tanks or spend a week and suddenly you have a great product, and so what I care about is… less about times and deadlines and estimates and plans and more about, are you being impactful and are you shipping as fast as you can so we can learn?
D: I would underscore that rebuilding trust is really about being reliable in the things that you say. Communication is important. We had talked about diagnosing the real problem, and now when you’re going and acting on that and executing. The second time around, are you hitting what you aimed to hit based on the problem that you diagnosed? Hopefully you are doing a good job of identifying what that real problem is and then when you drive the team to execute towards that milestone, it actually solves what you said it was going to solve … as you do that you’re rebuilding trust.
Audience member: [To Juan Pablo] Tactically, how often are you resetting your principles because you can’t make the mark or realize priority two has to be priority one?
Juan Pablo: I’m doing a good job if I’m not resetting them that much, or they at least have an 18-24 month lifespan. I do start from a mission. When I was at Splice, the mission of engineering was to enable Splice to learn faster than the market before we ran out of money. So that was driving engineers, that was our mission, anything you do is in service of that, because we’re serving musicians.
And from there, the principles that we set were about sensible choices in technology. We were like, yes it’s fun to learn, but our job is not to learn; our job is to learn faster than the market. I also crowdsourced feedback from the team as far as what resonated with them in regards to our principles, because usually I don’t have the full perspective. If there’s ownership from the group, it’s easier for them to also embrace the principles.
Audience member: There’s a known standard in the tech industry of listening to your customers versus understanding business objectives from leadership. What has been your experience trying to carve in both business objectives and customer feedback?
Cat: More and more, I think every dichotomy in tech is long- and short-term planning. For example, I think that tech debt is long term and product and desires is short term, and I think what you’re talking about a little bit here is what your customers are beating down your door right now, whereas presumably your business metrics are about your long range plans, what your business needs to grow, what our burn rate needs to be… And I don’t necessarily have an answer for you, but I think dispassionately thinking about how much are we investing immediately — how much do we need to do this month or this year, versus three years from now? — is an interesting way to think about your portfolio across a lot of different things like this.
Ryan: I worked at a company where it was very referral based, and the business metrics were: How many referrals did we make, and how much revenue did we make from that referral? The other side of that is, how happy is your customer? Does a happier customer actually produce more revenue? Maybe not in the very short term, but repeat customers, and happier folks in the marketplace of that particular referral business goes a long way. The business is able to interact with a consumer that’s happy and potentially upsell them and so on.
Juan Pablo: Usually we’ve done a good job as a leadership team if we’ve set business metrics that empower teams to take these customer needs and act on them. Because customer needs and business metrics should not be diametrically opposed, and if they are, there’s something wrong.

Changes within a company, like growth, restructuring, down-sizing, or shifting goals, can be disruptive for engineering teams.
Developers often look to team leads to understand how these organizational changes will impact them. Amid transitions and uncertainty, engineering leaders can be a beacon for their teams and help maintain the culture that they’ve cultivated.
Read on for four steps leaders can take to continue to have a positive impact on engineering team health:
Prioritize psychological safety
A phrase often referenced in leadership is psychological safety, the idea of fostering a culture within your team where engineers are comfortable taking risks, openly expressing their concerns, and sharing ideas. Tactics for enhancing psychological safety can include:
- Leading with curiosity to find a root cause of a failure or bottleneck.
- Focusing on the work, not the engineer themselves, when identifying issues.
- Creating a safe culture free from microaggressions.
- Getting to know direct reports on an interpersonal level.
Psychological safety promotes employee satisfaction, and it also often leads to better team performance.
As Heidi Waterhouse, Principal Developer Advocate at LaunchDarkly said during our webinar on using data to promote psychological safety, “The faster a team moves, the more psychologically safe they are, the more they feel like they can take risks, but also the more they feel like they can take risks, the faster they move.”
Keep an eye out for burnout
Burnout is present across all industries, especially after the work from home era upended the way we work and challenged us to reevaluate our priorities.
Understandably, feelings of burnout are not something employees often want to share with team leads, and once they get to that point, it might be too late to offer solutions. Managers might need to do some exploring in order to address burnout before it becomes a problem.
Code Climate identified and addressed burnout on our own engineering teams by dogfooding Velocity.
After several 1-on-1s revealed that engineers were excited about their work but feeling under pressure to ship new features, our engineering manager used Velocity’s Reports Builder to find out the number of pushes that happened after 8 pm. This inquiry revealed the team was working late more often than in previous months.
Their manager used this data to make two key changes: adjusting the scope of their work to something more more manageable, and giving engineers days off. She continued to check in with her team and make sure work was evenly distributed among ICs.
Spotting and tackling undesirable trends, like engineers working on nights and weekends, allows leaders to make necessary changes before their teams experience burnout.
Use metrics to communicate the business value of your team
During board meetings and stakeholder conversations, engineering leaders act as the advocates and representatives for engineering teams. It’s important for developers to know that their team leaders are championing their work, and communicating their impact with stakeholders.
Software engineering teams power organizations, but because it’s so hard to quantify engineering work, it can be difficult to demonstrate the true value that work brings to the business.
With metrics, engineering leaders can make a business case for their teams by demonstrating trends in numbers to stakeholders. For example, the CTO of WorkTango, Mike Couvillion, uses revenue-specific metrics when presenting to his board of directors.
In board slides, Couvillion now uses the following metrics to demonstrate efficiency:
- Innovation Rate
- PR Throughput
- Cycle Time
- Average Coding Days
Objective data also helps leaders advocate for new talent or tools, because they can clearly demonstrate how those resources will help the company meet their goals.
Address engineers’ concerns with enhanced 1-on-1s
As we mentioned above, metrics are highly useful for showcasing the impact of your engineering teams, spotting burnout in advance, and identifying when and where teams might be stuck.
Metrics can also enhance 1-on-1s, and ensure that conversations are actionable. You can bring concerning trends or units of work that need to be addressed to a meeting, and work with that team member to come up with a plan for improvement. Or, you can call out and celebrate successes, such as positive trends or progress towards goals.
Yet metrics can’t replace conversations with direct reports, and 1-on-1s should leave room for topics beyond progress and performance.
Part of fostering a positive culture is getting to know employees on an interpersonal level, demonstrating that you recognize their hard work, and offering collaboration and coaching when things go off track.
Taking the right steps
If your company is going through a transition, it’s important to address your engineering team directly. Pay attention to cultivating or maintaining a culture of psychological safety so they can express their concerns or take a risk by trying something new; be on the lookout for conditions that might cause burnout; be their champion when talking to stakeholders; and have more impactful 1-on-1 conversations to address issues and offer support.
To learn more about using metrics to enhance board meetings and 1-on-1s, speak with a Velocity product specialist.
Reporting key engineering data is an effective way for leaders to illustrate their teams’ progress. Whether you’re using engineering data in standups, retros, or presentations with stakeholders, these objective insights can help you align engineering goals with business goals and stay on track with delivery.
While engineering leaders benefit from viewing all of their team metrics within Velocity, other stakeholders will not always have access to the platform. Key collaborators have their own Business Intelligence tools, including Tableau and Power BI, that they prefer for viewing metrics and reports. Members of your organization even have custom reporting templates or other tried and trusted processes for viewing and analyzing data.
With Code Climate’s Metrics API, you don’t have to alter stakeholders’ existing processes: instead, you can extract metrics from Velocity into existing BI tools in order to build tailored reports across the organization, and communicate with outside parties on how engineering initiatives align with business outcomes to communicate upwards on progress.
With this tool, you can evaluate and measure your engineering team’s performance and business impact over time. Rather than keeping engineering data siloed, organizations can connect the dots and analyze engineering and business data together with the Metrics API.
What You Can Get Out of a Metrics API
By using Velocity’s Metrics API, you can improve transparency across teams, putting numbers into a context and environment that stakeholders are familiar with.
Metrics API allows users to leverage up to 365 days of historical data, making it possible to review trends month over month. If you’ve made organizational changes over the past year, such as hiring more developers, data can show how those changes have impacted the business.
How it Works
To start using Metrics API:
- Generate an API token within your page settings (for Velocity users with admin privileges).
- Use the token to create a GET request to pull data out of Velocity (the specific API token will not expire once created).
- Once you ingest Velocity data into your preferred BI tools (Power BI, Tableau) or Excel spreadsheets, you can analyze your team’s metrics together with your business data.
- Users cannot change, edit, or delete any of the metrics data pulled out of Velocity with Metrics API.
Who Can Use Metrics API?
Code Climate’s Metrics API allows organizations to export data from Velocity into any Business Intelligence tools they already use. This comprehensive tool is one of Velocity’s many robust API capabilities, allowing your organization to pull or extract, customize, and modify data specific to your needs.
Now that you can extract your Velocity data, you can connect engineering and business insights for more meaningful takeaways. Read our tips for CTO and CEO alignment, and learn why engineering metrics are business metrics.
The most successful engineering leaders incorporate objective data into their leadership strategies. Numbers can’t substitute for a CTO’s experience and instincts, but when it comes to decision-making, leaders can use metrics in software engineering to inform their decisions and align with stakeholders.
Different leaders optimize for a different set of metrics depending on company priorities and the needs of their engineering teams. Yet, if you’re introducing metrics to your team, or refining your approach to metrics, there are key measurements worth considering.
At Code Climate, we’ve worked with thousands of organizations, from startups to enterprises, and we know that there are a few key metrics that have proven time and again to be valuable, even if they’re just a starting point!

Whether you’re just starting to incorporate data into your leadership, or are refining your approach to measurement, these 10 metrics are important ones to consider.
They can help you:
- Get a handle on your organization’s Time to Market,
- Ensure your team is adhering to CI/CD best practices,
- Measure the quality of your code, and
- Assess the efficacy of your planning processes.
To find out which 10 metrics you need to know, how to apply them effectively and resolve bottlenecks, download the ebook.

In the midst of pandemic lockdowns, VTS, a leading provider of commercial real estate technology, was in a period of rapid growth. In addition to aggressive hiring, VTS grew through acquisitions, adding Rise Buildings and Lane to its portfolio. Soon after onboarding, they discovered the new teams had less effective SDLC processes, which caused Cycle Time to trend toward 80 hours — nearly double the average Cycle Time of the core VTS team.
Engineering leadership leaned heavily on Code Climate as they incorporated the new teams and integrated the new products into the VTS platform. They leveraged Code Climate's partnership to investigate bottlenecks, and discovered the teams were spending Cycle Time resolving issues and needed more efficient workflows.
Fostering an Elite Engineering Culture
Being customer-obsessed and striving for excellence are the core tenets are the foundation of VTS culture. And for engineering, these values drive an ambitious vision of producing elite engineering talent who innovate to serve customers, achieve business outcomes, and positively impact the broader tech industry.
With more than 20 teams and 200-plus engineers, VTS fosters a high-caliber engineering culture built on mutual trust. They have collectively embraced a vision of engineering excellence, and they leverage Code Climate to measure proficiency and success, surface bottlenecks, and actively explore ways to improve. Code Climate's solution delivers end-to-end visibility into the entire development pipeline, which is crucial for tracking engineering progress and achieving OKRs with a large, distributed team.
Prashanth Sanagavarapu, Head of Platform Engineering at VTS, said without these insights, every decision would be a shot in the dark. “As a manager, my worst nightmare is running blind. I need to make decisions based on data and facts, and Code Climate provides exactly what we need.”
Metrics That Matter
For VTS, Code Climate provides visibility into the metrics that matter, and it is more intuitive and robust than what is built into other engineering tools. For example, Jira reporting was inadequate because it lacked context, and engineering leaders couldn’t compare metrics to industry standards.
“An ops team may close 100 tickets, but what does that mean? Someone has to go into each ticket and read the description to understand what is happening, and that just isn’t sustainable,” said Sanagavarapu.
Code Climate allows them to analyze factors like Pull Request (PR) size, frequency, and time to close, enabling them to optimize workflows to consistently deliver incremental value and maintain engineering velocity. Sanagavarapu said he learns quite a lot through the platform: “It’s a fact tool for me. I can see the trends of what is working and what isn’t working for a particular squad and correlate it back to sprint retros.”
Cycle Time is the north star metric at VTS. Measuring Cycle Time every two weeks with Code Climate provides visibility into how fast they are shipping, both organization-wide and at the team level, and it enables them to quickly see when fluctuations occur. Then, within the platform, they can easily drill down to identify choke points and dependencies that may be impacting performance. Understanding if the Cycle Time went up due to outages, open RFCs, or a change in personnel helps leaders to understand trends and better allocate resources to ensure their teams have what they need to be successful.
Sanagavarapu said the ability to drill down to the individual contributor level is very impactful because it allows you to diagnose problems at any level and scale. Since partnering with Code Climate, they have improved Cycle Time by 30% and doubled their deployment frequency.
“Our average Cycle Time tends to be around 35 hours with 48 hours as our max threshold. When we exceed that, we know there is something going on. If it’s not a holiday or another known factor, we can dig to discover and understand the problem and who is being impacted — then, we can solve it.”
Maintaining Excellence During Rapid Growth
Enhanced visibility has been crucial for engineering leadership over the past two years, with company growth accelerating during challenging pandemic lockdowns. Sanagavarapu said more than 60% of the company’s 600-plus employees joined during this time, most of whom were engineers.
Infrastructure stability was a big challenge, so they worked to reduce the number of incidents so that dev teams could spend more time on value-add work. When they discovered a lag time in PRs due to time zone differences, they changed their workflows to reduce the time for feedback and better manage resources across teams. They also added in more test cycles so that rework happened less frequently. Now, the entire engineering organization maintains Cycle time under its 48-hour threshold.
“Code Climate provided insights that helped us accelerate integrating those teams into our culture and processes more quickly and effectively,” Sanagavarapu said.
Measuring Impact
VTS leverages Code Climate's solution to track and quantify impact at all levels. Engineering leadership can measure business impact by translating metrics into stories that show how engineering delivers value. They can understand how quickly teams deliver new features that are important for customers and compare the time spent on new feature work to rework time to ensure engineering time and resources are optimized.
Code Climate surfaces important trends that help engineering managers better understand the impact of process and workflow changes on developer experience. They can drill down to the developer level to diagnose issues and determine what might be consuming a squad’s time. Visibility into engineering capacity helps planning for major initiatives, allowing them to best leverage internal resources and balance workloads with external contractors.
As VTS works continuously to innovate, evolve, and achieve both engineering and business milestones, the insights derived from Code Climate are invaluable, Sanagavarapu explained. “Code Climate is not a reporting tool. It’s the heart of engineering excellence.”
Request a consultation to learn how to maximize engineering impact.
Metrics are an essential tool for engineering leaders looking to gain objective insights about the teams they manage. In order to improve business outcomes and overall team health, leaders must identify which metrics to track and apply the data with intention.
Code Climate’s Senior Product Manager, Mike Koeneke, sat down with three directors of engineering: Sophie Roberts of Shopify; Mojtaba Hosseini of Zapier; and Romain Dupas of Code Climate, to discuss how they each define and utilize metrics to meet their goals.
Read on for highlights from their conversation. Answers have been shortened for length and clarity.
Defining Metrics: Which metrics do engineering leaders look at, and why?
Sophie: There are four kinds of metrics I look at on a regular basis:
- Operational or system health metrics: These include SLAs, API failure rates, system throughput — the things that tell you, as an engineering leader, if your product is healthy.
- Development metrics: Your average time to commit, your average build time, and your build success failure, which fall under engineering productivity, helping us understand how to improve the productivity of our engineering teams.
- Organizational health metrics: Team composition, retention, employee morale, and ability to actually hit goals that you set. It helps us understand if our people are in a good place and are being effective.
- Business metrics: These metrics show that the business is moving forward. Are we having the impact on the business that we expect to have with regards to things like revenue, customer acquisition, efficiency?
Mojtaba: One thing we’ve started to do at Zapier is to talk about hierarchy of metrics that go beyond engineering, and trying to tie in the engineering metrics into a larger set. As a SaaS company, we’ve got our financial metrics which are very top of mind for the board and the C levels…[so for example,] your customer metrics: your churn and activation…if you’re developing quickly, if you’re getting that feedback, if your teams are high performing and happy and engaged. If so, you probably are creating good products, which bring in users, which then brings in the revenue.
Romain: I look at metrics corresponding to all aspects of our process and our goals: Team goals such as OKRs, financial goals, computing metrics, API metrics, productivity. At the end of the day, any goal or process needs to be measurable. Defining those goals and metrics will make the process more efficient.
Balancing Intuition With Objective Data
Sophie: The superpower of actually using metrics is to combine the data with judgment and instincts. If someone on your team is in the lower bound of what you’ve chosen as a performance metric, and you substitute the metric for your judgment and say they’re underperforming, you’re making a bad decision.
When it comes to things like organizational metrics or individual performance metrics, I don’t even look at those as objective pieces of data. I look at those as pieces of data that allow us to explore the margins and find things to be curious about. That’s where your judgment and instinct come in.
Mojtaba: I have a mental model around using metrics: the dashboard of a car. The car’s purpose is to serve the drivers and the passengers. The dashboard, intrinsically, is of no real value if the humans don’t get where they want to go.
You need the objective data: What is my speed? What is the oil gauge telling me? The speedometer? But you still need the human to decide where to go. [As the driver], I might know the maintenance history of the car, so even if the manufacturer tells me I can go faster, I’m not going to push the car to the maximum speed — because of experience and intuition. The intuition by itself can be too vague and needs the objective data, a reality check. But the reality check without that vision just becomes a bunch of numbers.
Romain: Continuing with the car analogy, on the dashboard is a limited amount of space to show the information that matters. You don’t have anything related to what’s in your trunk; the only information you have is what’s valuable: information about the safety of your car. With metrics, you don’t measure everything; understand what you want to measure for your own goal.
Context is Key: Make Sure Your Team Knows Their Purpose
Sophie: It’s critical for me, and I think for all businesses, for every single engineer to understand how the work contributes to the business’ success. When people understand that, then they understand what [things like] an outage actually mean for our merchants.
My engineering team will sit in on interviews with our customers on a weekly basis and they’ll just chat and understand the pain points, because it’s really important that people can tie the experience of your customers to the metrics of the work that they’re doing.
Mojtaba: The job of the leader is to understand how pieces work together and track the outcome they’re working towards. If a platform team is going very slowly, that’s okay, because they are the platform team. They build, they make it so that other teams can go faster. At a high level, we’re still going fast, but I’m not going to tell the platform team they should be going as fast as these other non-platform teams. They fulfill different functions, and it’s the aggregate of those that really brings value. That interpretation, that context, is what leaders need to bring together.
Be Transparent: Share Metrics With Your Team
Sophie: Don’t hide your business metrics from the engineering team. If I could get anyone to take an action item from this, it would be that if your engineering team isn’t getting a copy of your Monthly Business Review (MBR), make that happen.
Romain: My team and I actually set the OKRs together to be aligned with the business OKRs. I ask the team, What do you think we can do to move the organization in accordance with the business OKRs? And that works very well because it goes back to the idea of making sure that the team understands the metrics and is motivated to reach that goal, instead of imposing from the top down that you have to fit these metrics into your day-to-day work.
Using Metrics for Compensation: What to Avoid and What to Reward
Sophie: You want people to take risks, you want people to fail, and you want the metrics to reflect the fact that things failed, but you don’t want to punish people. So there are a whole bunch of cultural interdependencies there that you have to manage.
The metrics can show us if the work is successful or not, but [for me], the metrics themselves don’t tie into people’s compensation. What ties into people’s compensation is how they approach solving the problem. I think that’s the only way you can do it if you’re going to build a culture where experimentation, risk, and failure are genuinely valid, as opposed to just being talking points on a wall.
Mojtaba: We don’t use the metrics in any way, even in the conversations we have about performance. This might sound controversial, but we don’t even have performance evaluation of individual contributors tied to compensation. We have competency levels tied to compensation.
Romain: Metrics are a foundational bed to talk with my engineers about how we can make our process better. And the compensation aspect would be more about where we are today, and where we want to be. Who are the contributors that are going to lead the team, and what will be the involvement and quality of their contribution? [I base compensation on] what their work brings to the table to help the company, more than on the metrics themselves.
To find out what else Sohpie, Mojtaba, and Romain had to say, listen to the full discussion here.
To find out how you can maximize engineering impact, request a consultation.

When evaluating their team’s health, engineering leaders might look to anecdotal data or rely on instinct. While valuable, these only tell part of the story.
By incorporating metrics into your leadership strategies, you can gain more precise insight into how your teams work. Data provides objective evidence that, if thoughtfully interpreted, can help leaders effectively manage teams to produce better software more efficiently.
Within a business, most departments — including marketing, finance, and HR — use some form of metrics to inform critical decisions. Engineering can also reap the benefits of data: these numbers can provide fact-based support when leaders are looking to create alignment or generate buy-in from key stakeholders. Data also offers engineering leaders a starting point for 1-on-1s, standups, and retros with developers — with metrics, meetings, and coaching conversations remaining objective and rooted in fact.
The idea of tracking and measuring developer productivity can feel like micromanaging, or worse, surveillance, and engineering leaders might be hesitant to introduce metrics to the team. In this ebook, we cover key strategies for introducing metrics in positive ways that avoid blame and promote psychological safety. (Hint: metrics give you insight about the work, not the developers themselves).
You’ll also find:
- How metrics improved delivery for engineering teams and addressed biases for real organizations
- Which metrics to track and how often
- How metrics can both reinforce and challenge your assumptions — and why both are good things
For a deeper dive into the fundamentals of engineering metrics, download our ebook.
Want to learn more about how to best address your team’s challenges? Request a consultation.
Ten years ago, very few people tracked their steps, heart rate, or sleep. Sure, pedometers existed, as did heart rate monitors and clunky sleep monitors, but they weren’t particularly commonplace. Now, it’s not uncommon to know how many steps you’ve taken in a day, and many people sport metal and plastic on their wrists that monitor their activity, heart rate, and sleep quality.
What changed?
In the past, that information was inconvenient to access, and found in disparate places. Nowadays, fitness trackers and smart watches bring together all of that data so we can tap into it to make decisions.
Imagine this: I sit at my desk all day. I glance down at my fitness tracker and it says I’ve only taken 100 steps today. I feel really tired. What do I do? Take a walk? Drink another cup of coffee? Let’s say I take a walk. Awesome! A quick stroll to the park after lunch and I’ve reached my step goal of 8,000 steps! I feel great. I sleep well and my tracker says I got 8 hours.
The next day, faced with the same afternoon drowsiness, I skip the walk and opt for a second coffee. I sleep poorly, and when I wake up, I see that I only got 4 hours of sleep.
On the third day, instead of reaching for some caffeine, I choose to take a walk. It was a data-informed choice. Without the data, I might have ruined my sleep schedule by again drinking coffee too late in the day and later wondering why I felt so tired.
So, what does this have to do with engineering data? Ten years ago, the process of gathering engineering data involved a mishmash of spreadsheets, gut feel, and self-evaluation. Leaders faced a black hole with no easily accessible information in one place.
Code Climate Velocity changes that. Now, it’s possible to view trends from the entire software development lifecycle in one place without having to wrangle reports from Jira or comb through Github. Putting everything together not only makes the data more accessible, it makes it easier to make informed decisions.
Let’s say I want to boost code quality by adding second code reviews to my coding process. Sounds great, right? More eyes on the code is better? Not quite. The data we’ve gathered from thousands of engineering organizations shows that multiple review processes tend to negatively impact speed to market. Why? Naturally, by adding an additional step to the process, things take longer.
But what if those second reviews lead to higher code quality? Code Climate Velocity gives you insight into things like Defect and Rework Rates, which can validate whether quality increases by implementing second reviews. If the data within Velocity were to show that Cycle Time increases and second reviews have no effect on Defect Rate (or worse, if they increase Defect Rate), then maybe we shouldn’t have that second cup of coffee…er, second code review.
This is exactly the situation I ran into with a client of ours. A globally distributed engineering organization, they required two reviews as part of their development process. The second review typically depended on someone located multiple time zones ahead of or behind the author of the pull request. As a result, the team’s Cycle Time spanned multiple weeks, held up by second reviews that were often just a thumbs up. By limiting second reviews, the organization would save upwards of 72 hours per PR, cutting their Cycle Time in half. They would also be able to track their Defect Rate and Rework Rate to ensure there were no negative changes in code quality.
We don’t want to know that drinking a second cup of coffee correlates with poor sleep — that is scary. But by being alerted to that fact, we are able to make informed decisions about what to do and how to change our behaviors. Then, we can measure outcomes and assess the efficacy of our choices.
There is a common misconception that applying metrics to engineering is scary — that it will be used to penalize people who don’t meet arbitrary goals. Just as smart watches don’t force you to take steps, engineering data doesn’t force your hand. Code Climate Velocity presents you with data and insights from your version control systems, project management systems, and other tools so that you can make data-informed choices to continue or change course and then track the outcome of those choices. Like fitness and sleep data, engineering data is a tool. A tool that can have immense value when used thoughtfully and responsibly.
Now, go reward yourself with some more steps! We’ve brought the wonderful world of data into our everyday lives, why not into engineering?
To find out what kinds of decisions a Software Engineering Intelligence platform like Velocity can help inform, reach out to one of our specialists.
What’s the practical value of DORA metrics, and how are real engineering organizations using them? To find out, we invited a panel of engineering leaders & industry experts to share their experiences.
Code Climate Senior Product Manager Madison Unell moderated the conversation, which featured:
- Scott Aucoin, Technology Director at Liberty Mutual
- Emily Nakashima, VP of Engineering at Honeycomb
- Karthik Chandrashekar, SVP of Customer Organizations at Code Climate
Over 45 minutes, these panelists discussed real-world experiences using DORA metrics to drive success across their engineering organizations.
Below are some of the key takeaways, but first, meet the panelists:
Scott Aucoin: I work at Liberty Mutual. We’ve got about 1,000 technology teams around the world. We’ve been leveraging DORA metrics for a while now. I wouldn’t say it’s perfect across the board, but I’ll talk about how we’ve been leveraging them. The role that I play is across about 250 teams working on our Agile enablement, just improving our agility, improving things like DevOps and the way that we operate in general; and our portfolio management work…from strategy through execution; and user experience to help us build intuitively-designed things, everything from the frontend of different applications to APIs. So finding ways to leverage DORA throughout those three different hats, it’s been awesome, and it’s really educating for me.
Emily Nakashima: I’m the VP of Engineering at a startup called Honeycomb. I manage an engineering team of just about 40 people, and we’re in the observability space. So basically, building for other developers, which is a wonderful thing. And we had been following along with DORA from the early days and have been enthusiasts and just made this switch over to using the metrics ourselves. So I’m excited to talk about that journey.
Karthik Chandrashekar: I’m the Senior VP of our Customer Organization at Code Climate. I have this cool job of working with all our engineering community customers solving and helping them with their data-driven engineering challenges. DORA is fascinating because I started out as a developer myself many years back, but it’s great to see where engineering teams are going today in a measurement and management approach. And DORA is central to that approach in many of the customer organizations I interact with. So I’m happy to share the insights and trends that I see.
Why did your organization decide to start using DORA?
Emily Nakashima: I first came to DORA metrics from a place of wanting to do better because we’re in the DevOps developer tooling space ourselves. Our executive team was familiar with the DORA metrics, and we had used them for years to understand our customers, using them as a tool to understand where people were in their maturity and how ready they would be to adopt our product…we had this common language around DORA…[At the same time,] our engineering team was amazing, and we weren’t getting the credit for it that we deserved. And by starting to frame our performance around the DORA metrics and show that we were DORA Elite on all these axes, I think it was a really valuable tool for helping to paint that story in a way that felt more objective rather than just me going, “We’ve got a great team.” And so far, honestly, it’s been pretty effective.
Scott Aucoin: Liberty Mutual being a 110-year-old insurance company, there are a lot of metrics. There are some metrics that I think we might say, “Okay, those are a little bit outdated now.” And then there are other ones that the teams use because they’re appropriate for the type of work the teams are doing. What we found to be really valuable about DORA metrics is their consistency…and the ability to really meet our customers and their needs through leveraging DORA metrics.
Karthik Chandrashekar: Speaking with a lot of CTOs and VPs of different organizations, I think there’s a desire to be more and more data-driven. And historically, that has been more around people, culture, teams, all of that, but now that’s transcended to processes and to data-driven engineering.
How did you go about securing buy-in?
Scott Aucoin: This has been pretty grassroots for us. We’ve got about 1,000 technology teams across our organization. So making a major shift is going to be a slow process. And in fact, when it’s a top-down shift, sometimes there’s more hesitancy or questioning like, “Why would we do this just because this person said to do this?” Now, all of a sudden, it’s the right thing to do. So instead, what we’ve been doing and what’s happened in different parts of our organization is bringing along the story of what DORA metrics can help us with.
Emily Nakashima: The thing I love about Scott’s approach is that it was a top-down idea, but he really leveraged this bottom-up approach, starting with practitioners and getting their buy-in and letting them forge the way and help figure out what was working rather than dictating that from above. I think that it’s so important to really start with your engineers and make sure that they understand what and why. And I think a lot of us have seen the engineers get very rightly a little nervous about the idea of being measured. And I think that’s super-legitimate because there’s been so many bad metrics that we’ve used in the past to try to measure engineering productivity, like Lines of code, or PRs Merged. I think we knew we would encounter some of that resistance and then just a little bit of concern from our engineering teams about, what does it mean to be measured? And honestly, that’s something we’re still working through. I think the things that really helped us were, one, being really clear about the connection to individual performance and team performance and saying, we really think about these as KPIs, as health metrics that we’re using to understand the system, rather than something we’re trying to grade you on or assess you on. We also framed it as an experiment, which is something our culture really values.
DORA’s performance buckets are based on industry benchmarks, but you’re all talking about measuring at the company level. How do you think about these measures within your company?
Emily Nakashima: This was absolutely something that was an internal debate for us. When I first proposed using these, actually, our COO Jeff was a proponent of the idea as well. So the two of us were scheming on this, but there was really resistance that people pointed out that the idea of these metrics was about looking at entire cohorts. And there was some real debate as to whether they were meaningful on the individual team or company level. And we are the engineering team that just likes to supplement disagreements with data. So we just said, that might be true, let’s try to measure them and see where it goes. And I will say they are useful for helping us see where we need to look in more detail. They don’t necessarily give you really granular specifics about what’s going wrong with a specific team or why something got better or worse. But I do think that they have had a value just for finding hotspots or seeing trends before you might have an intuition that the trend is taking place. Sometimes you can start to see it in the data, but I think it was indeed a valid critique, ’cause we’re, I think, using them in a way that they’re not designed for.
Something important about the DORA metrics that I think is cool is that each time they produce the report, the way they set the Elite and High and other tiers can change over time. And I like that. And you also see a lot of movement between the categories…And to me, it’s a really good reminder that as engineering teams, if we just keep doing the same thing over and over and don’t evolve our practices, we fall behind the industry and our past performance.
Scott Aucoin: I look at the DORA metrics with the main intent of ensuring that our teams are learning and improving and having an opportunity to reflect in a different way than they’re used to. But also, because of my competitive nature, I look at it through the lens of how we are doing, not just against other insurance companies, which is critical, but setting the bar even further and saying, technology worldwide, how are we doing against the whole industry? And it’s not to say that the data we can get on that is always perfect, but it helps to set this benchmark and say, how are we doing? Are we good? Are we better than anyone else? Are we behind on certain things?
Karthik Chandrashekar: One thing I see with DORA as a framework is its flexibility. So to the debate that Emily mentioned that they had internally, it’s a very common thing that I see in the community where some organizations essentially look at it as an organizational horizontal view of how the team is doing as a group relative to these benchmarks.
What pitfalls or challenges have you encountered?
Karthik Chandrashekar: From a pure trend perspective, best practice is a framework of “message, measure, and manage.” And not doing that first step of messaging appropriately with the proper context for the organization means that it actually can cause more challenges than not. So a big part of that messaging is psychological safety, bringing the cultural safety of, “this is to your benefit for the teams.” It empowers. The second thing is we all wanna be the best, and here’s our self-empowered way to do that. And then thirdly, I think, “how do we use this to align with the rest of the organization in terms of showcasing the best practices from the engineering org?”
So the challenges would be the inverse of the three things I mentioned. When you don’t measure, people look at it as, “Oh, I’m being measured. I don’t wanna participate in this.” Or when you measure, you go in with a hammer and say, “Oh, this is not good. Go fix it.” Or then you do measure, and everything is great, but then when you are communicating company-wide or even to the board, then it becomes, hey, everything’s rosy, everything is good, but under the hood, it may not necessarily be…Those are some of the challenges I see.
Emily Nakashima: To me, the biggest pitfall was just, you can spend so much time arguing about how to measure these exact things. DORA has described these metrics with words, but how do you map that to what you’re doing in your development process?
For us in particular, we have an hour-timed wait for various reasons because things roll to a staging environment first and get through some automated tests. Our deployment process is an hour. We will wait for 60 minutes plus our test runtime. So we can make incredible progress, making our test faster and making the developer experience better. And we can go from 70 to 65 minutes, which doesn’t sound that impressive but is incredibly meaningful to our team.
And people could get focused on, “Wait, this number doesn’t tell us anything valuable.” And we had to just say, “Hey, this is a baseline. We’re gonna start with it.” We’re gonna just collect this number and look at it for a while and see if it’s meaningful, rather than spend all this time going back and forth on the exact perfect way to measure. It was so much better to just get started and look at it, ’cause I think you learn a lot more by doing than by finding the perfect metric and measuring it the perfect way.
Scott Aucoin: You’re going to have many problems, more than your DevOps practices. And Emily, I think the consistency around how you measure it is something we certainly have struggled with. And I would say in some cases, we still wonder if we’re measuring things the right way, even as we’ve tried to set a standard across our org. I’ll add to that, though, and say the complexity of the technology world, in general, is a significant challenge when you’re trying to introduce something that may feel new or different to the team or just like something else that they need to think about…You have to think about from the standpoint of the priorities of what you’re trying to build, the architecture behind it, security, the ability to just maintain and support your system, your quality, all of the different new technology that we need to consider ways to experiment all of that. And then, and we throw in something else to say, “Okay, make sure you’re looking at this too.” I think just from a time capacity and bandwidth perspective. It can be challenging to get folks to focus and think about, okay, how can we improve on this when we have so many other things we need to think about simultaneously?
What are you doing with DORA metrics now?
Scott Aucoin: It’s a broad spectrum. We’re doing all these fantastic things. Some groups are still not 100% familiar with what it means to look at DORA metrics or how to read them.
It’s kind of a map and compass approach. You’re not only looking at a number; you’re able to see from that number what questions you have and how you can learn from it to map out the direction you want to go. So if you’re lagging behind in Deployment Frequency, maybe you want to think more about smaller batches, for example. So within our teams, we’re looking at it through that lens.
And again, it’s not 100% of the teams. In fact, we still have more promotion and adoption to do around that, but we have the data for the entire organization. So we also look at it from the levels of the global CIO and monthly reports that are monthly operational reports that go to the global CIO. And while I can think about someone who I’ve gotten to know over the last few months, Nathen Harvey, who’s a developer advocate for Google’s DORA team, I have him in the back of my mind as I say this, as he would say, “The metrics are really for the teams.”
We think about the value of it from the executive level as well. And when we think about the throughput metrics of Deployment Frequency and Lead Time for Changes, we can get a little bit muddy when you roll up thousands of applications to this one number for an exact, especially since many of those applications aren’t being worked on regularly. Some are in more of a maintenance mode. But when we can focus on the ones actively being worked on and think about trends, are we improving our Deployment Frequency or not? It can lead the CIO or any of the CIOs in the organization to ask the right questions to think about “what I can do to help this?” Especially when it comes to stability, regardless of whether an application is getting worked on actively today or not, we need stability to be there. So we really are looking at them at multiple levels and trying to be thoughtful about the types of questions that we ask based on the information we’re seeing.
Emily Nakashima: My example is the backward and wrong way to do this. I started by basically just implementing these myself for myself. And the first thing I did with them was to show the stakeholders that I was trying to paint this story too. And I think if you can start with getting practitioners to work with them, getting your software engineers to work with them first, tune them a little bit, and find them relevant, I honestly think that’s the best approach in the organization if you could do it. That wasn’t the situation I happened to be in, but I started with that, used them to radiate these high-level status numbers to other folks on the exec team and the board, and then started to roll them out team by team to allow for that customization.
So we’re still in that process now, but I started to pull managers in one by one and go, hey, these metrics that I’m tracking, this is what they mean to me. Let’s sit down together and figure out what’s gonna be meaningful for your engineering team and how to build on this baseline here…Let’s build on top of it together.
And we’re hoping to get into this quarter to have teams start working with them more directly and get more active in tuning and adding their metrics. We think about observability for systems, and we always want people to be adding instrumentation to their systems as they go. Each time you deploy a feature, add instrumentation that tells you whether or not it’s working. And we wanna bring that same approach to our engineering teams where we have these baseline metrics. If you don’t think they’re that good and they don’t tell you that much, then you go ahead and tell us what metric we add, and we’re gonna work together to build this higher fidelity picture that makes sense to you, and then also have that shared baseline across teams.
To hear more from our panelists, watch the full webinar here.