Resources & Insights
Featured Article
Navigating the world of software engineering or developer productivity insights can feel like trying to solve a complex puzzle, especially for large-scale organizations. It's one of those areas where having a cohesive strategy can make all the difference between success and frustration. Over the years, as I’ve worked with enterprise-level organizations, I’ve seen countless instances where a lack of strategy caused initiatives to fail or fizzle out.
In my latest webinar, I breakdown the key components engineering leaders need to consider when building an insights strategy.
Why a Strategy Matters
At the heart of every successful software engineering team is a drive for three things:
- A culture of continuous improvement
- The ability to move from idea to impact quickly, frequently, and with confidence
- A software organization delivering meaningful value
These goals sound simple enough, but in reality, achieving them requires more than just wishing for better performance. It takes data, action, and, most importantly, a cultural shift. And here's the catch: those three things don't come together by accident.
In my experience, whenever a large-scale change fails, there's one common denominator: a lack of a cohesive strategy. Every time I’ve witnessed a failed attempt at implementing new technology or making a big shift, the missing piece was always that strategic foundation. Without a clear, aligned strategy, you're not just wasting resources—you’re creating frustration across the entire organization.
Sign up for a free, expert-led insights strategy workshop for your enterprise org.
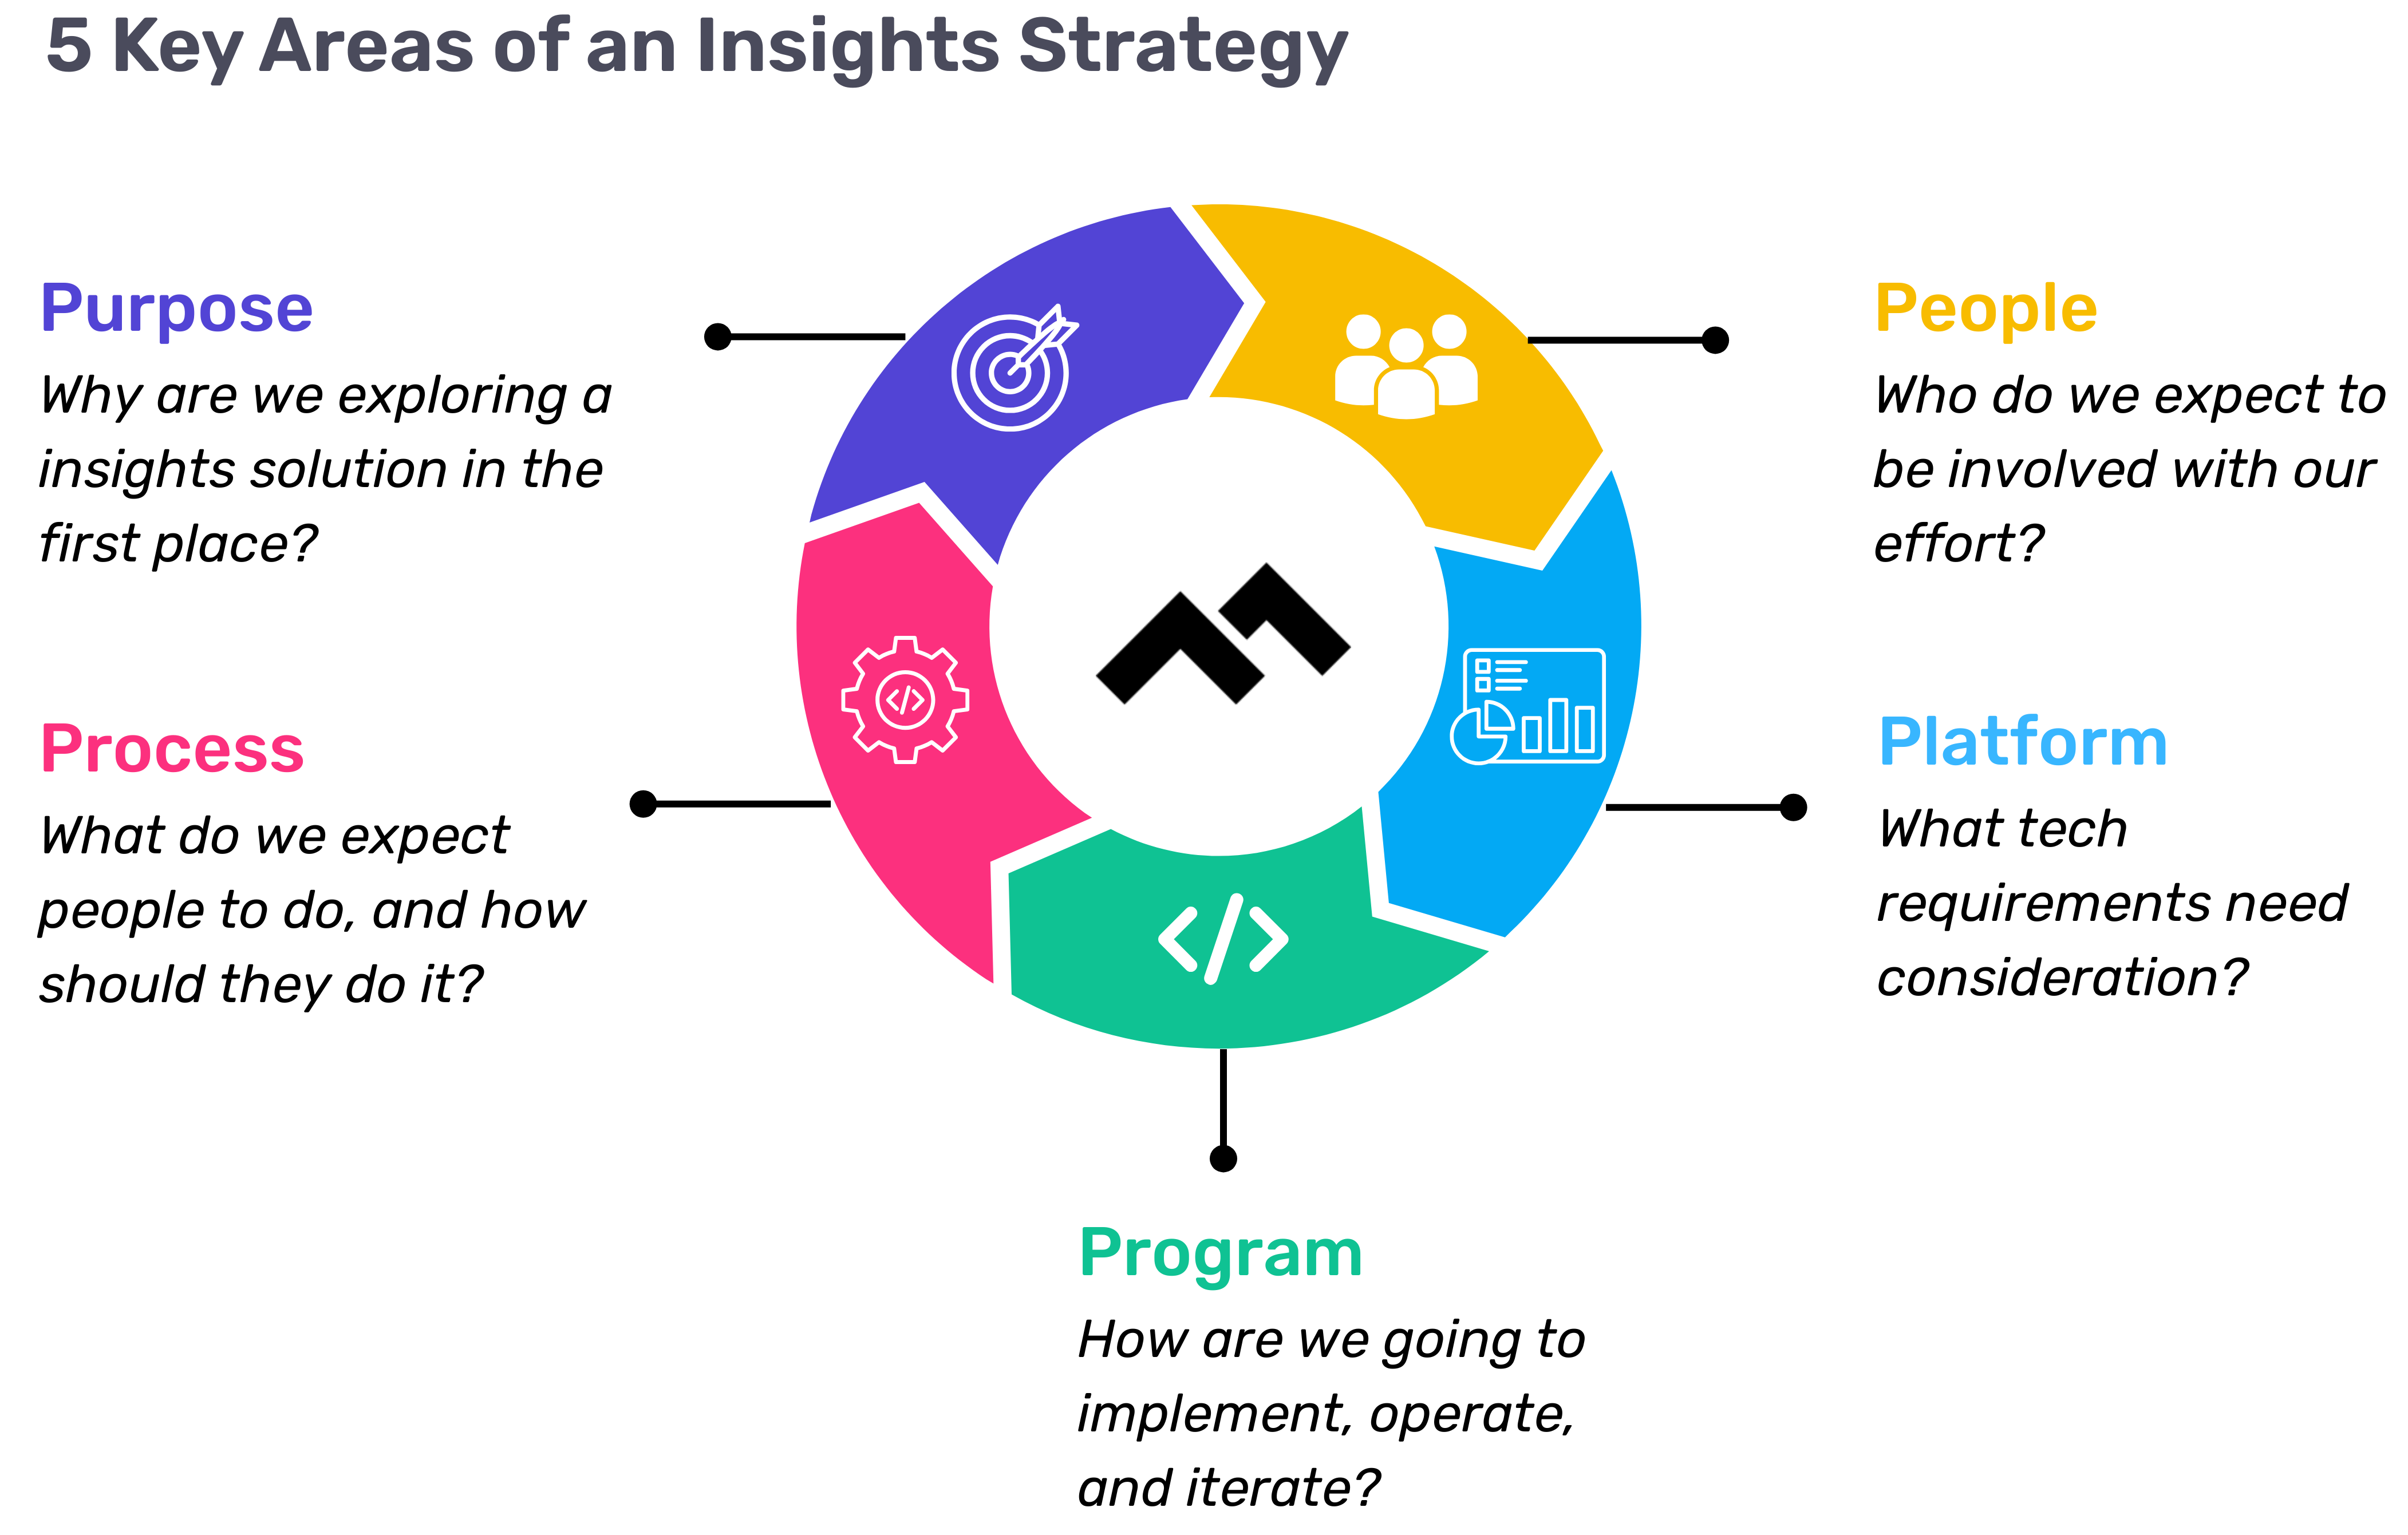
Step 1: Define Your Purpose
The first step in any successful engineering insights strategy is defining why you're doing this in the first place. If you're rolling out developer productivity metrics or an insights platform, you need to make sure there’s alignment on the purpose across the board.
Too often, organizations dive into this journey without answering the crucial question: Why do we need this data? If you ask five different leaders in your organization, are you going to get five answers, or will they all point to the same objective? If you can’t answer this clearly, you risk chasing a vague, unhelpful path.
One way I recommend approaching this is through the "Five Whys" technique. Ask why you're doing this, and then keep asking "why" until you get to the core of the problem. For example, if your initial answer is, “We need engineering metrics,” ask why. The next answer might be, “Because we're missing deliverables.” Keep going until you identify the true purpose behind the initiative. Understanding that purpose helps avoid unnecessary distractions and lets you focus on solving the real issue.
Step 2: Understand Your People
Once the purpose is clear, the next step is to think about who will be involved in this journey. You have to consider the following:
- Who will be using the developer productivity tool/insights platform?
- Are these hands-on developers or executives looking for high-level insights?
- Who else in the organization might need access to the data, like finance or operations teams?
It’s also crucial to account for organizational changes. Reorgs are common in the enterprise world, and as your organization evolves, so too must your insights platform. If the people responsible for the platform’s maintenance change, who will ensure the data remains relevant to the new structure? Too often, teams stop using insights platforms because the data no longer reflects the current state of the organization. You need to have the right people in place to ensure continuous alignment and relevance.
Step 3: Define Your Process
The next key component is process—a step that many organizations overlook. It's easy to say, "We have the data now," but then what happens? What do you expect people to do with the data once it’s available? And how do you track if those actions are leading to improvement?
A common mistake I see is organizations focusing on metrics without a clear action plan. Instead of just looking at a metric like PR cycle times, the goal should be to first identify the problem you're trying to solve. If the problem is poor code quality, then improving the review cycle times might help, but only because it’s part of a larger process of improving quality, not just for the sake of improving the metric.
It’s also essential to approach this with an experimentation mindset. For example, start by identifying an area for improvement, make a hypothesis about how to improve it, then test it and use engineering insights data to see if your hypothesis is correct. Starting with a metric and trying to manipulate it is a quick way to lose sight of your larger purpose.
Step 4: Program and Rollout Strategy
The next piece of the puzzle is your program and rollout strategy. It’s easy to roll out an engineering insights platform and expect people to just log in and start using it, but that’s not enough. You need to think about how you'll introduce this new tool to the various stakeholders across different teams and business units.
The key here is to design a value loop within a smaller team or department first. Get a team to go through the full cycle of seeing the insights, taking action, and then quantifying the impact of that action. Once you've done this on a smaller scale, you can share success stories and roll it out more broadly across the organization. It’s not about whether people are logging into the platform—it’s about whether they’re driving meaningful change based on the insights.
Step 5: Choose Your Platform Wisely
And finally, we come to the platform itself. It’s the shiny object that many organizations focus on first, but as I’ve said before, it’s the last piece of the puzzle, not the first. Engineering insights platforms like Code Climate are powerful tools, but they can’t solve the problem of a poorly defined strategy.
I’ve seen organizations spend months evaluating these platforms, only to realize they didn't even know what they needed. One company in the telecom industry realized that no available platform suited their needs, so they chose to build their own. The key takeaway here is that your platform should align with your strategy—not the other way around. You should understand your purpose, people, and process before you even begin evaluating platforms.
Looking Ahead
To build a successful engineering insights strategy, you need to go beyond just installing a tool. An insights platform can only work if it’s supported by a clear purpose, the right people, a well-defined process, and a program that rolls it out effectively. The combination of these elements will ensure that your insights platform isn’t just a dashboard—it becomes a powerful driver of change and improvement in your organization.
Remember, a successful software engineering insights strategy isn’t just about the tool. It’s about building a culture of data-driven decision-making, fostering continuous improvement, and aligning all your teams toward achieving business outcomes. When you get that right, the value of engineering insights becomes clear.
Want to build a tailored engineering insights strategy for your enterprise organization? Get expert recommendations at our free insights strategy workshop. Register here.Register here.
Andrew Gassen has guided Fortune 500 companies and large government agencies through complex digital transformations. He specializes in embedding data-driven, experiment-led approaches within enterprise environments, helping organizations build a culture of continuous improvement and thrive in a rapidly evolving world.
Navigating the world of software engineering or developer productivity insights can feel like trying to solve a complex puzzle, especially for large-scale organizations. It's one of those areas where having a cohesive strategy can make all the difference between success and frustration. Over the years, as I’ve worked with enterprise-level organizations, I’ve seen countless instances where a lack of strategy caused initiatives to fail or fizzle out.
In my latest webinar, I breakdown the key components engineering leaders need to consider when building an insights strategy.
Why a Strategy Matters
At the heart of every successful software engineering team is a drive for three things:
- A culture of continuous improvement
- The ability to move from idea to impact quickly, frequently, and with confidence
- A software organization delivering meaningful value
These goals sound simple enough, but in reality, achieving them requires more than just wishing for better performance. It takes data, action, and, most importantly, a cultural shift. And here's the catch: those three things don't come together by accident.
In my experience, whenever a large-scale change fails, there's one common denominator: a lack of a cohesive strategy. Every time I’ve witnessed a failed attempt at implementing new technology or making a big shift, the missing piece was always that strategic foundation. Without a clear, aligned strategy, you're not just wasting resources—you’re creating frustration across the entire organization.
Sign up for a free, expert-led insights strategy workshop for your enterprise org.
Step 1: Define Your Purpose
The first step in any successful engineering insights strategy is defining why you're doing this in the first place. If you're rolling out developer productivity metrics or an insights platform, you need to make sure there’s alignment on the purpose across the board.
Too often, organizations dive into this journey without answering the crucial question: Why do we need this data? If you ask five different leaders in your organization, are you going to get five answers, or will they all point to the same objective? If you can’t answer this clearly, you risk chasing a vague, unhelpful path.
One way I recommend approaching this is through the "Five Whys" technique. Ask why you're doing this, and then keep asking "why" until you get to the core of the problem. For example, if your initial answer is, “We need engineering metrics,” ask why. The next answer might be, “Because we're missing deliverables.” Keep going until you identify the true purpose behind the initiative. Understanding that purpose helps avoid unnecessary distractions and lets you focus on solving the real issue.
Step 2: Understand Your People
Once the purpose is clear, the next step is to think about who will be involved in this journey. You have to consider the following:
- Who will be using the developer productivity tool/insights platform?
- Are these hands-on developers or executives looking for high-level insights?
- Who else in the organization might need access to the data, like finance or operations teams?
It’s also crucial to account for organizational changes. Reorgs are common in the enterprise world, and as your organization evolves, so too must your insights platform. If the people responsible for the platform’s maintenance change, who will ensure the data remains relevant to the new structure? Too often, teams stop using insights platforms because the data no longer reflects the current state of the organization. You need to have the right people in place to ensure continuous alignment and relevance.
Step 3: Define Your Process
The next key component is process—a step that many organizations overlook. It's easy to say, "We have the data now," but then what happens? What do you expect people to do with the data once it’s available? And how do you track if those actions are leading to improvement?
A common mistake I see is organizations focusing on metrics without a clear action plan. Instead of just looking at a metric like PR cycle times, the goal should be to first identify the problem you're trying to solve. If the problem is poor code quality, then improving the review cycle times might help, but only because it’s part of a larger process of improving quality, not just for the sake of improving the metric.
It’s also essential to approach this with an experimentation mindset. For example, start by identifying an area for improvement, make a hypothesis about how to improve it, then test it and use engineering insights data to see if your hypothesis is correct. Starting with a metric and trying to manipulate it is a quick way to lose sight of your larger purpose.
Step 4: Program and Rollout Strategy
The next piece of the puzzle is your program and rollout strategy. It’s easy to roll out an engineering insights platform and expect people to just log in and start using it, but that’s not enough. You need to think about how you'll introduce this new tool to the various stakeholders across different teams and business units.
The key here is to design a value loop within a smaller team or department first. Get a team to go through the full cycle of seeing the insights, taking action, and then quantifying the impact of that action. Once you've done this on a smaller scale, you can share success stories and roll it out more broadly across the organization. It’s not about whether people are logging into the platform—it’s about whether they’re driving meaningful change based on the insights.
Step 5: Choose Your Platform Wisely
And finally, we come to the platform itself. It’s the shiny object that many organizations focus on first, but as I’ve said before, it’s the last piece of the puzzle, not the first. Engineering insights platforms like Code Climate are powerful tools, but they can’t solve the problem of a poorly defined strategy.
I’ve seen organizations spend months evaluating these platforms, only to realize they didn't even know what they needed. One company in the telecom industry realized that no available platform suited their needs, so they chose to build their own. The key takeaway here is that your platform should align with your strategy—not the other way around. You should understand your purpose, people, and process before you even begin evaluating platforms.
Looking Ahead
To build a successful engineering insights strategy, you need to go beyond just installing a tool. An insights platform can only work if it’s supported by a clear purpose, the right people, a well-defined process, and a program that rolls it out effectively. The combination of these elements will ensure that your insights platform isn’t just a dashboard—it becomes a powerful driver of change and improvement in your organization.
Remember, a successful software engineering insights strategy isn’t just about the tool. It’s about building a culture of data-driven decision-making, fostering continuous improvement, and aligning all your teams toward achieving business outcomes. When you get that right, the value of engineering insights becomes clear.
Want to build a tailored engineering insights strategy for your enterprise organization? Get expert recommendations at our free insights strategy workshop. Register here.Register here.
Andrew Gassen has guided Fortune 500 companies and large government agencies through complex digital transformations. He specializes in embedding data-driven, experiment-led approaches within enterprise environments, helping organizations build a culture of continuous improvement and thrive in a rapidly evolving world.
All Articles

Velocity’s Incidents API gives the most accurate data on interruptions so you can investigate why outages happen and work to improve your teams’ response.
Failures and outages happen, even to the highest performing engineering teams. These unplanned interruptions might require developers to stop what they’re working on and pivot to problem-solving. If left unresolved, incidents can slow down delivery and become a financial burden on organizations.
The key to avoiding significant interruptions caused by incidents is to collect real-time data and analyze incident trends over time. Digging into your team’s incident-related data can help you understand whether your processes are effective in identifying, diagnosing, and solving issues.
Sourcing Accurate Data
Code Climate Velocity’s new Incidents API allows users to send incident data to Velocity to calculate the two incident related DORA metrics, Change Failure and Mean Time to Recovery, to help leaders get a better handle on interruptions and understand how long it takes for a team or an application to get to resolution. This is in addition to our Jira incident source, which allows customers to set a board and/or issue type for Velocity to consider as an “incident.”
Through Velocity’s Incidents API, users can push incident data from any tool they use, like PagerDuty and Opsgenie, into Velocity to calculate incident metrics. Customers can configure Incidents on the Applications settings page in Velocity.
Putting Metrics Into Context
In Velocity's Analytics, users can view DORA metrics alongside other key engineering metrics — such as Change Failure Rate alongside Unreviewed PRs — and assess how incidents impact the team. By placing this data into context, leaders can get a more precise picture of team health and processes.
Failure in production and delays in new features can mean dissatisfied end-users, so the key is to find a balance between shipping code frequently and maintaining high code quality.
Defining Your Goals
The top performing engineering teams can claim these benchmarks when it comes to incident-related metrics:
- Mean Time to Recovery (referred to as Time to Restore Service by the DORA group) of less than one day
- Change Failure Rate between 0-15%
By focusing on these specific metrics and establishing goals for each, engineering leaders can redefine priorities and make real progress towards enhanced delivery and higher overall performance, and understand if your team is striking the right balance between the speed of development and ensuring the delivery of high quality code.
Why Velocity Calculations Are the Most Actionable
By pulling in actual customer incident and deploy data from Jira and other tools via our Incidents API, Velocity’s solution accurately calculates the four DORA metrics. Many EMPs rely on proxy data rather than true incident data, which can be inaccurate and error-prone. Actual incident data will give you a true understanding of your teams’ incident response health.
Speak with a Velocity product specialist and learn how to get a clear picture of your engineering practices through Velocity's Analytics module.

The four DORA metrics — Deployment Frequency, Change Failure Rate, Mean Lead Time for Changes, and Mean Time to Recovery — were identified by the DevOps Research & Assessment group as the four metrics most strongly statistically correlated with success as a company.
Within those four metrics, the institute defined ranges that are correlated with meaningfully different company outcomes. They describe companies based on the outcomes they achieve as “High Performing,” “Medium Performing,” or “Low Performing.”
Moving between categories — for example, improving your Deployment Frequency from “between once per month and once every six months” to “between once per month and once every week” — leads to a statistically significant change in the success of a business. Moving within a bucket (for example, from once per month to twice per month) may be an improvement, but was not shown to drive the same level of shift in outcome.
DORA calculations are used as reference points across the industry, yet, there is no agreed-upon approach for DORA assessment, or accurately measuring DORA metrics. To set the original performance benchmarks, the DORA group surveyed more than 31,000 engineering professionals across the world over a span of six years, but responses were not based on standardized, precise data.
DORA metrics have been interpreted and calculated differently for different organizations, and even for teams within the same organization. This limits leaders’ ability to draw accurate conclusions about speed and stability across teams, organizations, and industries.
Because of this, there are subtle pitfalls to using automated DORA metrics as performance indicators.
Code Climate Velocity measures DORA metrics with real data, as opposed to proxy data, for the most useful understanding of your team health and CI/CD processes.
Code Climate’s Approach to DORA Assessment
As mentioned, there are many different approaches to automating the measurement of the DORA metrics in the market. In order to enable engineering executives to understand how their organization is performing across the four DORA metrics, we wanted to provide the most accurate and actionable measurement of outcomes in Velocity.
Our approach relies on analytical rigor rather than gut feel, so engineering leaders can understand where to investigate issues within their software practices, and demonstrate to executives the impact of engineering on business outcomes.
Using Real Incident Data, Not Proxy Data for DORA Calculations
Not every platform tracks Incident data the same way; many platforms use proxy data, resulting in lower-quality insights. Velocity instead uses actual Incident data, leading to more accurate assessment of your DevOps processes.
Velocity can ingest your team’s Incident data directly from Jira and Velocity’s Incident API. These integrations provide a way for every team to track metrics in the way that most accurately reflects how they work.
The Most Actionable Data
We made it possible for engineering leaders to surface DORA metrics in Velocity’s Analytics module, so that customers can see their DORA metrics alongside other Velocity metrics, and gain a more holistic overview of their SDLC practices.
Teams can evaluate their performance against industry benchmarks, as well as between other teams within the organization, to see which performance bucket they fall under: high, medium, or low. Based on that information, they can scale effective processes across the organization, or change processes and measure their impact.
Balancing Speed with Stability: How Velocity Metrics Contextualize DORA Metrics
If teams evaluated DORA metrics in isolation and discovered that their teams have a high Deployment Frequency or that they deploy multiple times a day, they may still be considered “high performing” — yet we know this does not tell the whole story of their software delivery. Velocity metrics and other DORA metrics within the Analytics module help contextualize the data, so that teams can understand how to balance speed with stability.
For example, the Velocity Metric PR size (number of lines of code added, changed, or removed) can be a useful counterpoint to Deployment Frequency. If you view these metrics together in Velocity’s Analytics module, you can see a correlation between the two — does a low Deployment Frequency often correlate with a larger PR size? If so, leaders now have data-backed reasoning to encourage developers to submit smaller units of work.
This doesn’t necessarily mean that your Deployment Frequency will be improved with smaller PR sizes, but it does provide a starting point to try and improve that metric. Leaders can note when this change was implemented and observe its impact over time. If Deployment Frequency is improved, leaders can scale these best practices across the organization. If not, it’s time to dig deeper.
DORA Metrics Definitions
Deployment Frequency – A measurement of how frequently the engineering team is deploying code to production.
Deployment Frequency helps engineering leadership benchmark how often the team is shipping software to customers, and therefore how quickly they are able to get work out and learn from those customers. The best teams deploy multiple times per day, meaning they deploy on-demand, as code is ready to be shipped. The higher your Deployment Frequency, the more often code is going out to end users. Overall, the goal is to ship small and often as possible.
Mean Lead Time for Changes – A measurement of how long, on average, it takes to go from code committed to code successfully running in production.
Mean Lead Time for Changes helps engineering leadership understand the efficiency of their development process once coding has begun and serves as a way to understand how quickly work, once prioritized, is delivered to customers. The best teams are able to go from code committed to code running in production in less than one day, on average.
Change Failure Rate – The percentage of deployments causing a failure in production. If one or more incidents occur after deployment, that is considered a “failed” deployment.
Change Failure Rate helps engineering leaders understand the stability of the code that is being developed and shipped to customers, and can improve developers’ confidence in deployment. Every failure in production takes away time from developing new features and ultimately has negative impacts on customers.
It’s important, however, that leaders view Change Failure Rate alongside Deployment Frequency and Mean Lead Time for Changes. The less frequently you deploy, the lower (and better) your Change Failure Rate will likely be. Thus, viewing these metrics in conjunction with one another allows you to assess holistically both throughput and stability. Both are important, and high-performing organizations are able to strike a balance of delivering high quality code quickly and frequently.
Mean Time to Recovery – A measurement of how long, on average, it takes to recover from a failure in production.
Even with extensive code review and testing, failures are inevitable. Mean Time to Recovery helps engineering leaders understand how quickly the team is able to recover from failures in production when they do happen. Ensuring that your team has the right processes in place to detect, diagnose, and resolve issues is critical to minimizing downtime for customers.
Additionally, longer recovery times detract from time spent on features, and account for a longer period of time during which your customers are either unable to interact with your product, or are having a sub-optimal experience.
Doing DORA Better
Though there is no industry standard for calculating and optimizing your DORA metrics, Velocity’s use of customers’ actual Incident data, and ability to contextualize that data in our Analytics module, can help teams better understand the strengths and weaknesses of their DevOps process and work towards excelling as an engineering organization.
Interested in learning which performance benchmark your team falls under, and how you can scale or alter your engineering processes? Reach out to a Velocity specialist.
For organizations looking to fine-tune their DevOps practices or understand where they should improve to excel, DORA metrics are an essential starting point. Code Climate Velocity now surfaces the four DORA metrics in our Analytics module, allowing engineering leaders to share the state of their DevOps outcomes with the rest of the organization, identify areas of improvement, establish goals, and observe progress towards those goals.
When used thoughtfully, DORA metrics can help you understand and improve your engineering team’s speed and stability. Here’s how Code Climate Velocity delivers the most accurate and reliable measurements for each metric, and how to maximize their impact in your organization.
What is DORA?
The DORA metrics were defined by the DevOps Research & Assessment group, formed by industry leaders Nicole Forsgren, Jez Humble, and Gene Kim. These metrics, along with their performance benchmarks, were largely popularized by the book Accelerate, co-authored by the DORA group. Not only do they represent the most critical areas in the DevOps process, they’re also the metrics most statistically correlated with a company’s organizational performance.
What are the four DORA metrics?
The four DORA metrics fall under two categories:
Stability Metrics (Measuring the impact of incidents in production):
- Change Failure Rate: The percentage of deployments causing a failure in production.
- Mean Time to Recovery: How long, on average, it takes to recover from a failure in production.
Speed Metrics (Measuring the efficiency of your engineering processes):
- Deploy Frequency: How frequently the engineering team is deploying code to production.
- Mean Lead Time for Changes: The time it takes to go from code committed to code successfully running in production.
How Velocity Does DORA Differently
While many leaders rely on homegrown calculations to surface their DORA metrics, a tool like Velocity allows teams to get even more out of DORA. Not only do we help teams standardize measurement and ensure accuracy, we also make it possible for leaders to go a level deeper — digging into the aspects of the SDLC that influence DORA metrics, so they can identify specific opportunities for high-impact changes.
Our approach to DORA metrics is unique because:
We use the most accurate data
Velocity uses our customers’ real incident and deployment data, through Velocity’s curl command, to ingest data from JIRA and our Incidents API, for accurate calculations of each metric.
Many platforms rely on proxy data as they lack integration with incident tools. Yet this approach yields lower quality, error-prone insights, which can lead to inaccurate assessments of your DevOps processes.
You can view trends over time
The Velocity Analytics module gives users the ability to see DORA Metrics trend over time, allowing you to select specific timeframes, including up to a year of historical data.
You can use annotations to add context and measure the impact of organizational changes on your processes
Additionally, users can use annotations to keep a record of changes implemented, allowing you to understand and report on their impact. For example, if your team recently scaled, you can note that as an event on a specific day in the Analytics module, and observe how that change impacted your processes over time. Reviewing DORA metrics after growing your team can give you insight into the impact of hiring new engineers or the efficacy of your onboarding processes.
You can surface DORA metrics alongside Velocity metrics
The platform also allows customers to surface these four metrics in tandem with non-DORA metrics.
Why is this important? DORA metrics measure outcomes — they help you determine where to make improvements, and where to investigate further. With these metrics surfaced in Analytics, it’s now easier for engineering leaders to investigate. Users can see how other key SDLC metrics correlate with DORA metrics, and pinpoint specific areas for improvement.
For example, viewing metrics in tandem may reveal that when you have a high number of unreviewed PRs, your Change Failure Rate is also higher than usual. With that information, you have a starting point for improving CFR, and can put in place processes for preventing unreviewed PRs from making it to production.
Engineering leaders can coach teams to improve these metrics, like reinforcing good code hygiene and shoring up CI/CD best practices. Conversely, if these metrics comparisons indicate that things are going well for a specific team, you can dig in to figure out where they’re excelling and scale those best practices.
Metrics offer concrete discussion points
DORA metrics are one tool engineering leaders can use to gain a high level understanding of their team’s speed and stability, and hone in on areas of their software delivery process that need improvement. With these insights, leaders can have a significant impact on the success of the business.
Sharing these discoveries with your engineering team is an excellent way to set the stage for retrospectives, stand ups, and 1-on-1s. With a deeper understanding of your processes, as well as areas in need of improvement or areas where your team excels, you can inform coaching conversations, re-allocate time and resources, or extrapolate effective practices and apply them across teams.
Leaders can also use these insights in presentations or conversations with stakeholders in order to advocate for their team, justify resource requests, and demonstrate the impact of engineering decisions on the business.
Ready to start using DORA metrics to gain actionable insights to improve your DevOps processes? Speak with a Velocity product specialist.

Performance reviews in engineering are often tied to compensation. End-of-year and mid-point check-ins can be great opportunities to discuss individual goals and foster professional growth, but too often they are used as ways to assess whether direct reports are eligible for raises or promotions based on their ability to hit key metrics.
For engineering leaders, a more valuable way to use performance reviews is as a structured opportunity to have a conversation about a developer’s progress and work with them to find ways to grow in their careers through new challenges. This benefits both developers and organizations as a whole — developers are able to advance their skills, and companies are able to retain top engineers who are continually evolving. Even senior engineers look for opportunities for growth, and are more likely to stay at an organization that supports and challenges them.
The key to achieving this is by focusing on competency, rather than productivity measurements, when it comes to evaluating compensation and performance. But how do we define competency in engineering?
What is competency in engineering?
Where productivity might measure things like lines of code, competency looks at how an engineer approaches a problem, collaborates with their team to help move things forward, and takes on new challenges.
Questions to consider when evaluating a developer’s competency might include:
- How thoughtful are their comments in a Code Review?
- Do they make informed decisions based on data?
- How do they navigate failure?
- How do they anticipate or respond to change?
Engineering leader Dustin Diaz created a reusable template for evaluating competency in engineering, which he links to in this post. The template borrows from concepts in The Manager’s Path, by author and engineering leader Camille Fournier, and is modeled after the SPACE framework, and outlines levels of competency for engineers at different levels of seniority. The matrix can be helpful for leaders looking to hone in on areas like collaboration, performance, and efficiency/quality. It includes markers of competency for different tiers of engineers, including anticipating broad technical change, end-to-end responsibility on projects, and taking initiative to solve issues.
Performance review essentials
We’ve addressed how performance reviews during a difficult year can be especially challenging. Yet no matter the circumstances, there are principles of a successful performance review that will always be relevant.
Reviews should always include:
- Compassion and empathy — With the understanding that employees could be under a lot of stress, a performance review shouldn’t add to any pressure they’re experiencing.
- Specific units of work — In order to provide useful feedback, bring examples of work to discuss during a review. By focusing on the work itself, the review remains objective, and can open the door for a coaching conversation.
- Objective data to check biases — There are many common performance review biases, as well as ways to correct for them by contextualizing data, checking assumptions, and taking circumstance into account. It’s important not to let unconscious biases inform your analysis of a developer’s work.
Aligning developer and company incentives
When performance reviews are based on hitting productivity benchmarks that are implicitly linked to compensation, developers might be less focused on ambitious goals and more on checking boxes that they believe will earn them a raise; rather than challenging themselves, they will likely be incentivized to play it safe with easy-to-achieve goals.
Encouraging a focus on competency invites engineers to make decisions that have more potential to move the needle in an organization, and to take risks, even if they could lead to failure.
During our webinar on data-driven leadership, Sophie Roberts, Director of Engineering at Shopify shared why rewarding productivity over growth could have adverse effects: “You end up in a situation where people want to get off projects that they don’t really think they have executive buy-in, or try and game the work they’re doing,” Roberts said. “I’ve canceled people’s projects and promoted them the next month, because how they were approaching the work was what we expect from a competency level of people who are more senior…They may try to get work that is a more sure shot of moving a metric because they think that’s what’s going to result in their promotion or their career progression.”
An emphasis on competency can improve the following:
- Risk-taking. If engineering leaders foster psychological safety within teams, developers are more likely to take risks without the fear of being penalized for failure. If metrics are not tied to compensation, developers will likely be more ambitious with their goal-setting.
- Flexibility and adaptability. Failure and change are both inevitable in engineering organizations. Instead of trying to avoid mistakes, emphasize the importance of learning and of implementing thoughtful solutions that can have a lasting impact.
- Upskilling and developer retention. Investing in the professional development of an engineer is a vote of confidence in their abilities. Engineering leaders can boost retention through upskilling or by enabling individuals to grow into more senior positions.
Using metrics to assess competency
Data-driven insights can provide engineering leaders with objective ways to evaluate developer competency, without tying metrics directly to compensation. They can help you assess a developer’s progress, spot opportunities for improvement, and even combat common performance review biases.
One effective way to use metrics in performance reviews is to quantify impact. In our webinar on data-driven performance reviews, Smruti Patel, now VP of Engineering at Apollo, shared how data helps IC’s on her team recognize their impact on the business during self-evaluations.
“It comes down to finding the right engineering data that best articulates impact to the team and business goals. So if you think about it, you can use a very irrefutable factor, say, ‘I shipped X, which reduced the end-to-end API latency from 4 or 5 seconds to 2.5 seconds. And this is how it impacted the business,” she said.
In the same discussion, Katie Wilde, now Senior Director of Engineering at Snyk Cloud, shared how metrics explained a discrepancy between one engineer’s self-evaluation and her peer reviews. This engineer gave herself a strong rating, but her peers did not rate her as highly. When Wilde dug into the data, she found that it was not a case of the individual being overconfident, but a case of hidden bias — the engineer’s PRs were being scrutinized more heavily than those of her male counterparts.
In both instances, data helped provide a more complete picture of a developer’s abilities and impact, without being directly tied to performance benchmarks or compensation.
Defining success in performance reviews
Overall, metrics are able to provide concrete data to counteract assumptions, both on the part of the reviewer and the engineers themselves. By taking a holistic approach to performance reviews and contextualizing qualitative and quantitative data, including having one-on-one conversations with developers, leaders can make more informed decisions about promotions and compensation for their teams.
Keep in mind that performance reviews should be opportunities to encourage growth and career development for engineers, while gaining feedback that can inform engineering practices.
Most importantly, rewarding competency is an effective way to align developer goals with business goals. This way, leaders are invested in the growth of valuable members of their team who make a significant impact, while engineers are recognized for their contributions and able to grow in their careers.
Beyond Finance is a tech-forward company that helps individuals find freedom from debt. Software is the foundation of its business model, and the culture is inherently iterative, always seeking improvement. Leadership values its people and goes the extra mile to create an environment where employees can flourish. The end goal is achieving the best outcomes for clients and the business as a whole, and improving engineering team health.
The company’s innovative approach has fueled massive growth. Beyond Finance has earned the trust of over 200,000 clients, helping to resolve more than $1 billion in debt along the way. As Beyond Finance scales to support a rapidly growing user base and builds new products to maintain its position as an industry leader, its engineering team, which doubled over the past three years, continues bringing in new talent at a rapid pace.
Sergio Rabiela, vice president of technology, said that visibility into the health of the engineering organization is essential to support a growing team. Code Climate’s Velocity helps with onboarding new engineers.
“We set goals as a team, put them in Velocity, and track our progress. It’s tough to do that without a Software Engineering Intelligence platform,” Rabiela said.
Eliminating the Manual Drag of Metrics
The Beyond Finance engineering culture has always been collaborative and reflective, with a goal of continuous improvement. But when Rabiela joined in 2019, it required a lot of effort to glean insight into the development pipeline, bottlenecks, and project status. At that time, Rabiela had to log into development tools to look at individual pull requests and code reviews and manually collect data to get a complete picture of what the team was accomplishing.
Rabiela had experience with Code Climate’s Velocity in a previous role and knew the platform could deliver the insight he needed without the manual effort. Fortunately, it wasn’t long before they had the technology in place and leadership at Beyond Finance was able to gain immediate value.
Not only did Beyond Finance experience substantial time savings during reporting, but the tool revealed some interesting gaps they didn’t expect. They had the context necessary to correlate important metrics like PR throughput with the activities that impacted results. For example, the extra time teams spent troubleshooting issues in production affected how often they could push code, and meeting cycles extended code review times. They were even able to adjust their weekly schedule to create an environment that allowed their developers more time for the activities that mattered most — a change that the team appreciated.
“Velocity gives us signals that something is off in our environment or the way things are working so that we can address it proactively before it becomes a problem that impacts the organization. It is especially helpful at surfacing things that are hard to see otherwise,” Rabiela said.
With this visibility, Beyond Finance increased PR throughput by more than 700% in the first year and continued to improve throughout 2021. In 2022, they maintained high throughput rates despite nearly doubling their contributor count — a change that can often slow teams down.
Fostering Engineering Team Health and Success
Velocity is essential in maintaining healthy workflows, achieving goals, and identifying opportunities for skills development. Rabiela said they frequently use the Developer360 team view to understand the various dimensions of their development activities. This insight guides managers to adjust processes if a project seems to be going off course or to make changes for future sprints. Additionally, visibility into trends in throughput and review times serve as a consistent baseline for measuring progress toward goals.
It’s also valuable for developers, who get alerts when PRs have gone more than 24 hours without being addressed. And managers use individual developer metrics to help new engineers grow and build the right habits, like pushing code to GitHub at frequent intervals.
“Many of these metrics would be nearly impossible to find without Velocity, because tools like GitHub are really just about the code you write, not necessarily the reviews or the comments. You lose a lot of context and end up with missing pieces. The daily activities of our engineers encompass a lot more than just writing code,” Rabiela said.
Ultimately, Code Climate helps the engineering team at Beyond Finance uphold the company’s commitment to continuous improvement so it can ensure its products and processes are the best they can possibly be.
Want to learn how to improve engineering team health in your organization with data-driven visibility? Speak with a Velocity Product Specialist.

For engineering teams, disruption to the business can have a significant impact on the ability to deliver and meet goals. These disruptions are often a result of reprioritization and budget changes on an organizational level, and are amplified during times of transition or economic instability.
In a survey led by CTO Craft in partnership with Code Climate, engineering leaders were asked to name the main cause for disruption to their businesses in 2022, and to offer their predictions for productivity challenges in 2023. The survey also included questions about engineering leadership in particular, including how leaders intend to keep engineering teams motivated in the coming year, and how their leadership has been impacted by disruptive times.
In total there were 114 respondents, comprised mainly of CTOs, followed by Engineering Managers, then heads of technology, development, and engineering.
Read on for the key takeaways, and see the full survey results on CTO Craft.
Hiring challenges ranked as the #1 cause for disruption
Attracting and retaining talented software engineers is top of mind for many engineering leaders, and with developers in short supply but high demand, this remains a challenge for organizations. Over half of survey respondents said hiring challenges were the leading cause of business disruption in 2022.
Many survey respondents said that recruiting top talent will continue to be a challenge in 2023.
Other common responses were reprioritization of business objectives, followed by a drop in revenue. Over half of respondents (54%), predict that issues with budgets will be a threat to productivity in 2023.
Leaders aim to assign more engaging work in 2023
Nearly half (forty-five percent) of respondents said that they plan to motivate engineers in 2023 with more engaging work, followed by twenty percent of respondents who said they would focus on developers’ career paths. The remaining eight percent said they will use compensation as a motivator next year.
Teams are still getting work done
Despite these challenges, 70% of survey participants said that they almost always deliver on business commitments.
In terms of identifying root causes of going off track and not delivering on commitments, 60% of respondents said they can assess the problem with relative ease, while 25% said it’s difficult for them to do so.
Learn more about CTO Craft on their website.
At Code Climate, we value collaboration and growth, and strive for greatness within our product and workplace. For us, this means fostering a supportive, challenging, people-first culture.
Thanks to an emphasis on these values, we’ve earned spots on three of Built In’s 2023 Best Places to Work awards lists, including New York City Best Startups to Work For, New York City Best Places to Work, and U.S. Best Startups to Work For.
This annual awards program recognizes tech companies across the United States, including startups and enterprises. Awards are based on compensation, benefits, and highly searched-for offerings on the Built In platform, like DEI initiatives, flexible work opportunities, and support for professional development.
We work hard to make Code Climate a great place to work, and we’re honored to be on Built In’s lists for the second year in a row. Here’s what employees have to say about why they love working at Code Climate.
Support and collaboration are key
The culture is collaborative, and everyone is encouraged to do their best work. There is a strong focus on enablement and supporting everyone to run with all of their ideas — even if they have never been done before. — Addison LeBeau, Customer Marketing Manager
Our organization is very flat so I feel comfortable reaching out to anyone with a question or concern, from our salespeople to our CEO. — Mike Koeneke, Senior Product Manager
We challenge each other and ourselves to grow
I joined Code Climate because I was seeking a challenging yet fun environment that would push me to grow my technical acumen and operating knowledge. It hasn’t disappointed, and I love that the work environment encourages autonomy, experimentation, and professional development. — Glenn Rothwell, Director of Sales Development
In project work, I feel like I am empowered to take on exciting challenges and learn new things. — Sam Dallas, Senior Software Engineer
We’re building something great together
What I enjoy most about Code Climate is getting to work with an amazing group of talented and passionate coworkers to build innovative products and solve complex problems for our customers. We have a unique opportunity to make an impact across technology departments big and small, helping them move faster and build better products. — Madison Unell, Senior Product Manager
I love our product; as a software engineer it’s a dream being able to build tools to empower other engineers and organizations. Such a privilege. — Javier Murillo, Software Engineer
The people make the place
Each employee truly enjoys what they do and are always willing to help out when you need it. On our in-person days I walk into the office and am surrounded by a great group of people! —Amanda McLaughlin, Employee Experience Generalist
Everyone at Code Climate is delightful. I feel supported in my career and challenged through my work. Our customers are also fantastic! — Jilly Chen, Manager, Solutions Consulting
Code Climate is like my second family. I’ve never felt more comfortable to be myself andto really be able to excel at my work. — Kevin Blackwell, Sales Engineer
Learn more about working at Code Climate and view our open roles.
Download the Buyer’s Checklist here.
An engineering management platform, or EMP, is a comprehensive tool that offers data-driven insight into your engineering team. The platform allows engineering leaders to demonstrate the impact of their investments, advocate for more resources, understand engineering team health, and measure team progress.
With this deep level of visibility, companies can enhance their software engineering practices and gain a competitive edge in the marketplace. Features across different EMPs can vary, and it can be challenging to evaluate which platform works best for your organization. We’ve put together a checklist that can help you make your choice, with selection criteria categorized by:
- Process and team health
- Aligning engineering initiatives to business value
- Consistent, high-quality delivery
- Integrations into your existing systems
- Scalability and customization
- Security
To give you a better understanding of what to look for in an EMP, download a free copy of our Buyer’s Checklist, which breaks down features by level of importance, from nice to have, to should have, to essential.
Sign up for our newsletter to be the first to know when our EMP Buyer’s Guide is available.
G2, the world’s largest marketplace for software, just released their 2023 list of best software products.
Code Climate is proud to announce Velocity’s ranking as #1 in Software Development Analytics Tools in G2’s Mid-Market Grid (reviews from mid-size companies of 51-1,000 employees), and #2 for G2’s Grid® Report for Software Development Analytics Tools, earning us two Leader badges. Velocity has also ranked top-3 in five different reports for Winter 2023.
Our customers have recognized us as leaders in best-in-class software products and experiences. Our ranking is based on reviews from actual Code Climate customers who’ve used Velocity to successfully address pain points of their engineering teams.
Here’s what our customers are saying about Velocity:
“Velocity has enabled us to measure the effectiveness of process changes, as well as identify the operational bottlenecks that would otherwise have gone unnoticed. It helps us create key results by which we can measure the effectiveness of changes we make in our development cycles. We have identified methods of reducing our overall Cycle Time thanks to these insights.” — Ross Finkelstein, Director, Delivery at Wattpad
“The main problem that Code Climate is solving is how we can create a culture of continuous improvement within the organization. Velocity is helping us to streamline our code delivery, providing us with actionable metrics that our managerial team can use to set SMART goals for the engineering teams. We also like the customer success team that has been helping us. They have been very collaborative and supportive.” — Euclides F., Head of DevSecOps (LATAM)
For more testimonials or to leave your own review of Velocity, visit our G2 page.