Resources & Insights
Featured Article
Navigating the world of software engineering or developer productivity insights can feel like trying to solve a complex puzzle, especially for large-scale organizations. It's one of those areas where having a cohesive strategy can make all the difference between success and frustration. Over the years, as I’ve worked with enterprise-level organizations, I’ve seen countless instances where a lack of strategy caused initiatives to fail or fizzle out.
In my latest webinar, I breakdown the key components engineering leaders need to consider when building an insights strategy.
Why a Strategy Matters
At the heart of every successful software engineering team is a drive for three things:
- A culture of continuous improvement
- The ability to move from idea to impact quickly, frequently, and with confidence
- A software organization delivering meaningful value
These goals sound simple enough, but in reality, achieving them requires more than just wishing for better performance. It takes data, action, and, most importantly, a cultural shift. And here's the catch: those three things don't come together by accident.
In my experience, whenever a large-scale change fails, there's one common denominator: a lack of a cohesive strategy. Every time I’ve witnessed a failed attempt at implementing new technology or making a big shift, the missing piece was always that strategic foundation. Without a clear, aligned strategy, you're not just wasting resources—you’re creating frustration across the entire organization.
Sign up for a free, expert-led insights strategy workshop for your enterprise org.
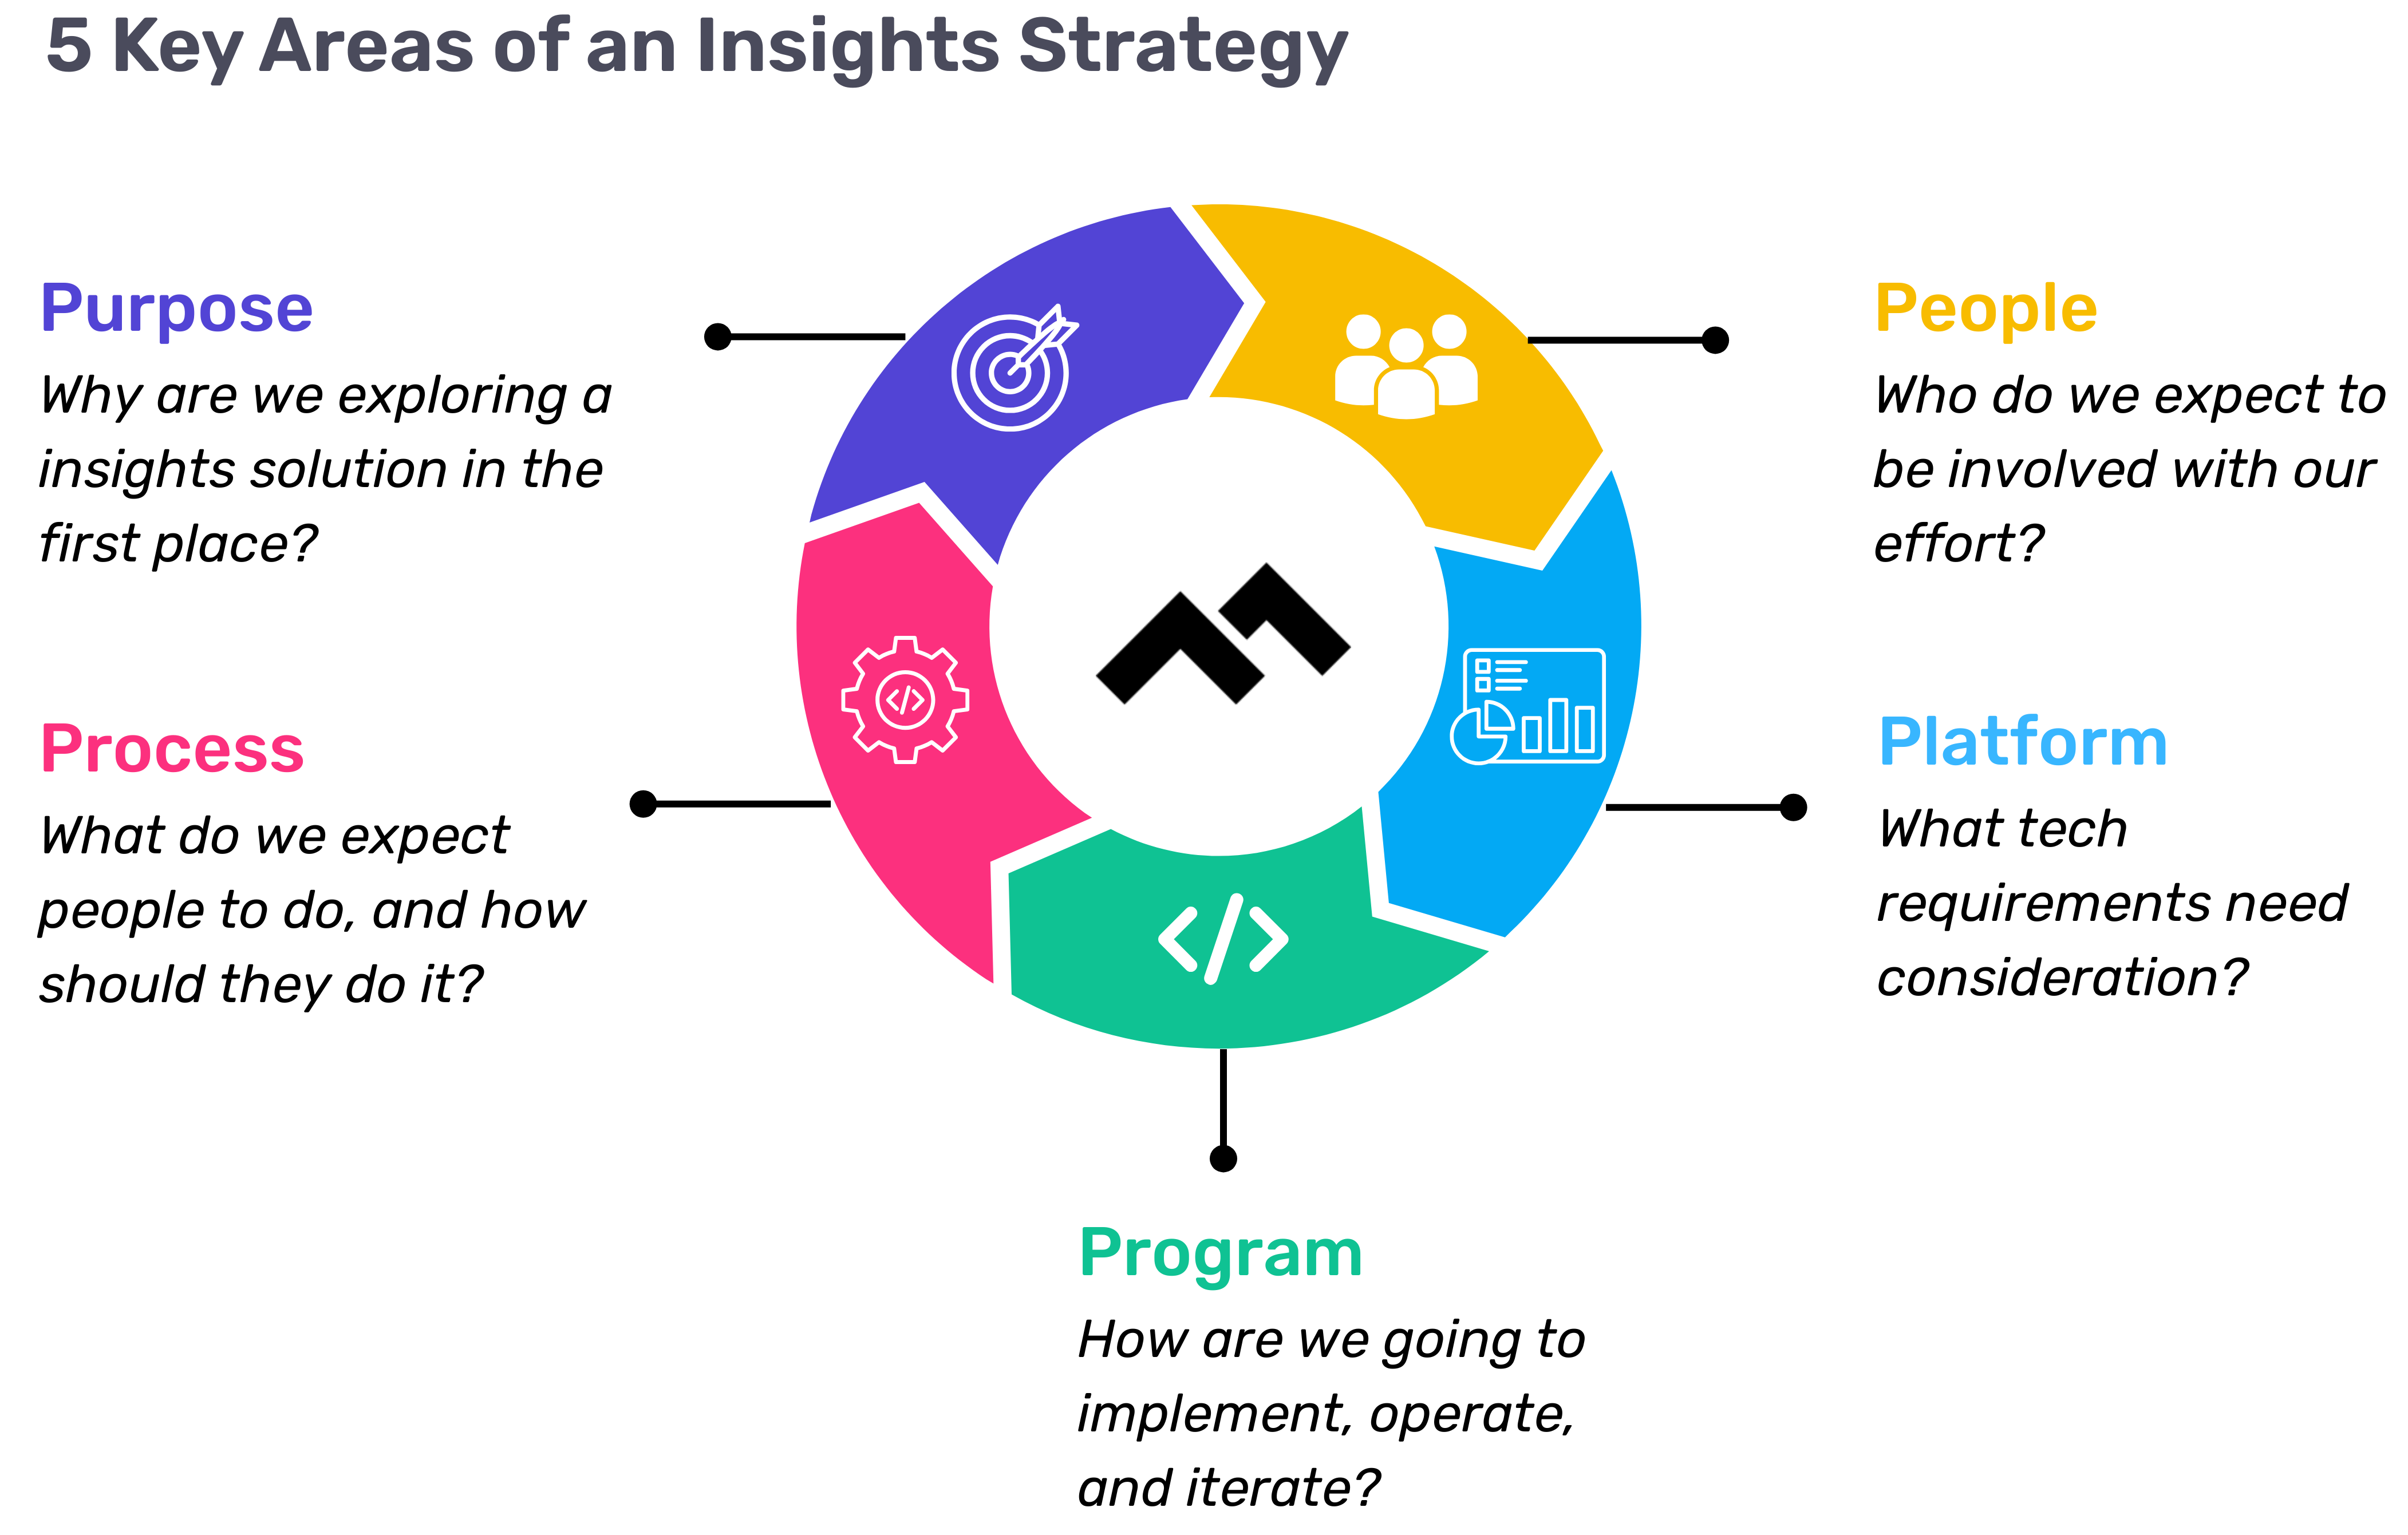
Step 1: Define Your Purpose
The first step in any successful engineering insights strategy is defining why you're doing this in the first place. If you're rolling out developer productivity metrics or an insights platform, you need to make sure there’s alignment on the purpose across the board.
Too often, organizations dive into this journey without answering the crucial question: Why do we need this data? If you ask five different leaders in your organization, are you going to get five answers, or will they all point to the same objective? If you can’t answer this clearly, you risk chasing a vague, unhelpful path.
One way I recommend approaching this is through the "Five Whys" technique. Ask why you're doing this, and then keep asking "why" until you get to the core of the problem. For example, if your initial answer is, “We need engineering metrics,” ask why. The next answer might be, “Because we're missing deliverables.” Keep going until you identify the true purpose behind the initiative. Understanding that purpose helps avoid unnecessary distractions and lets you focus on solving the real issue.
Step 2: Understand Your People
Once the purpose is clear, the next step is to think about who will be involved in this journey. You have to consider the following:
- Who will be using the developer productivity tool/insights platform?
- Are these hands-on developers or executives looking for high-level insights?
- Who else in the organization might need access to the data, like finance or operations teams?
It’s also crucial to account for organizational changes. Reorgs are common in the enterprise world, and as your organization evolves, so too must your insights platform. If the people responsible for the platform’s maintenance change, who will ensure the data remains relevant to the new structure? Too often, teams stop using insights platforms because the data no longer reflects the current state of the organization. You need to have the right people in place to ensure continuous alignment and relevance.
Step 3: Define Your Process
The next key component is process—a step that many organizations overlook. It's easy to say, "We have the data now," but then what happens? What do you expect people to do with the data once it’s available? And how do you track if those actions are leading to improvement?
A common mistake I see is organizations focusing on metrics without a clear action plan. Instead of just looking at a metric like PR cycle times, the goal should be to first identify the problem you're trying to solve. If the problem is poor code quality, then improving the review cycle times might help, but only because it’s part of a larger process of improving quality, not just for the sake of improving the metric.
It’s also essential to approach this with an experimentation mindset. For example, start by identifying an area for improvement, make a hypothesis about how to improve it, then test it and use engineering insights data to see if your hypothesis is correct. Starting with a metric and trying to manipulate it is a quick way to lose sight of your larger purpose.
Step 4: Program and Rollout Strategy
The next piece of the puzzle is your program and rollout strategy. It’s easy to roll out an engineering insights platform and expect people to just log in and start using it, but that’s not enough. You need to think about how you'll introduce this new tool to the various stakeholders across different teams and business units.
The key here is to design a value loop within a smaller team or department first. Get a team to go through the full cycle of seeing the insights, taking action, and then quantifying the impact of that action. Once you've done this on a smaller scale, you can share success stories and roll it out more broadly across the organization. It’s not about whether people are logging into the platform—it’s about whether they’re driving meaningful change based on the insights.
Step 5: Choose Your Platform Wisely
And finally, we come to the platform itself. It’s the shiny object that many organizations focus on first, but as I’ve said before, it’s the last piece of the puzzle, not the first. Engineering insights platforms like Code Climate are powerful tools, but they can’t solve the problem of a poorly defined strategy.
I’ve seen organizations spend months evaluating these platforms, only to realize they didn't even know what they needed. One company in the telecom industry realized that no available platform suited their needs, so they chose to build their own. The key takeaway here is that your platform should align with your strategy—not the other way around. You should understand your purpose, people, and process before you even begin evaluating platforms.
Looking Ahead
To build a successful engineering insights strategy, you need to go beyond just installing a tool. An insights platform can only work if it’s supported by a clear purpose, the right people, a well-defined process, and a program that rolls it out effectively. The combination of these elements will ensure that your insights platform isn’t just a dashboard—it becomes a powerful driver of change and improvement in your organization.
Remember, a successful software engineering insights strategy isn’t just about the tool. It’s about building a culture of data-driven decision-making, fostering continuous improvement, and aligning all your teams toward achieving business outcomes. When you get that right, the value of engineering insights becomes clear.
Want to build a tailored engineering insights strategy for your enterprise organization? Get expert recommendations at our free insights strategy workshop. Register here.Register here.
Andrew Gassen has guided Fortune 500 companies and large government agencies through complex digital transformations. He specializes in embedding data-driven, experiment-led approaches within enterprise environments, helping organizations build a culture of continuous improvement and thrive in a rapidly evolving world.
Navigating the world of software engineering or developer productivity insights can feel like trying to solve a complex puzzle, especially for large-scale organizations. It's one of those areas where having a cohesive strategy can make all the difference between success and frustration. Over the years, as I’ve worked with enterprise-level organizations, I’ve seen countless instances where a lack of strategy caused initiatives to fail or fizzle out.
In my latest webinar, I breakdown the key components engineering leaders need to consider when building an insights strategy.
Why a Strategy Matters
At the heart of every successful software engineering team is a drive for three things:
- A culture of continuous improvement
- The ability to move from idea to impact quickly, frequently, and with confidence
- A software organization delivering meaningful value
These goals sound simple enough, but in reality, achieving them requires more than just wishing for better performance. It takes data, action, and, most importantly, a cultural shift. And here's the catch: those three things don't come together by accident.
In my experience, whenever a large-scale change fails, there's one common denominator: a lack of a cohesive strategy. Every time I’ve witnessed a failed attempt at implementing new technology or making a big shift, the missing piece was always that strategic foundation. Without a clear, aligned strategy, you're not just wasting resources—you’re creating frustration across the entire organization.
Sign up for a free, expert-led insights strategy workshop for your enterprise org.
Step 1: Define Your Purpose
The first step in any successful engineering insights strategy is defining why you're doing this in the first place. If you're rolling out developer productivity metrics or an insights platform, you need to make sure there’s alignment on the purpose across the board.
Too often, organizations dive into this journey without answering the crucial question: Why do we need this data? If you ask five different leaders in your organization, are you going to get five answers, or will they all point to the same objective? If you can’t answer this clearly, you risk chasing a vague, unhelpful path.
One way I recommend approaching this is through the "Five Whys" technique. Ask why you're doing this, and then keep asking "why" until you get to the core of the problem. For example, if your initial answer is, “We need engineering metrics,” ask why. The next answer might be, “Because we're missing deliverables.” Keep going until you identify the true purpose behind the initiative. Understanding that purpose helps avoid unnecessary distractions and lets you focus on solving the real issue.
Step 2: Understand Your People
Once the purpose is clear, the next step is to think about who will be involved in this journey. You have to consider the following:
- Who will be using the developer productivity tool/insights platform?
- Are these hands-on developers or executives looking for high-level insights?
- Who else in the organization might need access to the data, like finance or operations teams?
It’s also crucial to account for organizational changes. Reorgs are common in the enterprise world, and as your organization evolves, so too must your insights platform. If the people responsible for the platform’s maintenance change, who will ensure the data remains relevant to the new structure? Too often, teams stop using insights platforms because the data no longer reflects the current state of the organization. You need to have the right people in place to ensure continuous alignment and relevance.
Step 3: Define Your Process
The next key component is process—a step that many organizations overlook. It's easy to say, "We have the data now," but then what happens? What do you expect people to do with the data once it’s available? And how do you track if those actions are leading to improvement?
A common mistake I see is organizations focusing on metrics without a clear action plan. Instead of just looking at a metric like PR cycle times, the goal should be to first identify the problem you're trying to solve. If the problem is poor code quality, then improving the review cycle times might help, but only because it’s part of a larger process of improving quality, not just for the sake of improving the metric.
It’s also essential to approach this with an experimentation mindset. For example, start by identifying an area for improvement, make a hypothesis about how to improve it, then test it and use engineering insights data to see if your hypothesis is correct. Starting with a metric and trying to manipulate it is a quick way to lose sight of your larger purpose.
Step 4: Program and Rollout Strategy
The next piece of the puzzle is your program and rollout strategy. It’s easy to roll out an engineering insights platform and expect people to just log in and start using it, but that’s not enough. You need to think about how you'll introduce this new tool to the various stakeholders across different teams and business units.
The key here is to design a value loop within a smaller team or department first. Get a team to go through the full cycle of seeing the insights, taking action, and then quantifying the impact of that action. Once you've done this on a smaller scale, you can share success stories and roll it out more broadly across the organization. It’s not about whether people are logging into the platform—it’s about whether they’re driving meaningful change based on the insights.
Step 5: Choose Your Platform Wisely
And finally, we come to the platform itself. It’s the shiny object that many organizations focus on first, but as I’ve said before, it’s the last piece of the puzzle, not the first. Engineering insights platforms like Code Climate are powerful tools, but they can’t solve the problem of a poorly defined strategy.
I’ve seen organizations spend months evaluating these platforms, only to realize they didn't even know what they needed. One company in the telecom industry realized that no available platform suited their needs, so they chose to build their own. The key takeaway here is that your platform should align with your strategy—not the other way around. You should understand your purpose, people, and process before you even begin evaluating platforms.
Looking Ahead
To build a successful engineering insights strategy, you need to go beyond just installing a tool. An insights platform can only work if it’s supported by a clear purpose, the right people, a well-defined process, and a program that rolls it out effectively. The combination of these elements will ensure that your insights platform isn’t just a dashboard—it becomes a powerful driver of change and improvement in your organization.
Remember, a successful software engineering insights strategy isn’t just about the tool. It’s about building a culture of data-driven decision-making, fostering continuous improvement, and aligning all your teams toward achieving business outcomes. When you get that right, the value of engineering insights becomes clear.
Want to build a tailored engineering insights strategy for your enterprise organization? Get expert recommendations at our free insights strategy workshop. Register here.Register here.
Andrew Gassen has guided Fortune 500 companies and large government agencies through complex digital transformations. He specializes in embedding data-driven, experiment-led approaches within enterprise environments, helping organizations build a culture of continuous improvement and thrive in a rapidly evolving world.
All Articles

EverQuote, Inc. operates a leading online insurance marketplace, connecting consumers with insurance providers. The company’s mission is to empower insurance shoppers to better protect life’s most important assets—their family, property, and future. EverQuote uses data and technology to make insurance simpler, more affordable, and personalized, ultimately reducing cost and risk. Based in Cambridge, MA, EverQuote is one of the fastest growing companies in the Boston area.
As the company scaled, they had a pressing need to analyze engineering team performance in relation to product development. With important questions around technical debt, PR speed, and potential bottlenecks, they began searching for the right solution to address their needs.
The Right Tool for the Job
To quantify their engineering team’s performance and gain actionable insights, EverQuote was in search of a powerful solution. They tested Jira first, but found it wasn’t able to clearly connect the data to their engineering work. Another software intelligence platform wasn’t able to provide the comprehensive and holistic metrics that they needed.
With important questions unanswered around how much technical debt was accruing and how fast PRs were moving, EverQuote’s leadership found themselves frustrated knowing that there were bottlenecks in their code review process but lacking visibility into where or how work was getting stuck.
Enter Code Climate Velocity.
Actionable Insights Drive Process Optimization
EverQuote began working with Code Climate and found immediate value in Velocity. Engineering leaders and managers were able to see the precise length of time that PRs were open, and how much time transpired before they were reviewed and eventually merged. Velocity also allowed them to directly link each PR back to the relevant Jira ticket in the same view, providing the team with a more complete picture of their work to ensure transparency and accurate prioritization. Additionally, thanks to the breadth of metrics offered by Velocity, they were able to dig into each phase of development to gain a more complete understanding of their Cycle Time – their engineering speed – which provided deeper insights.
One such insight occurred when taking a high-level look at Velocity’s Code Review module. Everquote leadership observed that several teams were approving over half of their PRs without comments. Upon further investigation, they uncovered that these teams were handling a large volume of mundane tasks that did not actually need review. With this information, EverQuote’s engineering leaders quickly worked with product managers to automate more basic configuration tasks and reserve engineers’ time for complex work.
Data Reveals Trends and Coachable Moments
In many cases, the insights uncovered by Velocity extended beyond process improvements and helped managers identify opportunities to coach their team. In one case, Code Review analysis revealed a developer that had the highest level of Review Influence on the team – their reviews were thorough and meaningful – surprisingly had the lowest Involvement metric, meaning they were involved with the smallest percentage of pull requests.
Armed with this data, the engineering manager sat down with this developer to learn that they were spending a significant chunk of their time in meetings, limiting their capacity to be involved in the code review process. The manager applied these learnings and helped block off daily time on the developer’s calendar for code reviews. Within a month, their Involvement dramatically increased, and with their contribution to code reviews, the team was able to move code more quickly through review, improving the team PR Cycle Time by several percentage points.
A Multitude of Metrics to Increase Effectiveness
With Velocity integrated into their organization, EverQuote had a wealth of valuable information, enabling them to quickly identify where gaps and bottlenecks existed and helping them to pinpoint the causes. “I love how I can mix and match a bunch of metrics together to look for correlations, make hypotheses about what’s happening with teams, and identify datasets that line up with those hypotheses to validate them,” explained Pheak Yi, Director of Engineering.
Velocity’s reliable, concrete data helps EverQuote understand issues, make recommendations to teams, and evaluate the effectiveness and impact of changes. Since implementing Velocity, EverQuote has improved many critical metrics, including:
- ↑ 18% PR Throughput per Contributor
- ↓ 42% Cycle Time
- ↑ 19% Commit Volume
- ↓ 44% Time to First Review
- ↓ 53% Time to Merge
To learn how Velocity can help you uncover insights to optimize your team’s performance, reach out to one of our product specialists.

(Updated: February 26, 2024)
Born from frustration at the silos between development and operations teams, the DevOps philosophy encourages trust, collaboration, and the creation of multidisciplinary teams. As DevOps rose in popularity, DevOps Research and Assessment (DORA) began with the goal of gaining a better understanding of the practices, processes, and capabilities that enable teams to achieve a high velocity and performance when it comes to software delivery. The startup identified four key metrics — the “DORA Metrics” — that engineering teams can use to measure their performance in four critical areas.
This empowers engineering leaders, enabling them to benchmark their teams against the rest of the industry, identify opportunities to improve, and make changes to address them.
What is DORA?
DevOps Research and Assessment (DORA) is a startup created by Gene Kim and Jez Humble with Dr. Nicole Forsgren at the helm. Gene Kim and Jez Humble are best known for their best-selling books, such as The DevOps Handbook. Dr. Nicole Forsgren also joined the pair to co-author Accelerate in 2018.
The company provided assessments and reports on organizations’ DevOps capabilities. They aimed to understand what makes a team successful at delivering high-quality software, quickly. The startup was acquired by Google in 2018, and continues to be the largest research program of its kind. Each year, they survey tens of thousands of professionals, gathering data on key drivers of engineering delivery and performance. Their annual reports include key benchmarks, industry trends, and learnings that can help teams improve.
What are DORA metrics?
DORA metrics are a set of four measurements identified by DORA as the metrics most strongly correlated with success — they’re measurements that DevOps teams can use to gauge their performance. The four metrics are: Deployment Frequency, Mean Lead Time for Changes, Mean Time to Recover, and Change Failure Rate. They were identified by analyzing survey responses from over 31,000 professionals worldwide over a period of six years.
The team at DORA also identified performance benchmarks for each metric, outlining characteristics of Elite, High-Performing, Medium, and Low-Performing teams.
Deployment Frequency
Deployment Frequency (DF) measures the frequency at which code is successfully deployed to a production environment. It is a measure of a team’s average throughput over a period of time, and can be used to benchmark how often an engineering team is shipping value to customers.
Engineering teams generally strive to deploy as quickly and frequently as possible, getting new features into the hands of users to improve customer retention and stay ahead of the competition. More successful DevOps teams deliver smaller deployments more frequently, rather than batching everything up into a larger release that is deployed during a fixed window. High-performing teams deploy at least once a week, while teams at the top of their game — peak performers — deploy multiple times per day.
Low performance on this metric can inform teams that they may need to improve their automated testing and validation of new code. Another area to focus on could be breaking changes down into smaller chunks, and creating smaller pull requests (PRs), or improving overall Deploy Volume.
Mean Lead Time for Changes
Mean Lead Time for Changes (MLTC) helps engineering leaders understand the efficiency of their development process once coding has begun. This metric measures how long it takes for a change to make it to a production environment by looking at the average time between the first commit made in a branch and when that branch is successfully running in production. It quantifies how quickly work will be delivered to customers, with the best teams able to go from commit to production in less than a day. Average teams have an MLTC of around one week.
Deployments can be delayed for a variety of reasons, including batching up related features and ongoing incidents, and it’s important that engineering leaders have an accurate understanding of how long it takes their team to get changes into production.
When trying to improve on this metric, leaders can analyze metrics corresponding to the stages of their development pipeline, like Time to Open, Time to First Review, and Time to Merge, to identify bottlenecks in their processes.
Teams looking to improve on this metric might consider breaking work into smaller chunks to reduce the size of PRs, boosting the efficiency of their code review process, or investing in automated testing and deployment processes.
Change Failure Rate
Change Failure Rate (CFR) is a calculation of the percentage of deployments causing a failure in production, and is found by dividing the number of incidents by the total number of deployments. This gives leaders insight into the quality of code being shipped and by extension, the amount of time the team spends fixing failures. Most DevOps teams can achieve a change failure rate between 0% and 15%.
When changes are being frequently deployed to production environments, bugs are all but inevitable. Sometimes these bugs are minor, but in some cases these can lead to major failures. It’s important to bear in mind that these shouldn’t be used as an occasion to place blame on a single person or team; however, it’s also vital that engineering leaders monitor how often these incidents happen.
This metric is an important counterpoint to the DF and MLTC metrics. Your team may be moving quickly, but you also want to ensure they’re delivering quality code — both stability and throughput are important to successful, high-performing DevOps teams.
To improve in this area, teams can look at reducing the work-in-progress (WIP) in their iterations, boosting the efficacy of their code review processes, or investing in automated testing.
Mean Time to Recovery
Mean Time to Recovery (MTTR) measures the time it takes to restore a system to its usual functionality. For elite teams, this looks like being able to recover in under an hour, whereas for many teams, this is more likely to be under a day.
Failures happen, but the ability to quickly recover from a failure in a production environment is key to the success of DevOps teams. Improving MTTR requires DevOps teams to improve their observability so that failures can be identified and resolved quickly.
Additional actions that can improve this metric are: having an action plan for responders to consult, ensuring the team understands the process for addressing failures, and improving MLTC.
Making the most of DORA metrics
The DORA metrics are a great starting point for understanding the current state of an engineering team, or for assessing changes over time. But DORA metrics only tell part of the story.
To gain deeper insight, it’s valuable to view them alongside non-DORA metrics, like PR Size or Cycle Time. Correlations between certain metrics will help teams identify questions to ask, as well as highlight areas for improvement.
And though the DORA metrics are perhaps the most well-known element of the annual DORA report, the research team does frequently branch out to discuss other factors that influence engineering performance. In the 2023 report, for example, they dive into two additional areas of consideration for top-performing teams: code review and team culture. Looking at these dimensions in tandem with DORA metrics can help leaders enhance their understanding of their team.
It’s also important to note that, as there are no standard calculations for the four DORA metrics, they’re frequently measured differently, even among teams in the same organization. In order to draw accurate conclusions about speed and stability across teams, leaders will need to ensure that definitions and calculations for each metric are standardized throughout their organization.
Why should engineering leaders think about DORA metrics?
Making meaningful improvements to anything requires two elements — goals to work towards and evidence to establish progress. By establishing progress, this evidence can motivate teams to continue to work towards the goals they’ve set. DORA benchmarks give engineering leaders concrete objectives, which then break down further into the metrics that can be used for key results.
DORA metrics also provide insight into team performance. Looking at Change Failure Rate and Mean Time to Recover, leaders can help ensure that their teams are building robust services that experience minimal downtime. Similarly, monitoring Deployment Frequency and Mean Lead Time for Changes gives engineering leaders peace of mind that the team is working quickly. Together, the metrics provide insight into the team’s balance of speed and quality.
Learn more about DORA metrics from the expert himself. Watch our on-demand webinar featuring Nathen Harvey, Developer Advocate at DORA and Google Cloud.Watch our on-demand webinar featuring Nathen Harvey, Developer Advocate at DORA and Google Cloud.
For many CTOs, communicating with the CEO (or any member of the executive team) can be an unending source of frustration. Though I’m a CEO today, I’ve also been a CTO, and I’ve seen firsthand the challenges that brings. It’s not easy to convey a complete picture of the state of an engineering organization to a technical leader who isn’t involved in the team’s day-to-day, and it’s even harder when you’re speaking to someone without a technical background. You may be working towards the same goal, but if you’re not aligned on how to get there or how things are going, you’ll face unnecessary challenges at every turn.
Unless you know the secret — the key to enhancing alignment with executive stakeholders, including the CEO — clear, objective reporting.
Reporting isn’t just for your boss
CTOs often face difficulties securing budget for critical initiatives, facilitating agreement on the state of a situation, explaining that engineering isn’t always the bottleneck, and more. These may seem like distinct challenges, but in reality they share a common foundation — they’re all difficulties rooted in issues of communication and alignment.
A key responsibility of executive leadership is improving communication and facilitating alignment. No matter how well your team performs, no matter how stellar your software, your department’s success will likely be limited if you can’t get stakeholders on the same page. In order to promote alignment, you’ll need to leverage one of the most underappreciated, oft-maligned tools at your disposal: reporting.
Though it has a bad reputation — Office Space’s TPS reports always come to mind — reporting has a lot to offer. Not timecards, not compulsory bureaucratic tracking, but great reporting (more on what that means in a moment), can offer enormous benefit to you and your team. Done well, reporting allows you to frame the conversations you need to have, and inform the decisions that need to be made.
Every other department has already learned this lesson. Sales, Marketing, HR, and Finance are all reporting on objective data, using it to advocate for their departments and drive critical discussions with the rest of the executive team. It’s time for engineering leaders to do the same.
What is great reporting?
In this context, reporting is the process of gathering and sharing quantitative and qualitative information in order to create the opportunity for shared, fact-based understanding. It ensures that everyone comes to the table with the same data, and that they’re operating on the basis of facts, not feelings. Understanding occurs when that data is contextualized and internalized, and can be used to drive conversations and decisions.
Great reporting goes above and beyond the requirements of that definition. It involves:
- Consistent data — Tracking the same metrics in every report makes it possible to track trends and surface patterns.
- Curated data — Sticking to the most relevant data makes reporting more useful; too much information can be just as useless as none at all.
- Predictable intervals — Reporting on a regular cadence helps establish and strengthen understanding.
- Appropriate context — Sharing additional information — for instance, pairing data with industry benchmarks, past trends, or other relevant metrics — can help tell a more complete story.
- Necessary precision — Using the most logical unit of measurement is important; if you measure something in hours instead of minutes or days, it can be a distraction unless the reason for that interval is clear.
- Correct elevation — Choosing data with the right level of granularity can make it easier for your report’s recipient to understand.
Reporting establishes a shared foundation for having critical conversations and making key decisions, but it’s just a starting point. Your report might show your CEO that things are going well, or that a major initiative is off-track, but it can’t explain why, nor can it solve problems. Still, when done well, reporting can be the basis for productive collaboration, and can help you drive success in your organization.
To find out how to leverage clear, objective reporting to meet your organizational goals, request a consultation.

Code Climate, the enterprise-level Software Engineering Intelligence (SEI) solution, today welcomes Kathleen Rohrecker as Senior Vice President of Marketing.
Rohrecker is a marketing executive with a strong track record of increasing the value of growth-stage technology companies. Prior to joining Code Climate, Rohrecker was Senior Vice President of Marketing at application intelligence and automation provider NS1. Under her leadership, NS1’s brand valuation increased by over $300M. Prior to her tenure at NS1, Rohrecker served as CMO for Maxymizer and Revolution Analytics, positioning those companies for acquisition by Oracle and Microsoft respectively.
“Kathleen has a history of scaling the value, audience, and customer base of every company she works for,” says Bryan Helmkamp, Founder and CEO of Code Climate. “Our Software Engineering Intelligence platform has the power to transform the daily lives of software engineering leaders. We’re fortunate to have a communications leader with Kathleen’s talent and vision to help us tell that story.”
Rohrecker’s data-driven approach to marketing strategy is a natural fit for the data insights startup. As Senior Director of North American Marketing for Oracle, Rohrecker developed a financial model to measure the relative contribution and conversion metrics for all inbound, outbound, and pipeline acceleration marketing programs, supporting nearly 300 sellers. At Revolution Analytics, her go-to-market strategy for big data analytics solutions led to a 500% increase in average contract values in 18 months.
“Throughout my career, I’ve been privileged to help technology companies reach their full market potential, and I’m keenly aware of the power of data-driven insights to accelerate business outcomes,” says Rohrecker. “I look forward to elevating Code Climate among the engineering and business leaders who need it most.”
Rohrecker resides in the greater New York City Area. She holds an MBA from Hofstra University and a Bachelor’s degree in Economics from William & Mary.
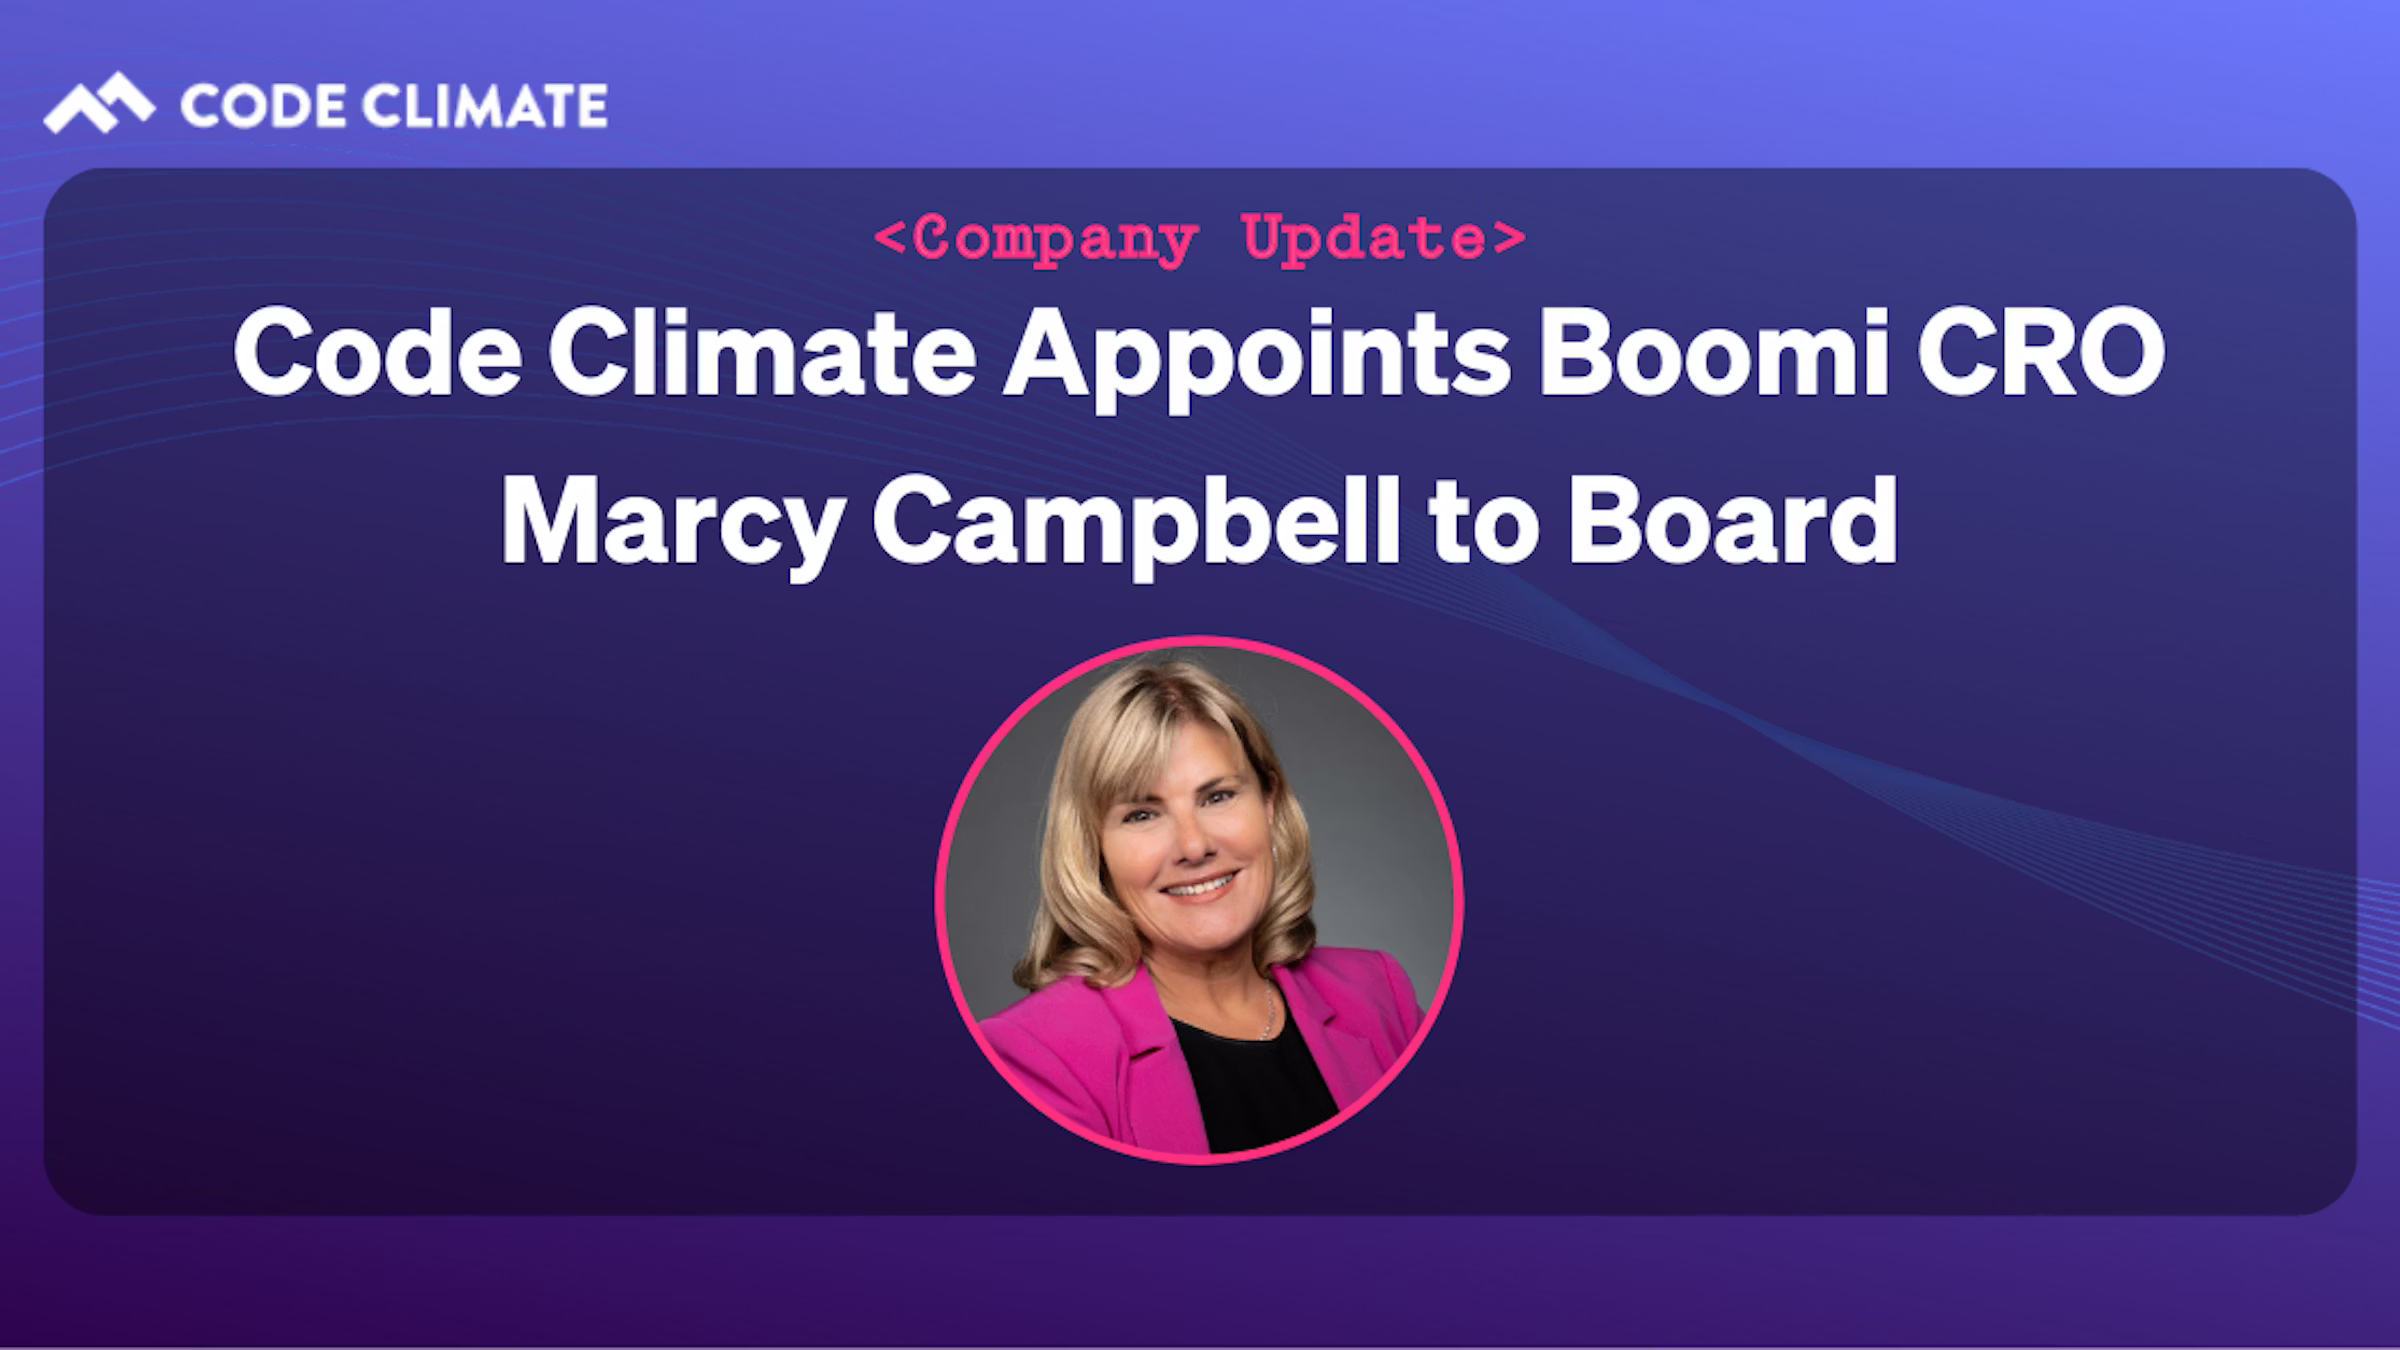
Code Climate, the enterprise-level Software Engineering Intelligence solution, today announces that Marcy Campbell, Chief Revenue Officer for Boomi, has been appointed to the Code Climate Board of Directors.
Campbell brings over 30 years of experience leading large-scale, go-to-market organizations for global companies ranging from Fortune 500 to venture-backed technology firms. Prior to recently joining Boomi, the intelligent connectivity and automation leader, she served as senior vice president at PayPal where she led global sales, professional services, and operations.
“Marcy has an incredible record of helping software providers grow from early startup stages into global operations, and she’s been a strong advocate for data-driven decision-making in organizational leadership,” says Bryan Helmkamp, co-founder and CEO of Code Climate. “Having known Marcy for over 15-years, I’m thrilled to add her expertise in DevOps and go-to-market strategy to our Board of Directors.”
“Having worked with many of the largest companies in the world, as well as cutting-edge brands, I have an experimental nature — I’m attracted to opportunities to work with companies that have a compelling vision and help them massively scale,” says Campbell. “I am honored to join Code Climate’s board and to support their mission of bringing transparency to software engineering.”
As CRO of Boomi, Campbell spearheads the category-leading, global software as a service (SaaS) company’s revenue-generating strategies with a focus on driving fast growth, while continuing to deliver value to its more than 20,000 customers globally. She also serves on the Board of Directors for marketing analytics company NextRoll, a machine learning marketing platform, and on the Board of Advisors for the Asian University for Women, as well as acts as a mentor for the Cherie Blair Foundation.
Campbell has been recognized as a Silicon Valley Business Journal Woman of Influence, a Top 100 Global Sales Leader by The Modern Sale, and as one of the Most Influential Women in Payments by PaymentsSource.com. She resides in the San Francisco Bay area, holds a degree from the University of Hartford, was a National Regent Scholar and most recently a Member of the Board of Regents.
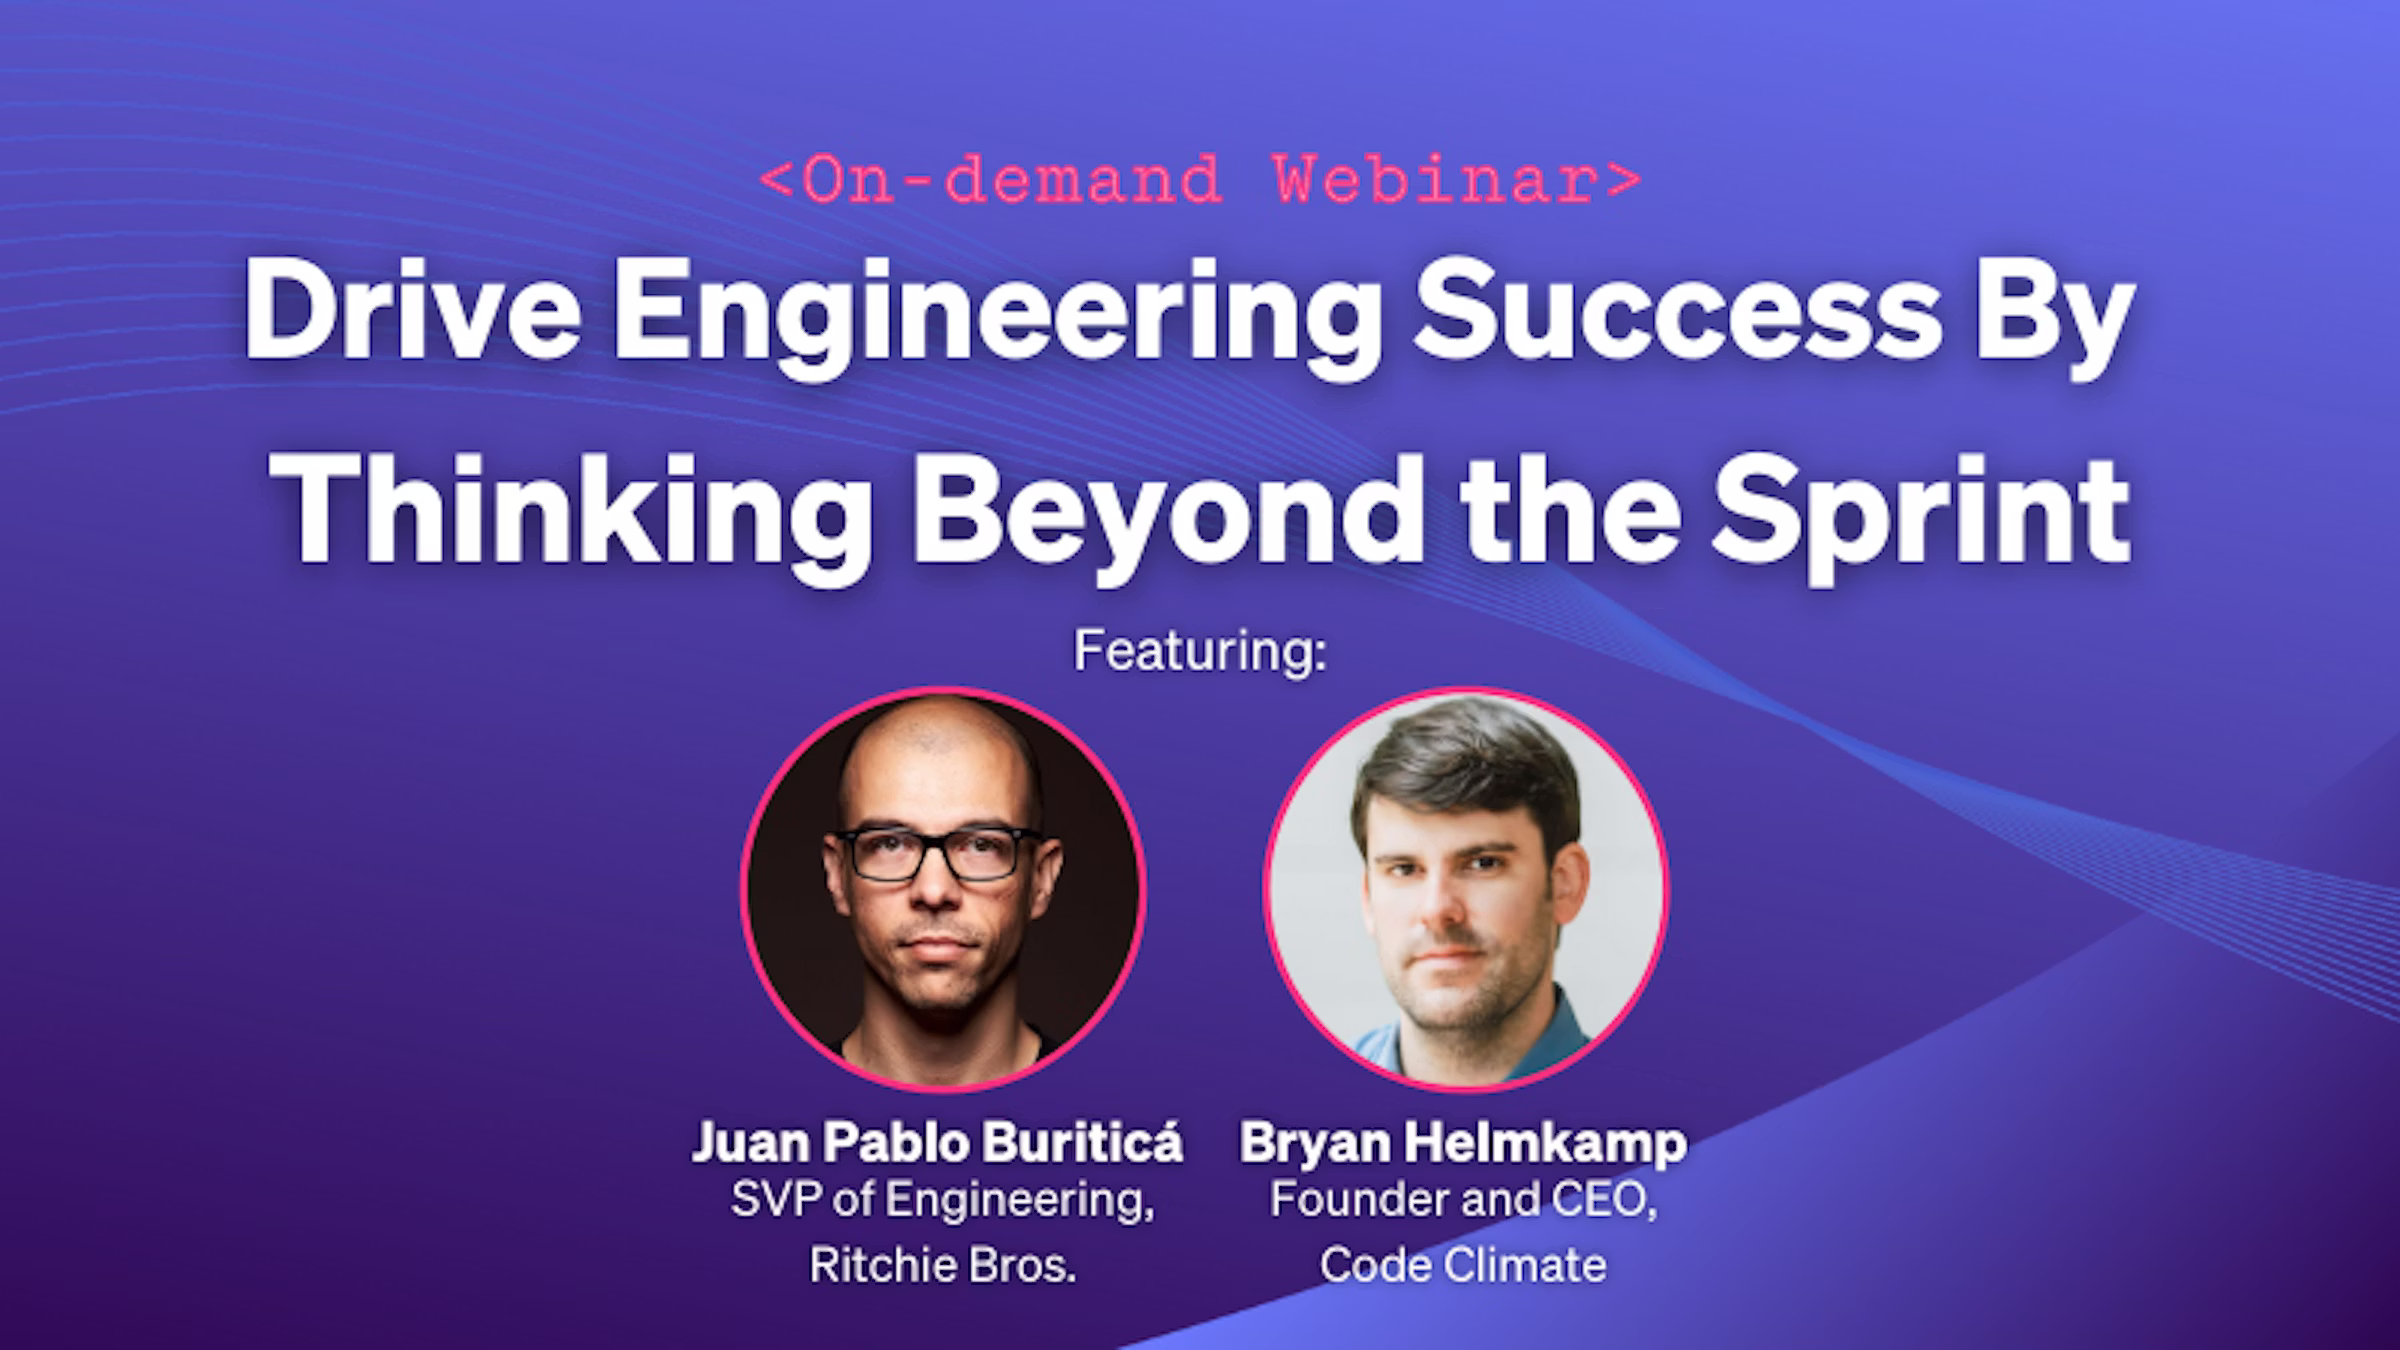
To deliver maximum value within an organization, engineering teams must balance strategic, long-term vision with enough flexibility to react to unforeseen, yet inevitable, changes along the way. An operational cadence — a scaffolding of benchmarks and meetings that provide structure for a team’s activities — is one way successful teams stay focused on goals, improve performance, respond to changes, and communicate with other business units within their organizations. We recently went in-depth on the subject in a virtual conversation between Code Climate Founder and CEO, Bryan Helmkamp, and Juan Pablo Buriticá, SVP of Engineering at Ritchie Bros.
Read on for highlights and check out the on-demand recording here to see the full conversation.
What is an operational cadence anyway?
Juan Pablo kicked the conversation off by summarizing an operational cadence as a collection of meetings, ceremonies, or regular communications that “help create a rhythm for an organization on which to operate, on which to become predictable and do things better.”
Bryan quickly agreed, “I think about operational cadences as really being almost like an operating system… [a cadence is] a set of interlocking practices, some of them might be daily, weekly, monthly, quarterly, annually…together these give the organization the ability to have a shared understanding of what’s happening.” He elaborated that in addition to creating a predictable schedule, operational cadences allow organizations “to have a shared language to talk about, ‘this is what we do each month and this is what that means,’ without having to explain it from scratch every time.”
Fostering alignment, predictability, observability, and autonomy
With the structure and high level benefits of an operational cadence introduced, the conversation turned to the specific value that observing this cadence delivers to engineering teams and their organizations. Bryan zeroed in on one crucial benefit, alignment, and the ripple effect that ensues once alignment is achieved: “With an established cadence, you have the opportunity to increase alignment. And alignment is… a huge factor into how much impact a given effort’s going to have.”
He elaborated on the importance of this alignment, “Parts of a cadence can serve as a way to identify issues earlier. Because if you have an issue and it doesn’t get surfaced until it’s been going on for months, the cost associated with that and the waste associated with that can be quite significant. By having a regular cadence and set of interlocking processes, you get this backstop at a minimum that makes sure that if there’s an alignment issue, if there’s a change in context that requires a change in priorities, that it’s going to get surfaced and be able to be addressed with appropriate visibility and appropriate collaboration and stakeholders.”
Juan Pablo added his own perspective, “I’d distill the value to three things. When I was in startups, the principal value I got was predictability. I didn’t like running a team where the strategy was changing every week. By pushing strategic reviews into a monthly cadence or a little bit of a longer stretch, we got air cover to work, and we also got the leadership group some checkpoints. Next, observability. If it is a larger organization, if it’s grown past 40, 50, 60 engineers, it’s hard to know — and you shouldn’t be looking to know — what everyone is doing, but rather trying to observe the system or monitor the system from outside…And then the last thing is autonomy. If you have predictability and observability, then teams can be autonomous… to not have a ton of oversight, but there’s still this broadcast of information that is flowing.”
Identifying the optimal cadence
As the conversation progressed, Bryan and Juan Pablo transitioned from the abstract to a more detailed discussion of how and when to implement an organizational cadence. One thing was immediately apparent — there is no universal “optimal cadence.” With variables such as size, structure, goals, and more affecting each business differently, teams must identify what works best for their unique situation. Juan Pablo shared his personal preference, “I generally like… having some weekly ceremonies, some biweekly ceremonies, monthly, quarterly, and then either every six months or a year.” He emphasized that this varies by organization however, “depending on your stage, if you’re trying to move really, really quickly, doing quarterly or yearly planning doesn’t really make sense.”
Bryan expanded on Juan Pablo’s assessment, “I 100% agree that there’s no single right answer. There might be a this-is-best-for-us-right-now answer that everybody can work towards, and it’s a moving target.” He then encouraged people to think about their own organizational rhythms that may be on a longer timeline than a weekly sprint, suggesting that teams supplement their sprints with sessions on a monthly, or even quarterly basis, which “can be very helpful both in terms of the planning side of things, to give people more information about what to expect… and also for the standpoint of that continuous improvement process.”
Bryan then compared the benefits of a strategic organizational cadence against the commonly-used retrospective, “I think retrospectives are fantastic tools, but they tend to gravitate towards small incremental improvements.” He then clarified, “They don’t naturally serve as well to press the really big questions… when you have 45 minutes to try to make some improvements for the next week. And I think what we’ve seen is there’s a benefit to being able to ask bigger questions and to think about bigger time horizons as a supplement to whatever’s working well for you at the tactical execution level.”
Borrowing cross-functional best practices
As the conversation touched on the strategies and practices Juan Pablo and Bryan’s own organizations employ, Bryan relayed several things that he has picked up from watching non-engineering departments within Code Climate. In particular, his sales team caught his attention, “Some of the things that they do that I think have a really interesting opportunity for helping on the engineering side as well, are things like internal QBRs, or Quarterly Business Reviews. They’re not really running team-level weekly retrospectives, but each quarter they pull out, ‘What were all of our successes and opportunities for improvement that we learned over the past quarter. What are our key focus areas going forward for next quarter?’ Maybe there are new ways we’re going to do things or there’s new content that we’re going to introduce into our sales process, and that’s at the quarterly level.”
Juan Pablo responded to Bryan’s point about QBRs with a practice he has put into place, “The QBR is a written exercise. So all engineering groups report on their business metrics because that helps engineers understand what levers they have… it starts giving insight to other people about how things are working, how they’re being impactful or not, and how to be a little bit more business-oriented.”
Bryan tied their ideas on the topic together, “Two elements of that that I think are really powerful: One is that shift from verbal communication or informal communication to written and structured communication. And that’s something that as organizations get larger, I think becomes more and more important. And you just hit this tipping point where if it’s not written down, then this is not going to work.”
He continued on, “But with respect to sort of data and metrics, part of what I’m hearing in there is that there’s advantage to using regular operating cadences as an opportunity to push information out to the collaborators and to those other stakeholders who would benefit from having that same understanding of what’s going on. And I think that that’s an area where every department can always be improving, but engineering in some ways has been a little bit further behind than some of the other functional areas in organizations.”
Metrics as a shared language
With the conversation pivoting to the idea of using metrics as a shared language to ensure cross-functional alignment, Juan Pablo relayed a fitting anecdote. When a former boss approached him to ask why their team was operating slowly, he was initially unable to answer the question. However, after a few months of digging into the metrics, “I was able to talk a lot more about Cycle Time and throughput, and not only talk about it, but visualize it. I started… to understand how to distill all of that to the board of directors who shouldn’t really know that much about capabilities or many of the underlying reasons for these metrics, but every board meeting I could show, ‘This is how far we are. Here’s an industry comparison, what a high performing engineering organization is… how far we are, and the impact we’ve had.”
With Juan Pablo’s board and team aligned on metrics and strategy, the results followed shortly after, “Two or three quarters after we had started our acceleration strategy, you could clearly see the reduction of Cycle Time… In the period of 18 months, we reduced it by 10 times because we had visibility, and I could explain it and continue to track it with the executive team and with the board, but also I was able to give concrete direction to the engineering group.”
Balancing proactive planning with reactive needs
In a perfect world, organizations would identify their optimal cadence, align business units and goals based on universally understood metrics, and proactively address anything looming on the horizon. Unfortunately, real life gets more complicated and situations arise that teams are forced to address reactively. Juan Pablo discussed how he manages this reality, “I’ve learned that once I’ve moved to a certain level of direction, I can’t be prescriptive on how we achieve our goals. Where I need to focus is on drawing the line and ensuring that our product strategy and our business strategy is solid… Product engineering needs to find ways to achieve those outcomes. Because then the agility is really only on how they are getting it.”
Bryan distilled his thoughts on the balance succinctly, “There’s a value in being proactively reactive.” He elaborated with an example, “I’m thinking about how there’s this tension between, for example, roadmap feature work and things that might come up from incidents, escalations, or customer requests… I think that’s the first piece, to plan for the fact that some of the work is going to need to be reactive and you’re not going to know what it is until it comes along, but you know that something is going to come along.”
Implementing and optimizing an organizational cadence
To close out the conversation, Bryan and Juan Pablo turned to the practical matter of who should be responsible for deciding upon and implementing an organization’s cadence, and how to do so. Juan Pablo laid out his perspective that while cadence should be coordinated with the executive group to ensure company-wide alignment, it “should be sponsored by the leaders who have ownership over it. I think engineering managers can only get as far as their own group, some of their peers groups, product, or other functions that they work in, but they’re going to have zero influence on strategic executive planning or other things.”
Bryan added, “I would say don’t make perfect the enemy of good. Get started with understanding that you’re going to iterate the cadence itself. Everything’s going to be iterated. And I agree 100% with what Juan Pablo said, that leaders do need to lead, and this is an area where leadership is really important.”
Using data to drive engineering success beyond the sprint
Successful engineering teams can leverage data in tandem with an organizational cadence to stay aligned and perform at their highest level. To learn more, request a consultation.

Engineering productivity is notoriously difficult to measure. Classic metrics tend to focus exclusively on outputs, but this approach is flawed — in software engineering, quantity of output isn’t necessarily the most productive goal. Quality is an important complement to quantity, and a team that’s measuring success in lines of code written may sacrifice conciseness for volume. This can lead to bloated, buggy code. A team focused on the number of features shipped may prioritize simple features that they can get out the door quickly, rather than spending time on more complex features that can move the needle for the business. The SPACE Framework aims to address this by replacing output-focused measurements with a more nuanced approach to understanding and optimizing developer productivity.
This research-based framework offers five key dimensions that, viewed in concert, offer a more comprehensive view of a team’s status. These dimensions guide leaders toward measuring and improving factors that impact outputs, rather than focusing solely on the outputs themselves.
Importantly, SPACE foregrounds the developer. It recognizes that leaders must empower their team members with the ability to take ownership of their work, grow their skills, and get things done while contributing to the success of the team as a whole.
What is the SPACE Framework?
The SPACE Framework is a systematic approach to measuring, understanding, and optimizing engineering productivity. Outlined by researchers from Github, Microsoft, and the University of Victoria, it encourages leaders to look at productivity holistically, placing metrics in conversation with each other and linking them to team goals. It breaks engineering productivity into five dimensions, Satisfaction and Well-being; Performance; Activity; Communication and Collaboration; and Efficiency and Flow.
Satisfaction and Well-being – Most often measured by employee surveys, this dimension asks whether team members are fulfilled, happy, and practicing healthy work habits. Satisfaction and well-being are strongly correlated with productivity, and they may even be important leading indicators; unhappy teams that are highly productive are likely headed toward burnout if nothing is done to improve their well-being.
Of all five SPACE dimensions, satisfaction and well-being is the hardest to quantify. Objective metrics can’t directly measure developer happiness, but they can point to circumstances that are likely to cause dissatisfaction or burnout. By viewing quantitative metrics in tandem with qualitative information and survey data, engineering leaders can better assess team satisfaction.
With Code Climate's Software Engineering Intelligence (SEI) solution, leaders can view engineering metrics like Coding Balance to get a sense of developer workload. Coding Balance displays the percentage of contributors responsible for 80% of your team’s most impactful work. If work is not evenly distributed, overloaded team members may be overwhelmed, while those doing less impactful work may not be challenged enough.
Another informative measure, Work in Progress PRs, offers a count of Pull Requests with activity over a 72-hour period. A high Work in Progress number could mean that developers are forced to context switch often, which can prevent developers from entering a state of flow. The ideal number of Work in Progress PRs is usually 1-2 PRs per developer.
To get a better understanding of overall satisfaction, engineering leaders should look at both short term changes and overall trends. For example, when an engineering manager at Code Climate noticed a spike in volume of PRs and reviews in a short amount of time, she took it as a sign to further investigate the workload of each developer. When she discovered that engineers were working overtime and on weekends in order to ship new features, she successfully advocated for extra time off to recharge and avoid potential burnout.
Performance – The originators of the SPACE Framework recommend assessing performance based on the outcome of a developer’s work. This could be a measure of code quality, or of the impact their work has on the product’s success.
Metrics that help evaluate performance include Defect Rate and Change Failure Rate. Change Failure Rate is a key performance metric, as it measures the percentage of deployments causing a failure in production, helping engineering leaders understand the quality of the code developed and shipped to customers. Every failure in production takes away time from developing new features and ultimately has a negative impact on customers.
When assessing team performance, PR Throughput is an important counterpoint to quality metrics. This metric counts PRs merged (a bug fix, new feature, or improvement) over time, and is correlated to output and progress. To get a full picture of performance, PR Throughput should be viewed alongside quality metrics; you’ll want to ensure that your team is delivering at volume while maintaining quality.
Activity – This dimension is most reminiscent of older measures of productivity as it refers to developer outputs like on-call participation, pull requests opened, volume of code reviewed, or documents written. Still, the framework reminds leaders that activity should not be viewed in isolation, and it should always be placed in context with qualitative information and other metrics.
Useful Activity metrics to look at include coding metrics, such as Commits Per Day, the average number of times Active Contributors commit code per coding day, and Pushes Per Day, the average number of times Active Contributors are pushing per day.
These metrics offer an overview of developer activity so you can gauge whether or not work is balanced, if workload matches expectations, and whether delivery capacity is in line with strategic goals.
It can also be helpful to look at Deployment Frequency, which measures how often teams deliver new features or bug fixes to production.
Communication and Collaboration – The most effective teams have a high degree of transparency and communication. This helps ensure developers are aligned on priorities, understand how their work fits into broader initiatives, and can learn from each other. Proxies for measuring communication and collaboration might include review coverage or documentation quality.
Code Climate supports Pair Programming, which encourages collaboration. Credit can be attributed to two developers who write code in a pairing session.
Metrics like Review Speed, Time to first Review, and Review Coverage, can help you assess the health of your collaborative code review process. These metrics can help identify whether your team is keeping collaboration top of mind, has enough time to review PRs, and is giving thoughtful feedback in comments.
Efficiency and Flow – In the SPACE framework, flow refers to a state of individual efficiency where work can be completed quickly, with limited interruption. Efficiency is similar, but it occurs at the team level. Both are important for minimizing developer frustration. (Though it’s worth noting that when an organization has too much efficiency and flow, it’s not always a good thing, as it may be at the expense of collaboration or review.) Perceived efficiency and flow can be important information gathered via survey, while speed metrics can capture a more objective measurement.
In Code Climate's SEI platform, Cycle Time is an important metric to view within the context of efficiency and flow, as well as Mean Lead Time for Changes. Cycle Time, aka your speedometer, is representative of your team’s time to market. A low Cycle Time often means a higher output of new features and bug fixes being delivered to your customers. Cycle Time is an objective way to evaluate how process changes are affecting your team’s output. Often, a high output with quality code can speak to a team’s stability.
Mean Lead Time for Changes, which refers to DevOps speed, measures how quickly a change in code makes it through to production successfully. This can be correlated to team health and ability to react quickly. Like Cycle Time, it can indicate whether your team’s culture and processes are effective in handling a large volume of requests.
How can you implement the SPACE Framework?
The framework’s authors caution that looking at all five dimensions at once is likely to be counterproductive. They recommend choosing three areas that align with team priorities and company goals. What a team chooses to measure will send a strong signal about what the team values, and it’s important to be deliberate about that decision. They also remind leaders to be mindful of invisible work and to check for biases in their evaluations.
At Code Climate, we’ve spent years helping software engineering leaders leverage engineering data to boost their teams’ productivity, efficiency, and alignment. With that experience in mind, we have a few additional recommendations:
- Be transparent. When introducing data in your organization or using data in a new way, it’s important to be open. Make sure your team members know what data you’re looking at, how you plan to use it, and what value you hope to gain from it.
- Place all metrics in context. Quantitative data can only tell you so much. It’s critical to supplement metrics with qualitative information, or you’ll miss key insights. For example, if you’re measuring activity metrics and see a decrease in pull requests opened, it’s important to talk to your team members about why that’s happening. You may find out that they’ve been spending more time in meetings, so they can’t find time to code. Or you may learn that they’re coding less because they’re working to make sense of the technical direction. Both these situations may impact activity, but will need to be addressed in very different ways.
- Work data into your existing processes. The most effective way to build a new habit is to layer it onto an existing one. If you’re already holding regular 1:1s, standups, and retros, you can use them as an opportunity to present data to your team, assess progress toward goals, and discuss opportunities for improvement. By bringing data to your meetings, you can help keep conversations on track and grounded in facts.
Why does the SPACE Framework matter?
The SPACE Framework helps engineering leaders think holistically about developer productivity. The five dimensions serve as critical reminders that developer productivity is about more than the work of one individual, but about the way a team comes together to achieve a goal. And perhaps somewhat counterintuitively, understanding productivity is about more than simply measuring outputs. In looking at multiple dimensions, teams can gain a fuller understanding of the factors influencing their productivity, and set themselves up for sustainable, long-term success.
Learn how you can use data to enhance engineering performance and software delivery by requesting a consultation.

Recent headlines might lead one to conclude that it’s more difficult than ever to build a high-performing team. Hiring is increasingly competitive, salaries are on the rise, and a growing number of people are choosing to switch jobs or exit the workforce entirely. But building a stellar team is about more than just recruiting great talent — it’s about investing in the talent you have. And that’s not investment in the financial sense (though salaries and benefits are important!), it’s a commitment to coaching and upskilling your existing team.
Focusing on professional development is a win-win. Helping developers excel will boost team performance. Ensuring that developers feel both challenged and supported will increase their job satisfaction and make them more likely to stick around.
How Can You Help Developers Upskill?
Of course, helping engineers level up their skills is a multi-layered process. Time and money set aside for learning is important, but it’s not enough. As a leader, there are things you can do to create a culture where positive feedback is welcomed, missteps are seen as learning opportunities, and developers feel comfortable openly discussing their professional goals. Once the cultural foundation is set, you can make adjustments to incorporate coaching into your team’s processes and help ensure that it remains a priority.
Culture Is Key to Leveling Up
Psychological safety is a prerequisite to the success of any coaching or professional development initiatives. In order for developers to have honest conversations about their career goals, or to be comfortable receiving feedback, they must trust that they will not be penalized for aspirations that are out of alignment with current responsibilities.
Though psychological safety is essential, it is just a baseline. An organization looking to prioritize professional development may also benefit from adopting elements of Continuous Improvement. In Continuous Improvement, every member of a team is on the lookout for opportunities to make incremental improvements. The underlying belief is that even small changes to processes, products, and more can have a big impact.
At the individual level, it would be detrimental to engage every team member in a conversation about one engineer’s professional development. The critical takeaway from Continuous Improvement is that improving should not be a top-down process. When it comes to coaching, it’s important to empower individuals with an active role in their professional development. They can actively contribute by identifying areas of incremental improvement, making plans for their own development, and setting and tracking progress toward goals. When they are involved in making plans, they’ll be more likely to see them through. As they realize the value of making small, positive changes, they’ll be motivated to keep learning.
Create Regular Touchpoints
At the process level, effective upskilling requires consistent check-ins and conversations. Regular 1:1s are a great opportunity to surface opportunities for upskilling, and to evaluate progress toward goals. Come prepared with observations and discussion points, and encourage your team members to do the same. Give them the chance to raise their questions and concerns first, so you can get a more complete understanding of what blockers are impacting them the most, and what skills they’d most like to improve. Make their goals a priority whenever possible, and seek out opportunities to challenge team members to envision how their goals align with business priorities.
These touchpoints will be most effective when a baseline of safety has already been established, though it’s still important to be proactive about reinforcing trust during 1:1s. Practicing vulnerability can help establish the right tone. You may also want to remind team members that 1:1s are not meant for work-related status updates, but for bigger picture conversations about their role, skills, and aspirations.
Leverage Data To Coach More Effectively
Leaders can supplement qualitative conversations with Engineering Intelligence data from a platform like Code Climate. With the help of objective data, it’s possible to cut through biases, check assumptions, and more accurately assess how a particular developer is working.
For example, you may observe that a particular team member rarely contributes in meetings, and only speaks when spoken to. You may conclude that this team member is not engaged or invested in their work, or that they don’t value collaboration. Engineering data can help you test that hypothesis. You might find that this same team member is an active participant in Code Reviews, frequently leaving thorough, impactful feedback for their peers. Where you once might have encouraged this team member to be more collaborative, you can now offer more specific feedback around participating in meetings. Alternatively, you may decide to accept their participation in reviews as evidence of their commitment to teamwork, and instead, work with them on another area of growth.
You can also use engineering data to identify specific units of work that may present learning opportunities. For example, if you notice that a developer has an abnormally large or long-running PR, you can have a conversation about the circumstances that are drawing things out. This allows you to surface potential anti-patterns or areas of weakness that may benefit from coaching. You may learn that the developer is having an issue with that particular area of the codebase, or you may find that they would benefit from coaching around coding hygiene.
It’s important to remember that metrics are not diagnostic, and quantitative data must always be placed in context. Different projects will naturally progress at different speeds, and non-code-related factors can impact the data. One engineer may appear to be struggling when in reality, they’re simply working through a tricky problem. Another engineer may be adding value through glue work that isn’t as recognizable as shipped code. If you’re gathering relevant context and having open, honest conversations with your team, you’ll be able to determine whether a concerning data point has a reasonable explanation, is an anomaly, or indicates something that needs to be addressed.
Data can do more than help you surface potential areas for improvement. It can help you make those improvements a reality. Goals are more effective when paired with objective data. Metrics make it possible to set and track progress towards specific, actionable targets, which will set your team members up for success. You and your team members will be able to align on exactly what they’re working toward and see how effectively they’re getting there. If progress seems to stall, you can check-in and re-evaluate your tactics — or the goal itself.
Upskilling Is Key to Building a High-Performance Team
Coaching and professional development take time, but they’re critical to driving success and retaining your top performers. It’s not enough to simply hire talented people, as even the most skilled developers will be looking for opportunities to keep growing. With a mixture of cultural and process-level adjustments, you can help create an environment that encourages development while still advancing business priorities.
To find out how to leverage data from a Software Engineering Intelligence (SEI) platform to upskill team members and boost retention, request a consultation.
Psychological safety is a hot topic across all industries these days, but in the fast-paced and dynamic world of software engineering, it plays an especially important role in driving innovation and high performance. Yet, what exactly is psychological safety? Why is it so important for software engineering teams in particular, and how can it be fostered?
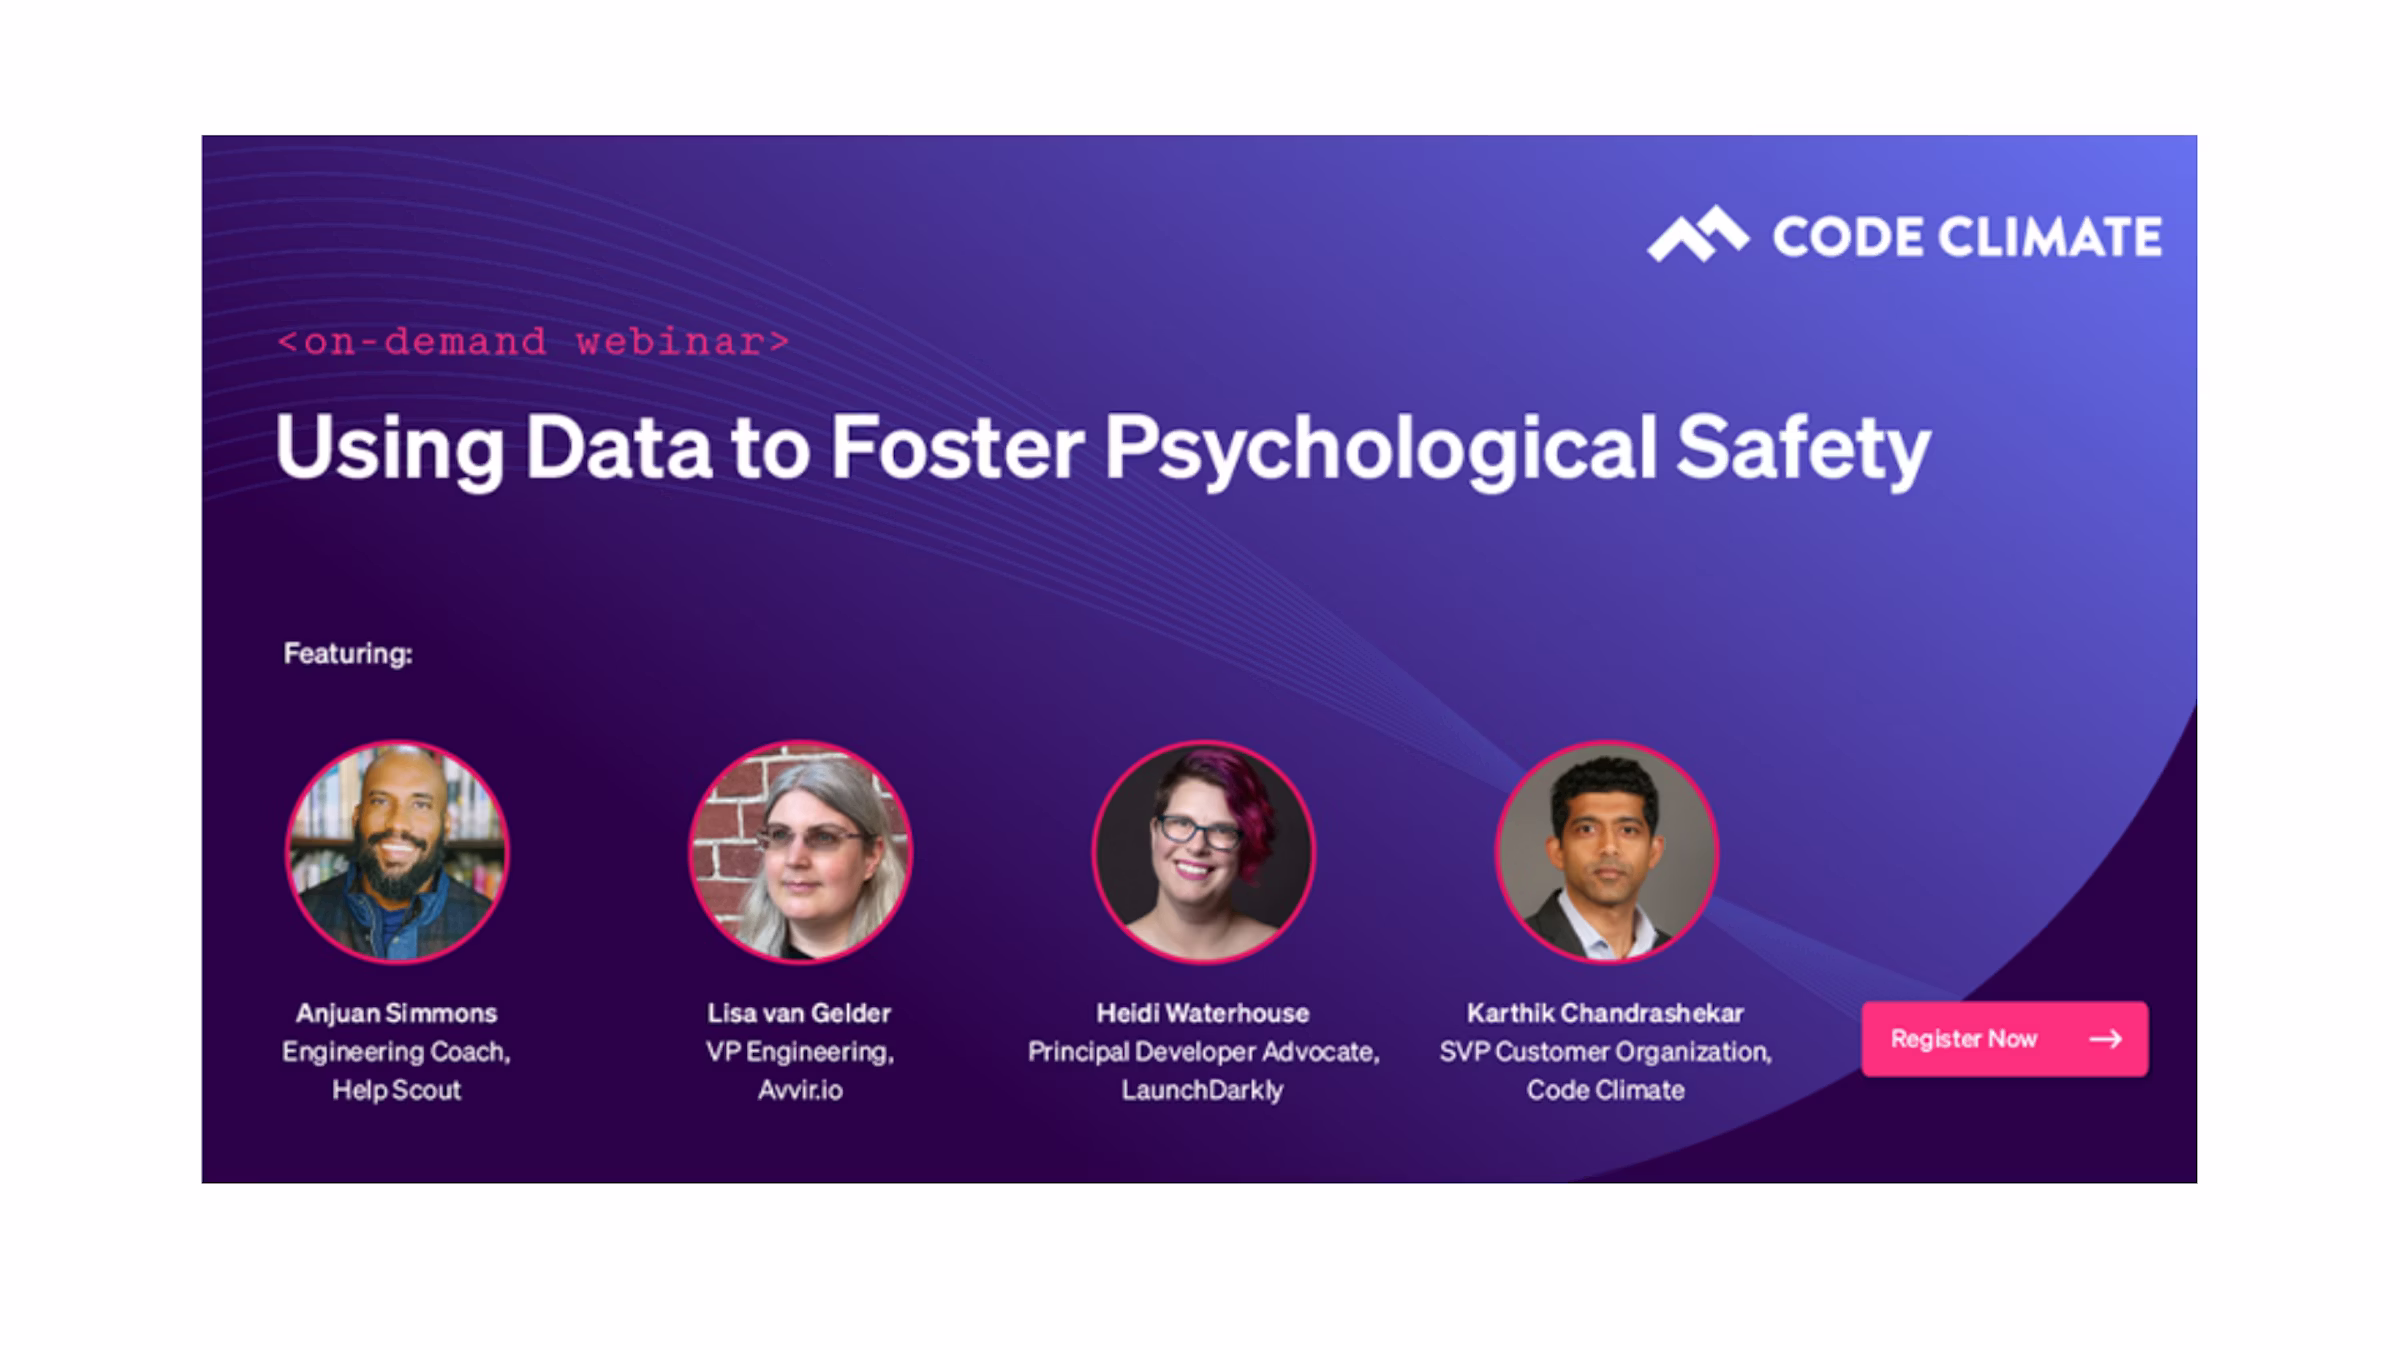
To gain real-world insight into this complex topic, Code Climate’s SVP, Customer Organization, Karthik Chandrashekar sat down with Anjuan Simmons, Engineering Coach at Help Scout, Heidi Waterhouse, Principal Developer Advocate at LaunchDarkly, and Lisa Van Gelder, VP of Engineering at Avvir.io, to discuss the importance of safety, the strategies they use to implement it, and how data helps them achieve it. Here are some highlights from their virtual roundtable.
Psychological Safety Heightens Speed and Performance
Lisa: [Psychological safety] gives engineers the ability to fully participate in a team. To give their ideas, to debate ideas, to feel free to take risks, to experiment. And if people don’t feel free to do those things, everything slows down.
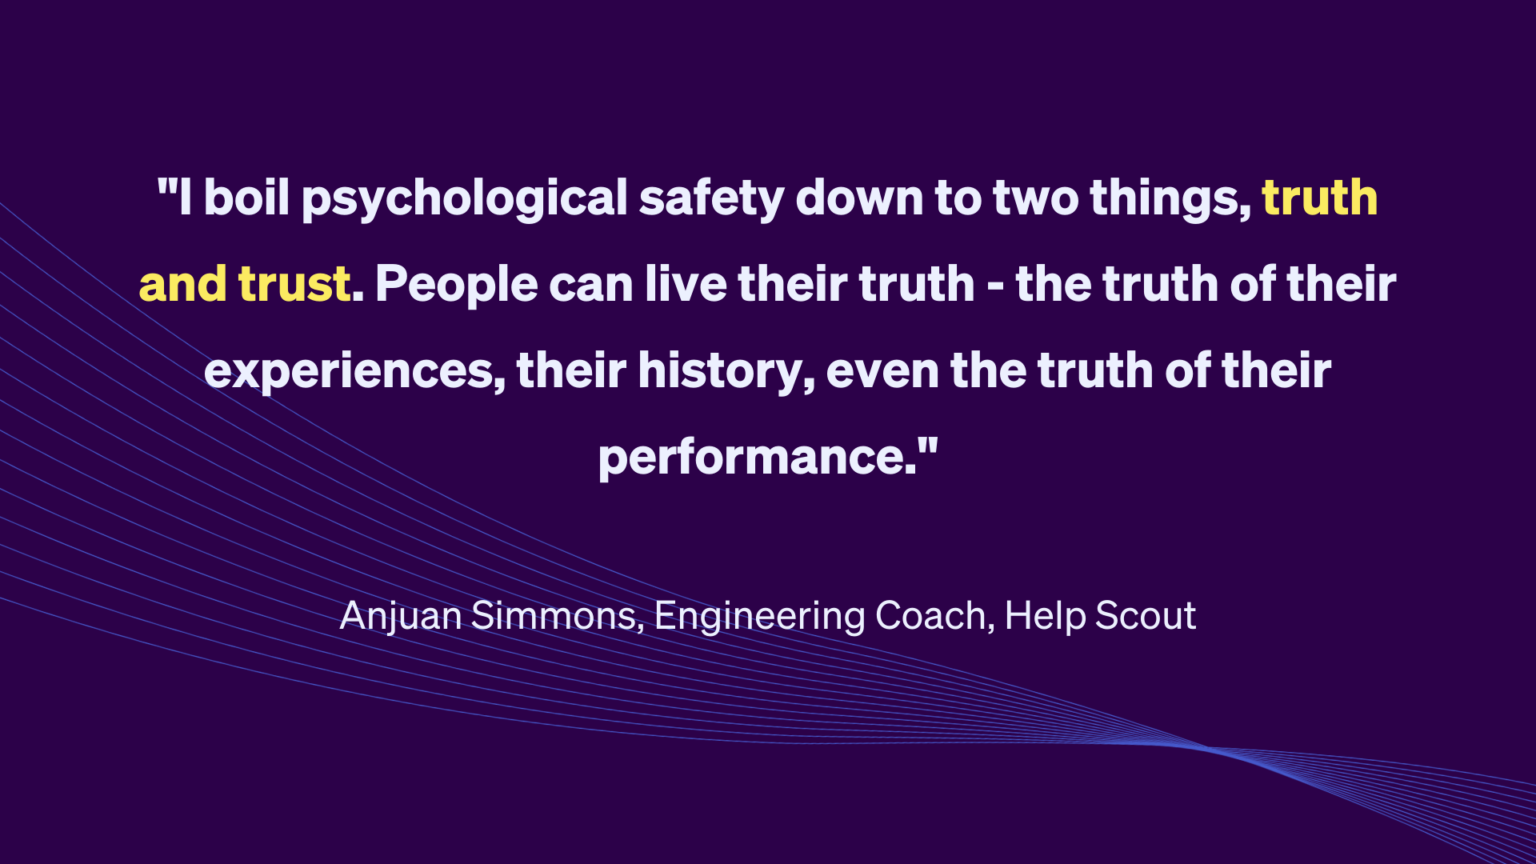
Anjuan: I boil psychological safety down to two things, truth and trust. People can live their truth – the truth of their experiences, their history, even the truth of their performance.
Heidi: When I come at psychological safety, I frequently come at it from the sort of scientific side, realizing how much of a difference it makes to the performance of a team. The faster a team moves, the more psychologically safe they are, the more they feel like they can take risks, but also the more they feel like they can take risks, the faster they move.
Learning Your Team’s Lived Experiences Helps Cultivate Safety
Anjuan: I think that leaders have to establish authentic relationships with their directs. One of the easy tactical things to do is to have weekly 1:1s. If you’re a manager and have people who you are responsible for, if you’re not meeting with them weekly in a 1:1, then you’re not engaged in a psychologically safe environment, because you just don’t even know where you are.
[During 1:1s] talk about more than just status or work. Discuss their career and personal goals and see what you can do to be supportive. By having those 1:1s, you begin to get an idea of their background and their profile. You’ll probably find that a number of the people who you work with and who are your directs have gone through trauma brought on by work, especially if they are members of marginalized groups. Knowing [someone’s history] is really important to understanding what team members may not be feeling psychologically safe and steps that you can take to help with that. I’ve never found a one size fits all approach to this. You have to tailor it to the individual people who you’re working with.
Heidi: The more senior we get, the more trauma we have. To this day I have a fear reaction when I’m one-on-one with my manager and they close the door. There’s nothing wrong with closing the door to give me feedback. That is in fact the responsible thing for a manager to do. But I got fired enough at crucial times in my career that I have a fear reaction. And so if I tell my manager [about my fear] they know that, and they preface the conversation with “nothing bad, just a little feedback,” and then I can relax and actually take in the feedback.
I think the idea of moving through the world as a trauma-informed person enables you to be considerate of the scars people are carrying around, becoming a force multiplier for your ability to be a good friend and manager, and to get the best out of the people that you’re working with.
Lisa: It’s not always obvious if your team is having issues with psychological safety. Ideally, they will tell you, but quite often, especially if you are a new leader on a team, they don’t trust you enough to let you in and tell you what’s going on. You kind of have to go into debugging teams mode, observe them, and see what happens. See if there are strange things that they’re doing that you don’t quite understand, because often there’s a safety issue underneath that.
I once had a team that used to hide around the office on Fridays. They weren’t answering emails, they weren’t answering Slacks. They wouldn’t tell me what was going on either. I did try and ask, but I also sat there the rest of the week with them to try and see what was happening. I realized that people were trying to give them work on Fridays and then they would blame them if it wasn’t done by Monday. On the outside it looked like the team was slacking off, when in reality, it was a safety issue. So when I say look for odd things you may have to do a little bit of detective work to see if something’s happening.
Put Metrics in Context
Lisa: When you think about introducing data or metrics onto your team, I encourage you to think about what those metrics are nudging the teams to do in order to meet those metrics, because it’s really easy to accidentally introduce a metric that would harm the psychological safety of your team.
A lot of the time when I come onto a new team, people will say the engineering team is moving too slow, that they want them to go faster and they want to measure this through the velocity of the team. However, it comes with connotations that the team isn’t working hard enough, and can impact the quality of work being delivered.
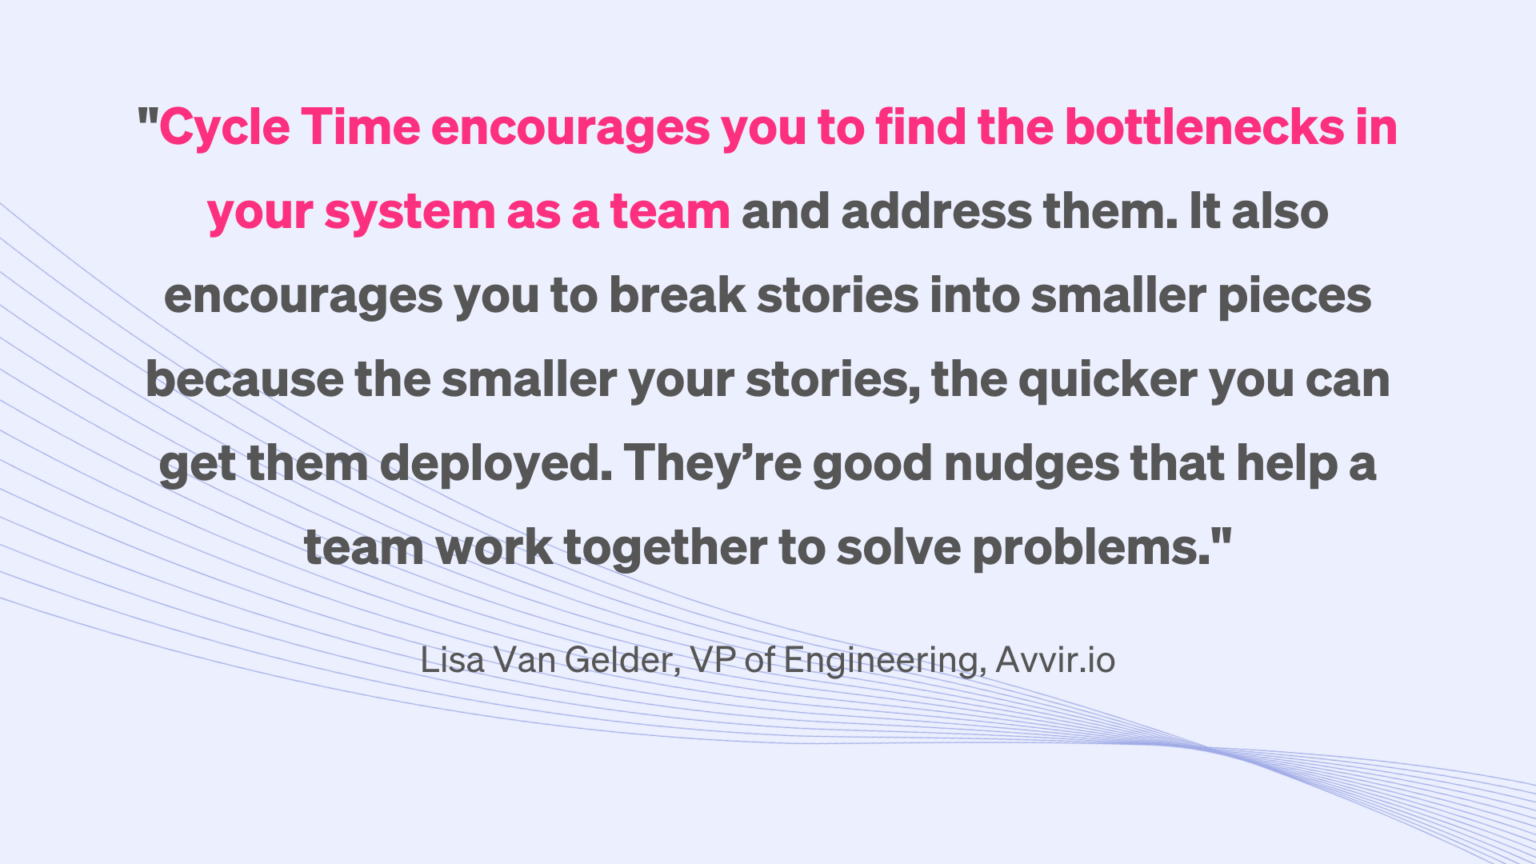
A metric I love to use instead is Cycle Time. I love it because it’s a full-team metric. [For example], if it takes an engineer two days to complete a story and seven days to deploy it, you have a better idea of where to start digging to spot areas that can be optimized. Cycle Time encourages you to find the bottlenecks in your system as a team and address them. It also encourages you to break stories into smaller pieces because the smaller your stories, the quicker you can get them deployed. They’re good nudges that help a team work together to solve problems.
Heidi: Metrics are useful for building safety and consideration around your team while still figuring out where your gaps and your problems are in a blameless way. Saying like, okay, here’s where things are sticking. How do we unstick them? Is that actually the first cause?

Anjuan: As an engineering leader who’s often called to figure out how to measure my teams and how to support them in getting better, there are a lot of metrics that are well-meaning, but are often counterproductive, like how many lines of code people do each week.
Some languages are simply wordier than others. So you can actually end up penalizing people working in languages where you may need 50 lines in one language but can do it in three in the other. It can also drive developers to add more crud to the codebase because they’re trying to gain in number of lines of code.
So you really need to take a step back and say “what are we measuring? What metrics are we trying to use?” to see if they are serving us well. And, “are they creating an environment where our engineers feel that they can inspect themselves, learn from their experiences, do their best work, or are we doing something where we’re actually harming them?”
Small Changes in Syntax can Improve the Environment
Anjuan: As I mentioned before, you always want to hone in on the lived experiences of the people who come through the doors of your company, whether they’re physical or virtual. There’s so many things that you can do to help take our industry, which is still steeped in colonialism, misogyny, transphobia, and all these horrible things, to begin debugging your work. So for example, at Help Scout, we took the common scrum term “backlog grooming” and changed it to “backlog refinement” because the word “grooming” has negative connotations. That small change was a nod to the fact that we understand that some words can be triggering to some people.
One other quick example: master/slave is used in weird ways in our industry when there’s better terminology out there. You can use “main,” for example. So again, if you look for these terms you can make changes to make a better environment.
Heidi: I love the example of the master/slave terminology because it’s also a safety check for your team. If somebody fights you really hard on that, there’s someone to keep an eye on because they are not considering how other people on the team might feel about it. They are attached the way things were.
Anjuan: We also talk about how, when people use the word “guys,” right? People in Slack will say, “Hey guys, I have a question.” Why are you assuming that everybody in the Slack channel are all male, right? Just [changing] little small things like that, you’re debugging your environment to be more inclusive, to be more open.
To find out more about using data to help foster psychological safety on your team, request a consultation.