Resources & Insights
Featured Article
Navigating the world of software engineering or developer productivity insights can feel like trying to solve a complex puzzle, especially for large-scale organizations. It's one of those areas where having a cohesive strategy can make all the difference between success and frustration. Over the years, as I’ve worked with enterprise-level organizations, I’ve seen countless instances where a lack of strategy caused initiatives to fail or fizzle out.
In my latest webinar, I breakdown the key components engineering leaders need to consider when building an insights strategy.
Why a Strategy Matters
At the heart of every successful software engineering team is a drive for three things:
- A culture of continuous improvement
- The ability to move from idea to impact quickly, frequently, and with confidence
- A software organization delivering meaningful value
These goals sound simple enough, but in reality, achieving them requires more than just wishing for better performance. It takes data, action, and, most importantly, a cultural shift. And here's the catch: those three things don't come together by accident.
In my experience, whenever a large-scale change fails, there's one common denominator: a lack of a cohesive strategy. Every time I’ve witnessed a failed attempt at implementing new technology or making a big shift, the missing piece was always that strategic foundation. Without a clear, aligned strategy, you're not just wasting resources—you’re creating frustration across the entire organization.
Sign up for a free, expert-led insights strategy workshop for your enterprise org.
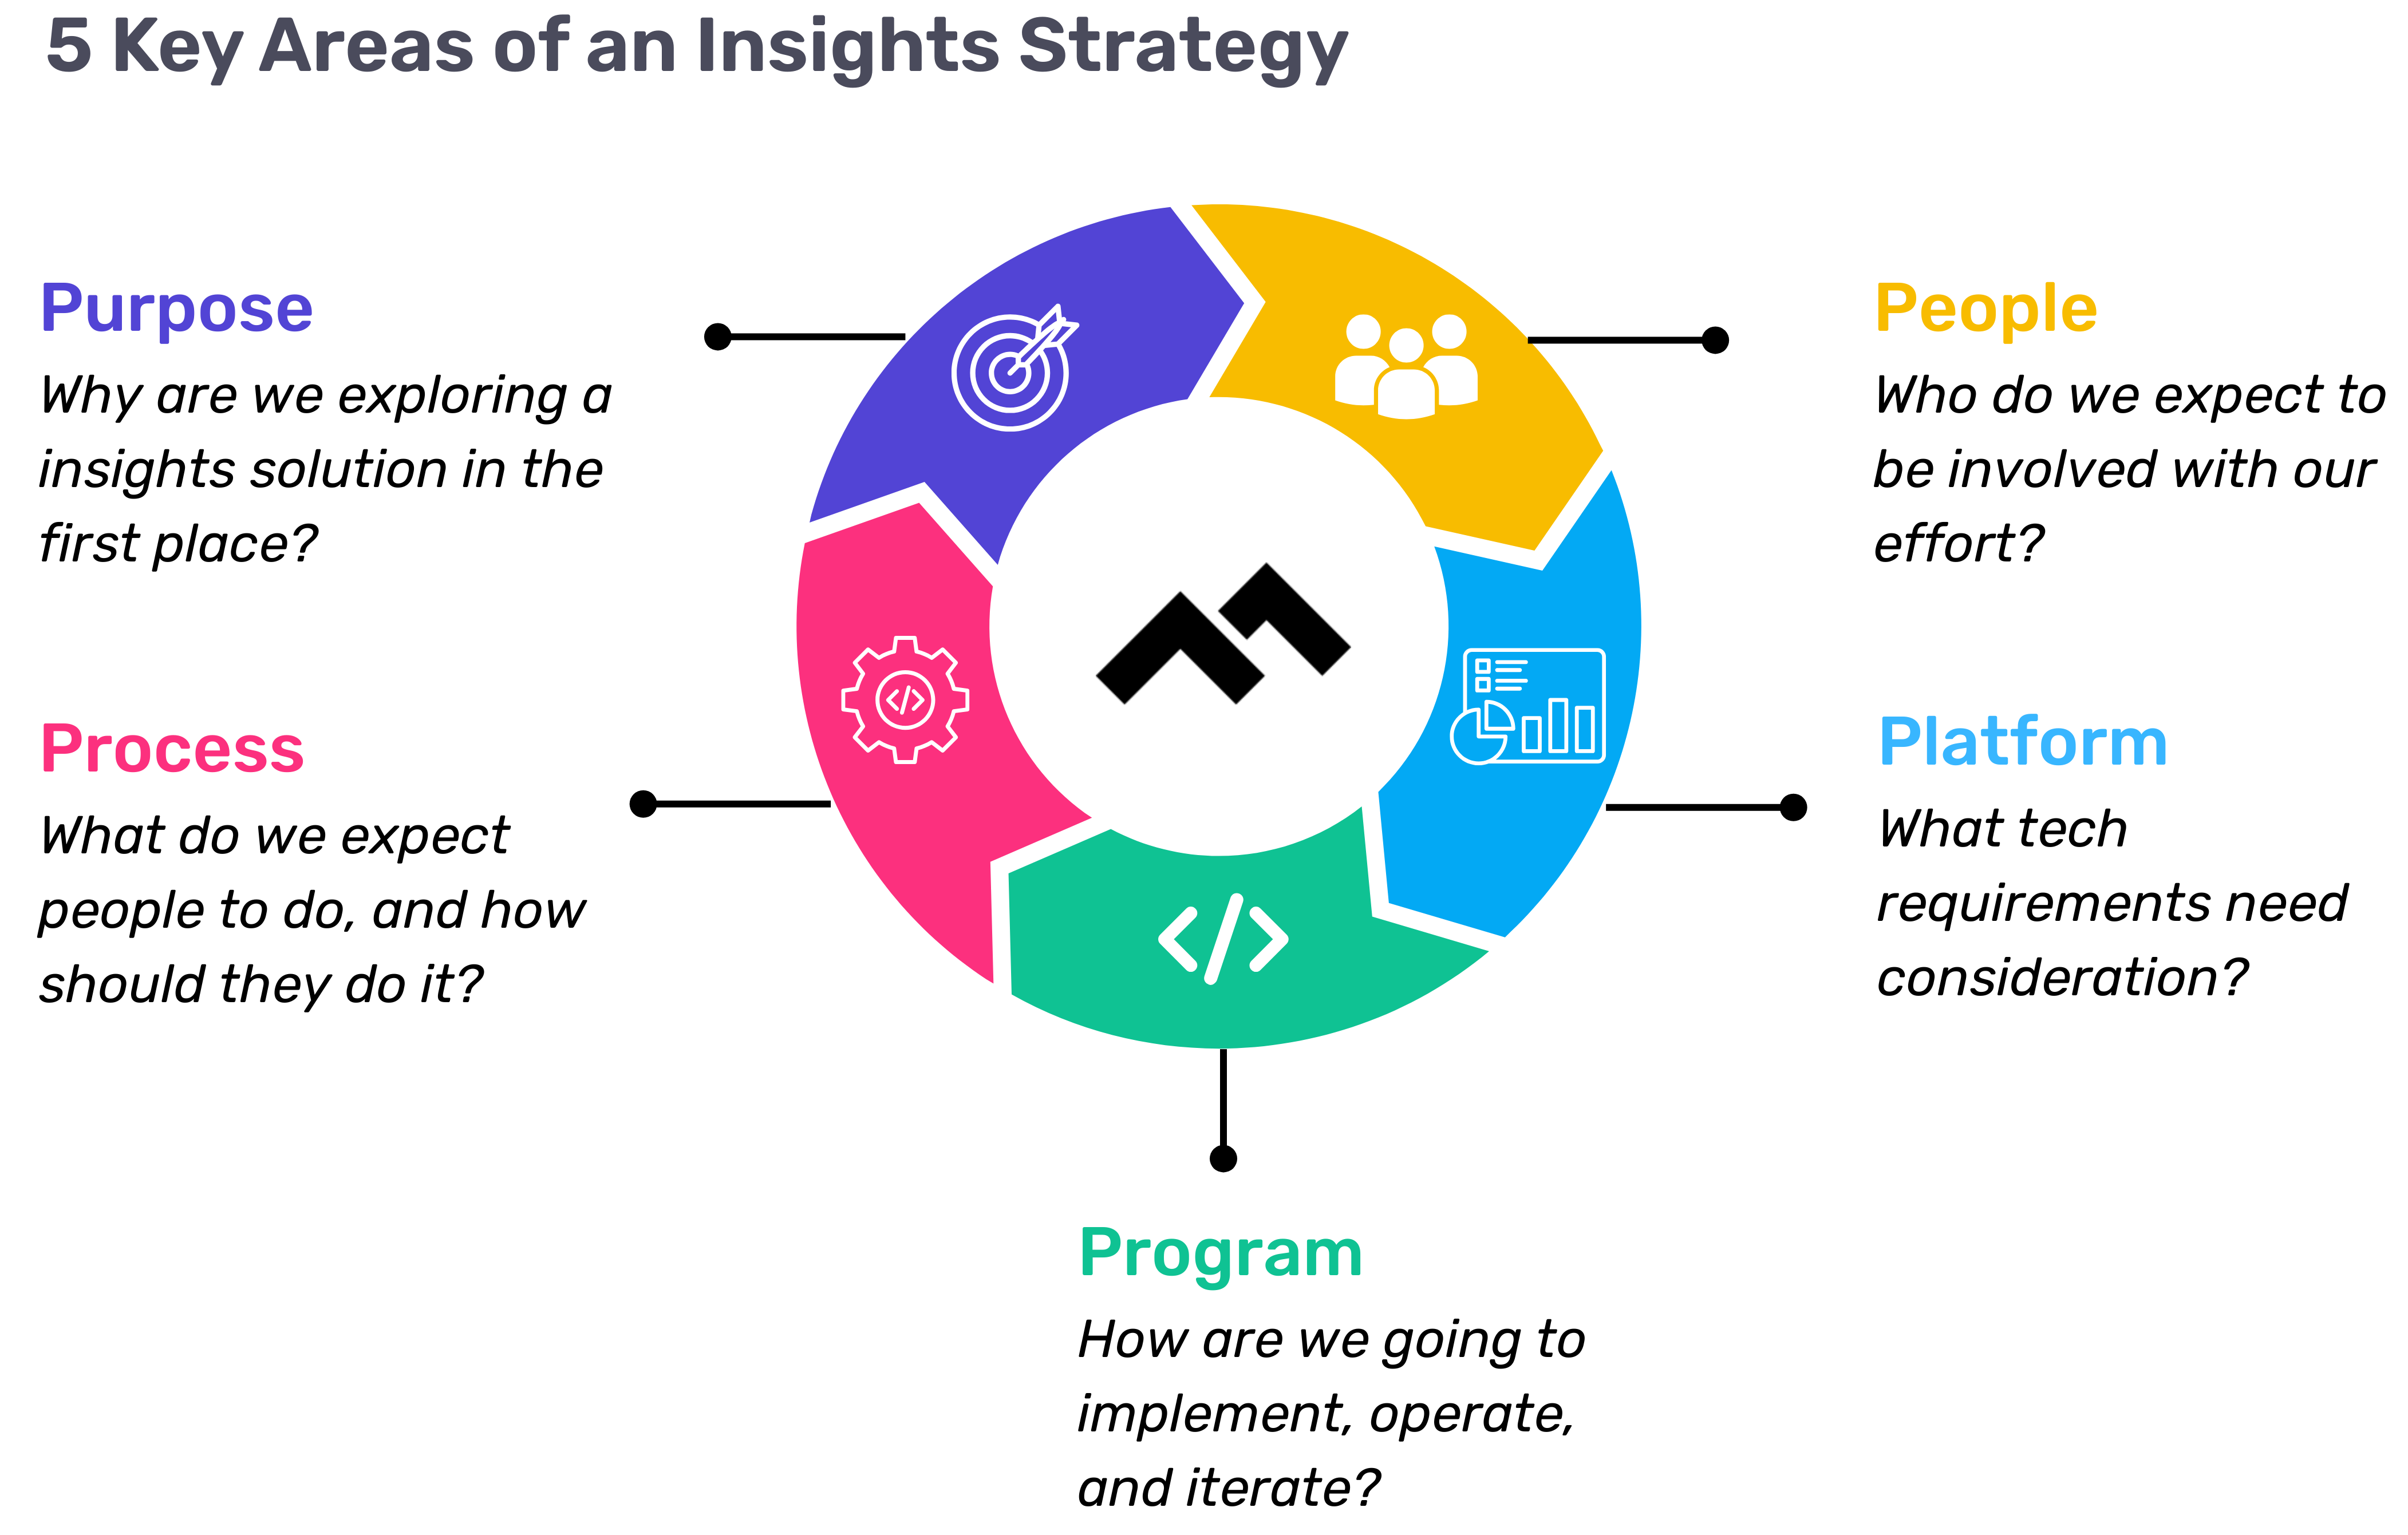
Step 1: Define Your Purpose
The first step in any successful engineering insights strategy is defining why you're doing this in the first place. If you're rolling out developer productivity metrics or an insights platform, you need to make sure there’s alignment on the purpose across the board.
Too often, organizations dive into this journey without answering the crucial question: Why do we need this data? If you ask five different leaders in your organization, are you going to get five answers, or will they all point to the same objective? If you can’t answer this clearly, you risk chasing a vague, unhelpful path.
One way I recommend approaching this is through the "Five Whys" technique. Ask why you're doing this, and then keep asking "why" until you get to the core of the problem. For example, if your initial answer is, “We need engineering metrics,” ask why. The next answer might be, “Because we're missing deliverables.” Keep going until you identify the true purpose behind the initiative. Understanding that purpose helps avoid unnecessary distractions and lets you focus on solving the real issue.
Step 2: Understand Your People
Once the purpose is clear, the next step is to think about who will be involved in this journey. You have to consider the following:
- Who will be using the developer productivity tool/insights platform?
- Are these hands-on developers or executives looking for high-level insights?
- Who else in the organization might need access to the data, like finance or operations teams?
It’s also crucial to account for organizational changes. Reorgs are common in the enterprise world, and as your organization evolves, so too must your insights platform. If the people responsible for the platform’s maintenance change, who will ensure the data remains relevant to the new structure? Too often, teams stop using insights platforms because the data no longer reflects the current state of the organization. You need to have the right people in place to ensure continuous alignment and relevance.
Step 3: Define Your Process
The next key component is process—a step that many organizations overlook. It's easy to say, "We have the data now," but then what happens? What do you expect people to do with the data once it’s available? And how do you track if those actions are leading to improvement?
A common mistake I see is organizations focusing on metrics without a clear action plan. Instead of just looking at a metric like PR cycle times, the goal should be to first identify the problem you're trying to solve. If the problem is poor code quality, then improving the review cycle times might help, but only because it’s part of a larger process of improving quality, not just for the sake of improving the metric.
It’s also essential to approach this with an experimentation mindset. For example, start by identifying an area for improvement, make a hypothesis about how to improve it, then test it and use engineering insights data to see if your hypothesis is correct. Starting with a metric and trying to manipulate it is a quick way to lose sight of your larger purpose.
Step 4: Program and Rollout Strategy
The next piece of the puzzle is your program and rollout strategy. It’s easy to roll out an engineering insights platform and expect people to just log in and start using it, but that’s not enough. You need to think about how you'll introduce this new tool to the various stakeholders across different teams and business units.
The key here is to design a value loop within a smaller team or department first. Get a team to go through the full cycle of seeing the insights, taking action, and then quantifying the impact of that action. Once you've done this on a smaller scale, you can share success stories and roll it out more broadly across the organization. It’s not about whether people are logging into the platform—it’s about whether they’re driving meaningful change based on the insights.
Step 5: Choose Your Platform Wisely
And finally, we come to the platform itself. It’s the shiny object that many organizations focus on first, but as I’ve said before, it’s the last piece of the puzzle, not the first. Engineering insights platforms like Code Climate are powerful tools, but they can’t solve the problem of a poorly defined strategy.
I’ve seen organizations spend months evaluating these platforms, only to realize they didn't even know what they needed. One company in the telecom industry realized that no available platform suited their needs, so they chose to build their own. The key takeaway here is that your platform should align with your strategy—not the other way around. You should understand your purpose, people, and process before you even begin evaluating platforms.
Looking Ahead
To build a successful engineering insights strategy, you need to go beyond just installing a tool. An insights platform can only work if it’s supported by a clear purpose, the right people, a well-defined process, and a program that rolls it out effectively. The combination of these elements will ensure that your insights platform isn’t just a dashboard—it becomes a powerful driver of change and improvement in your organization.
Remember, a successful software engineering insights strategy isn’t just about the tool. It’s about building a culture of data-driven decision-making, fostering continuous improvement, and aligning all your teams toward achieving business outcomes. When you get that right, the value of engineering insights becomes clear.
Want to build a tailored engineering insights strategy for your enterprise organization? Get expert recommendations at our free insights strategy workshop. Register here.Register here.
Andrew Gassen has guided Fortune 500 companies and large government agencies through complex digital transformations. He specializes in embedding data-driven, experiment-led approaches within enterprise environments, helping organizations build a culture of continuous improvement and thrive in a rapidly evolving world.
Navigating the world of software engineering or developer productivity insights can feel like trying to solve a complex puzzle, especially for large-scale organizations. It's one of those areas where having a cohesive strategy can make all the difference between success and frustration. Over the years, as I’ve worked with enterprise-level organizations, I’ve seen countless instances where a lack of strategy caused initiatives to fail or fizzle out.
In my latest webinar, I breakdown the key components engineering leaders need to consider when building an insights strategy.
Why a Strategy Matters
At the heart of every successful software engineering team is a drive for three things:
- A culture of continuous improvement
- The ability to move from idea to impact quickly, frequently, and with confidence
- A software organization delivering meaningful value
These goals sound simple enough, but in reality, achieving them requires more than just wishing for better performance. It takes data, action, and, most importantly, a cultural shift. And here's the catch: those three things don't come together by accident.
In my experience, whenever a large-scale change fails, there's one common denominator: a lack of a cohesive strategy. Every time I’ve witnessed a failed attempt at implementing new technology or making a big shift, the missing piece was always that strategic foundation. Without a clear, aligned strategy, you're not just wasting resources—you’re creating frustration across the entire organization.
Sign up for a free, expert-led insights strategy workshop for your enterprise org.
Step 1: Define Your Purpose
The first step in any successful engineering insights strategy is defining why you're doing this in the first place. If you're rolling out developer productivity metrics or an insights platform, you need to make sure there’s alignment on the purpose across the board.
Too often, organizations dive into this journey without answering the crucial question: Why do we need this data? If you ask five different leaders in your organization, are you going to get five answers, or will they all point to the same objective? If you can’t answer this clearly, you risk chasing a vague, unhelpful path.
One way I recommend approaching this is through the "Five Whys" technique. Ask why you're doing this, and then keep asking "why" until you get to the core of the problem. For example, if your initial answer is, “We need engineering metrics,” ask why. The next answer might be, “Because we're missing deliverables.” Keep going until you identify the true purpose behind the initiative. Understanding that purpose helps avoid unnecessary distractions and lets you focus on solving the real issue.
Step 2: Understand Your People
Once the purpose is clear, the next step is to think about who will be involved in this journey. You have to consider the following:
- Who will be using the developer productivity tool/insights platform?
- Are these hands-on developers or executives looking for high-level insights?
- Who else in the organization might need access to the data, like finance or operations teams?
It’s also crucial to account for organizational changes. Reorgs are common in the enterprise world, and as your organization evolves, so too must your insights platform. If the people responsible for the platform’s maintenance change, who will ensure the data remains relevant to the new structure? Too often, teams stop using insights platforms because the data no longer reflects the current state of the organization. You need to have the right people in place to ensure continuous alignment and relevance.
Step 3: Define Your Process
The next key component is process—a step that many organizations overlook. It's easy to say, "We have the data now," but then what happens? What do you expect people to do with the data once it’s available? And how do you track if those actions are leading to improvement?
A common mistake I see is organizations focusing on metrics without a clear action plan. Instead of just looking at a metric like PR cycle times, the goal should be to first identify the problem you're trying to solve. If the problem is poor code quality, then improving the review cycle times might help, but only because it’s part of a larger process of improving quality, not just for the sake of improving the metric.
It’s also essential to approach this with an experimentation mindset. For example, start by identifying an area for improvement, make a hypothesis about how to improve it, then test it and use engineering insights data to see if your hypothesis is correct. Starting with a metric and trying to manipulate it is a quick way to lose sight of your larger purpose.
Step 4: Program and Rollout Strategy
The next piece of the puzzle is your program and rollout strategy. It’s easy to roll out an engineering insights platform and expect people to just log in and start using it, but that’s not enough. You need to think about how you'll introduce this new tool to the various stakeholders across different teams and business units.
The key here is to design a value loop within a smaller team or department first. Get a team to go through the full cycle of seeing the insights, taking action, and then quantifying the impact of that action. Once you've done this on a smaller scale, you can share success stories and roll it out more broadly across the organization. It’s not about whether people are logging into the platform—it’s about whether they’re driving meaningful change based on the insights.
Step 5: Choose Your Platform Wisely
And finally, we come to the platform itself. It’s the shiny object that many organizations focus on first, but as I’ve said before, it’s the last piece of the puzzle, not the first. Engineering insights platforms like Code Climate are powerful tools, but they can’t solve the problem of a poorly defined strategy.
I’ve seen organizations spend months evaluating these platforms, only to realize they didn't even know what they needed. One company in the telecom industry realized that no available platform suited their needs, so they chose to build their own. The key takeaway here is that your platform should align with your strategy—not the other way around. You should understand your purpose, people, and process before you even begin evaluating platforms.
Looking Ahead
To build a successful engineering insights strategy, you need to go beyond just installing a tool. An insights platform can only work if it’s supported by a clear purpose, the right people, a well-defined process, and a program that rolls it out effectively. The combination of these elements will ensure that your insights platform isn’t just a dashboard—it becomes a powerful driver of change and improvement in your organization.
Remember, a successful software engineering insights strategy isn’t just about the tool. It’s about building a culture of data-driven decision-making, fostering continuous improvement, and aligning all your teams toward achieving business outcomes. When you get that right, the value of engineering insights becomes clear.
Want to build a tailored engineering insights strategy for your enterprise organization? Get expert recommendations at our free insights strategy workshop. Register here.Register here.
Andrew Gassen has guided Fortune 500 companies and large government agencies through complex digital transformations. He specializes in embedding data-driven, experiment-led approaches within enterprise environments, helping organizations build a culture of continuous improvement and thrive in a rapidly evolving world.
All Articles
On the quest to delight customers and deliver business value, LawnStarter is building a software engineering culture of continuous improvement.
The LawnStarter platform helps homeowners schedule outdoor services, from basic lawn care to landscaping, tree care, pest control, and more via their nationwide network of vetted professionals. The platform serves 120 markets in the United States. Having notched $27M in funding to date, the Austin-based startup, which recently acquired Lawn Love, is on a path of supercharged growth. Naturally, with growth comes challenges.
We sat down with LawnStarter’s VP of Engineering, Alberto Silveira, to chat about how they’re using Velocity to address some of the top challenges their engineering organization faces.
Building Both the Team and Culture of Continuous Improvement
In today’s race for tech talent, LawnStarter isn’t only concerned with hiring engineers as quickly as possible. They’re looking to do so while also improving code quality and team performance. With the engineering team set to grow by 50%-60% annually, Silveira needs deep visibility into engineering activities to help him identify opportunities to level up, which he’ll use to drive the culture toward continuous improvement.
Silveira is no stranger to the practices related to building high-performance teams. In fact, he’s written a book about it. In Building and Managing High Performance Distributed Teams, Silveira details a concept he calls “One Team, One Heart,” which he defines as “the synergy that comes from people feeling good about their place in a highly productive team.”
As he describes in the book: “We are one team, regardless how geographically far apart we are, no matter the person’s religion, skin color, nationality, gender orientation, or physical ability. If a person is a good fit, then the moment we connect as simply humans becomes the foundation of a high-performance team. This ability to connect as humans, to socially and emotionally fuel people’s individual desires to excel in their efforts – this is what I consider to be the true North Star of any business.”
With his compass set on that North Star, Silviera set out to identify measurement tools and metrics to start identifying tangible goals and measuring progress. His navigation led him to Velocity for Engineering Intelligence.
With full transparency into each team and individual’s work, Silveira can present detailed reports to executive stakeholders to demonstrate how building a culture of continuous improvement directly impacts business objectives and key results.
Helping Developers Improve with Data
With team success at the core of the business strategy, Silveira tapped Velocity to create a scorecard of engineering metrics that developers use to advance in their careers. Every engineer has full access to Velocity’s reports, dashboards, and modules to proactively monitor their progress within their teams and as individuals. Goals and engineering metrics correlating to the business “rocks” (OKRs) are proactively shared with LawnStarter’s executive leadership.
While the idea of a scorecard may ruffle some feathers among developers, here again, transparency is key – in both process and communications. Silveira stresses the importance of communicating the value and purpose of engineering metrics. As with any powerful tool, there’s a responsibility to ensure that it’s being used as intended. “If you don’t adopt the tool with the right mindset, people may not be seen through the correct lenses,” Silveira said.
The scorecard helps set clear expectations up front about how the team and individuals are improving. “By explaining each individual metric ahead of time, and how those metrics contribute to achieving major goals, people understand their roles more clearly and how they can improve by taking actions that will make all of us better at the end of the day – and it works.”
Key Metrics Help Focus Efforts
While the scorecard is updated as goals evolve, the most recent version tracks PR Throughput, Review Speed, Commit Volume, Weekly Coding Days, Time to Merge, and Unreviewed PRs. Cycle Time is also reported quarterly for the team. Silveira finds Velocity’s Compare module particularly useful to view all of these metrics in the same report by individual and team. That provides him visibility into what teams are working on and a means of visualizing patterns that indicate progress or potential areas for improvement.
LawnStarter chooses to focus on a few key metrics at one time, recognizing that it can be overwhelming to track too many metrics. Silveira adopted Velocity by first performing an analysis to determine the metrics most meaningful for LawnStarter to improve. He then presented these metrics to each team and individual, explaining how they can monitor their progress to hit milestones.
Data-Driven Insights Fuel the Culture of Continuous Improvement
One of the first goals established with Velocity was for each engineer to have at least 4 days a week writing code. Monitoring Velocity’s Weekly Coding Days metric helps the engineering leadership understand if engineers have the time necessary to focus on writing high quality code. As a result, leadership realized that engineers were spending too much time in meetings. By sharing these goals and observations, the teams were able to reorganize calendars, and eventually increase average Weekly Coding Days from 2 to a little over 4.
The insights from Weekly Coding Days also helped LawnStarter identify positions to fill and organizational improvements that allowed engineers to spend more time working in the code – aka, their happy place.
By analyzing PR Throughput, Silviera was able to identify imbalances on the team. For example, certain developers were frequently working outside of the main branch, tickets weren’t sliced evenly (pointing to a workload distribution issue), and there were domain knowledge gaps.
“Velocity helps me visualize engineering productivity data that leads me to identify opportunities to improve my teams and processes,” Silviera said. “It allows me to make data-driven decisions that give me the confidence I need to achieve business objectives more quickly and effectively.”
Another insight LawnStarter made with Velocity was that Commit Volume was low, with an average of 5 commits per week. Digging into the data more, they observed that Review Speed could be 30 hours at times, a result of large PRs. By sharing and setting goals around this data, they were able to increase Commit Volume and decrease Review Speed. This also proved to impact Defect Rate, demonstrating that the overall quality of the code was improved as a result.
With these insights and others from Velocity, LawnStarter was able to improve both Cycle Time and PR Throughput 38%, along with a 57% improvement in Time to First Review with nearly 100% of PRs being reviewed.
Silveira thinks about reviewing engineering metrics as similar to perusing the stock market: “You may not want to look at it every day. Instead, use the data to help you identify patterns that lead to improvements in your teams.”
Engaging Business Stakeholders
As an engineering leader, Silveira knows that when engineering work is sliced into small pieces, which he describes as “delightful pieces of carpaccio,” that work translates into delightful feature releases that customers love. When new features are released efficiently, the business as a whole benefits directly.
As the VP of Engineering, Silveira believes that an important part of his role is sharing Engineering Intelligence data and explaining why it’s important to both the executive team and the Board of Directors. A typical question that he fields from the board inquires about the percentage of investment that goes toward building new features, versus maintaining existing features through code maintenance. That data has a direct impact on financial planning, for example, with revenue recognition. Silveira uses this opportunity to explain how the business benefits when more time is invested in building the product (and building it well) – time spent on innovation – opposed to time spent on maintenance.
While he’s found that non-technical business stakeholders are interested in understanding engineering data, Silveira ensures that he’s always positioning them in relation to the company’s overarching objectives. With Engineering Intelligence data from Velocity, LawnStarter paints a picture of business success that stems from the hard work engineering teams perform every day when building a culture of continuous improvement.

Knowledge silos are more than just a frustration or an inconvenience — they’re a serious threat to productivity. Yet with a few tweaks to team processes, and a commitment to intentional communication, engineering leaders can break down existing knowledge silos, and make it less likely that new ones will form.
What are Knowledge Silos?
Knowledge silos are individuals or groups in possession of information that is not readily accessible to the rest of an organization. Sometimes knowledge silos are formed by the intentional withholding of information — an individual or team wants to be the go-to source for answers on a certain topic — but often they’re the result of workflows that fail to encourage collaboration and knowledge sharing. Generally, “knowledge silo” is not used to describe situations where the information in question is privileged or confidential, but rather, situations where sharing information would enable team members to work more efficiently or effectively.
What Do you Stand to Gain from Knowledge Sharing?
When engineers lack access to key information, they might end up spending time devising a new solution to a problem that has already been solved elsewhere in the codebase. Or, they may be forced to make assumptions, some of which will be incorrect, about how their work fits into the broader context of a feature or roadmap. When your team is solving the same problems over and over, or acting on incorrect assumptions, they’ll be less efficient, more frustrated, and more likely to perform unnecessary rework. In the more extreme cases, when knowledge only resides with one person on a team, that person’s absence can bring work to a standstill.
At Code Climate, an initiative to promote intentional knowledge sharing, including logging key decisions and documenting new tracks of work, helped boost throughput almost 70%. A broader study, GitHub’s 2021 State of the Octoverse, found that specific knowledge-sharing practices like creating and maintaining up-to-date, quality documentation, can increase developer productivity by 50%.
How Can you Break Down Knowledge Silos on Your Engineering Team?
Knowledge silos are a natural and expected part of any evolving organization, particularly as it scales, but there are process-level measures leaders can take to actively encourage knowledge sharing.
- Documentation – Though writing code may get all the glory, writing documentation is critical to the success of engineering projects. Documentation allows teams to share context and to align on everything from best practices to project specifications. When documentation isn’t written or maintained, information is harder to access. Engineers not only need to know who to ask about a particular feature or project, they also have to feel comfortable reaching out with their question.
- Pair Programming – Knowledge exchange is one of the most well-known benefits of pair programming. When two developers are working on the same piece of code, they’ll exchange context and perspectives to arrive at a shared solution. With pair programming, more junior team members will have the opportunity to ask questions; more senior team members can share wisdom culled from their own experiences; and team members with different specialties and skill sets can learn from each other.
- Code Review – While different organizations employ different best practices for Code Review, it is a fundamental opportunity for engineers to share knowledge and offer feedback to help improve each other’s work. If you’re using a Software Engineering Intelligence (SEI) solution like Code Climate, metrics like Review Speed and Review Influence can help provide a sense of whether engineers are prioritizing Code Reviews, whether reviewers are leaving impactful feedback or rubber-stamping code, and if PRs are evenly distributed among reviewers. If one reviewer is disproportionately commenting on certain kinds of PRs, or PRs associated with a particular area of the codebase, that could indicate a potential knowledge silo.
- Draft PRs – Designed to encourage collaboration, Draft PRs enable developers to signal to potential reviewers that code is a work in progress while still opening the door for feedback. This allows developers to gain perspective from teammates at the earliest stages while ensuring that work in progress code does not get merged or prematurely factor into any review metrics being tracked in an SEI platform.
By implementing processes that require communication and collaboration, teams can actively encourage information sharing, rather than leaving it up to chance. With more information exchanged, existing knowledge silos will break down, fewer new ones will form, and overall team productivity will get a boost.
To learn more about using an SEI platform to spot blockers like knowledge silos and improve engineering processes, request a consultation.

Ensuring that working at Code Climate is a rewarding experience is something we take really seriously, so we’re incredibly honored to be recognized in the Built In 2022 Best Places to Work in NYC Awards. Just announced last week, Code Climate earned a spot on the 50 Best Small Companies to Work for in NYC.
This year’s Best Places to Work Awards highlight employers that have created cultures supporting employees wherever they work. Award eligibility is based on a company’s compensation benefits and culture programs, including diversity, equity, and inclusion.
“This year saw a record number of entrants — and the past two years fundamentally changed what tech professionals want from work,” says Sheridan Orr, Chief Marketing Officer, Built In, in a press release. “These honorees have risen to the challenge, evolving to deliver employee experiences that provide the meaning and purpose today’s tech professionals seek.”
Don’t just take Built In’s word for it though. Here’s what a few of our team members have to say about why they like working at Code Climate.
Emily Fueger, Senior Support Specialist: “Code Climate has done a great job prioritizing active team communication and empathy for what’s happening in the world around us today. I’ve often caught myself saying, ‘Wow, we are so lucky.’ Remote-first policies for meetings and generous leave for testing and time off aren’t just empty words. They reflect our default culture with respect for the people that work here. The culture is incredibly vibrant at Code Climate. The people I work with are incredibly curious, smart, funny, and talented (lots of musicians, DJ’s, and crafters). They’re people that I’d want to know even if I didn’t work with them.”
Josh Bender, SMB Account Executive: “Working at Code Climate is an amazing experience because everyone is working daily to grow the company. We all have a vision of educating the world on Engineering Intelligence and improving the efficiency of software development teams. It’s a rewarding pursuit, and I am excited to see this growth continue!”
Sherianne Bolling, Sr. Corporate Account Executive: “At Code Climate you’re surrounded by colleagues that are both driven and forward-thinking. We have a strong collaborative culture that encourages diversity of thought. I love being able to have my voice heard while contributing to an innovative and fast-moving company.”
Glenn Rothwell, Director of Sales Development: “I love working at Code Climate because of the culture, which I would describe as autonomy with accountability. I have the freedom to experiment and try new things with my team, and I appreciate how data-driven we are when assessing the results. Also, the various departments — such as sales, marketing, and product — work together very closely and are not siloed like I’ve experienced at other companies. Top this off with how genuinely enthusiastic the team is about our product and company direction, and you have a great recipe for success.”
Code Climate has been on a tear the past year, after closing a $50 million Series C round of funding, more than doubling our revenue, and significantly growing our team across the board. In many ways, this is just the start as we continue to aggressively recruit top talent to join our awesome team.
With this team growth as backdrop, our CEO, Bryan Helmkamp, has expressed a deep commitment to investing in the people and culture we need to fuel the next generation of Engineering Intelligence.
Learn more about our company culture, and check out the 30-plus open positions we have today.

Technology leaders looking to drive high performance can support the evolution of their teams by creating a culture of feedback in their organization. Read on to find out why honest and constructive feedback is crucial to engineering success.
The Importance of Routine Feedback
Regular feedback on particular units of work, processes, and best practices can be an effective way to help ensure agile teams are aligned and that all requirements are understood and met.
Employees who receive regular feedback on their work feel more confident and secure in their positions because they understand what is expected of them and the role they play in the organizational structure. According to one report, only 43% of highly-engaged employees received feedback on a weekly basis, while an astonishing 98% said they fail to be engaged when managers give little to no feedback, showcasing how essential feedback is to the cohesiveness of teams.
Furthermore, a positive culture of feedback can enhance psychological safety on teams. When feedback is a fundamental part of a blameless team culture, team members understand that feedback is critical to growing as a team and achieving key goals, and will likely feel more secure in sharing ideas, acknowledging weaknesses, and asking for help.
How to Foster a Feedback-rich Culture
As an executive, it is important to lead by example, as your actions can serve as a benchmark for best practices to be followed throughout the organization.
Leverage the Power of 1:1’s
Regular check-ins can play an integral role in building a successful feedback culture. Providing dedicated time for managers and direct reports to discuss goals, share feedback, and more, 1:1’s are a great way to engage employees and build trust.
During your 1:1’s, you’ll have the opportunity to ask questions and make statements that:
- Build an interpersonal connection – “How are you and your family”
- Encourage collaboration – “What’s on your mind? Is there anything I can help you with that you may be stuck on?”
- Show recognition, appreciation, or provide coaching
Here at Code Climate, our executives and managers hold weekly 1:1’s with their direct reports to surface any process blockers, discuss ambitions, and generally catch up. We are committed to this practice as a way to foster safety, transparency, and cohesion within our organization. We aim to ensure that each team member understands how their work fits into larger company initiatives and feels secure enough to share ideas that enable us to continually innovate and improve.
Enhance Feedback with Engineering Data
The most effective feedback is specific and actionable, so it can be helpful to use engineering data to ground conversations in particular units of work. For example, if you have a question on a specific Pull Request, it can be helpful to surface detailed information on that particular PR to help you place progress in context and check any assumptions you may have. Objective data can also help you identify areas where coaching may be beneficial or showcase areas where you might not have known an IC was excelling. Furthermore, data can help you set and track progress towards goals, adding value and effectiveness to your feedback.
Feedback Goes Both Ways
A culture of feedback is most effective when it’s holistic, so it’s important to make sure you’re giving your team members the opportunity to impart their feedback on processes, workflow, expectations, and more. To help achieve this, you can provide your team members with a forum to share viewpoints during 1:1’s, standups, and retrospectives. In doing so, you regularly afford yourself the opportunity to actively listen to and learn from your team.
Feedback is an essential tool that helps leaders drive excellence on their teams. Remember:
- A culture of positive feedback helps create the ideal conditions for innovation
- 1:1’s can be a powerful way to build trust and create alignment
- Engineering data can help you place observations in context
- A true culture of feedback requires that team members are also empowered to speak up and offer their feedback
With a thoughtful approach, you can cultivate a safe and welcoming work environment that motivates teams to strive for excellence. To find out how to employ data-driven feedback in your organization, request a consultation.

The following is a guest post from LaunchDarkly, the first scalable feature management platform.
Working in a stressful deployment environment can hinder the speed and frequency of releases — and the innovation behind it all.
If you’re constantly worried or stressed about releases, you’re likely losing room for creativity and innovation. And sooner or later, it’s going to impact your products.
How Stress Affects Innovation (and Releases)
Worry and stress related to deployments are sometimes referred to as “deployment anxiety,” an emotional response that we at LaunchDarkly decided to examine more closely.
For Hyperdrive: A Continuous Delivery Report, we surveyed professionals on the current state of continuous delivery, digging into topics like the reasons for adopting CD, their teams’ utilization of automation in their processes, and the use of feature flags.
Continuous Delivery Reduces Deployment Anxiety
The findings highlighted a correlation between deployment anxiety and frequency of releases, although maybe not in the way you were expecting.
According to most respondents, production environments with lower release frequencies actually create more deployment anxiety. This can likely be attributed to the extra buildup of pressure and stress that accompanies releases that are infrequent but larger in overall scope.
On the other hand, developers who are continually pushing out deployments, sometimes multiple times per day, are far less likely to have deployment anxiety. It may sound counterintuitive, but continuous delivery generally results in less stress and fewer worries within a work environment.
If you’re releasing smaller releases at a more consistent pace, it’s a lot less stressful than trying to roll out a more substantial release, say, once per quarter. Smaller releases are also usually less risky, and easier to roll back if they cause issues.
Still, it’s impossible to achieve true continuous delivery without the right tools and processes.
How Feature Flags Can Help
In the Hyperdrive report, many respondents indicated their plan to implement feature flagging, which is a way to control which users can see a certain feature—enabling developers to selectively deploy code to specific users. Feature flags allow teams to mitigate risk by running canary tests, progressively delivering features, migrating to microservices, and tons more.
Respondents who currently use feature flags are much more likely to hold a positive view of their deployment process, while deployment anxiety is higher among the respondents who don’t use feature flags.
It’s safe to say there’s a connection.
The Value of a Solid Feature Management Platform
At LaunchDarkly, we love hearing from customers and developers on just how our platform affects their deployment processes and workflows. In one particular part of another recent report, The State of Feature Management (conducted in partnership with the independent firm, Wakefield Research), we surveyed hundreds of customers to gauge our platform’s impact on their processes.
Our research also included surveying hundreds of developers who used feature management solutions other than LaunchDarkly so we could have a realistic and honest comparison.
The results were clear: LaunchDarkly users are deploying more frequently and with less stress.
So, for those who want to deploy more frequently, reduce stress and anxiety around these deployments, and enable more room for innovation, a feature flag-based platform like LaunchDarkly is critical. Want to see for yourself what our platform can do for your development environments? Check out some of our customer case studies.
We’re introducing a new look for our Velocity navigation! The platform is growing, and we’ve redesigned the navigation to make it even easier to use Velocity to find the answers you’re looking for.
Things look a bit different, but don’t worry, all your favorite reports are still there (plus more!) — they’re just organized in a new way, around what you’re trying to use Velocity for.
Velocity’s all-new navigation now lives at the top of the page, organized into the following three categories:
Align — Create transparency that ensures your technical teams are in sync with product and business initiatives. Here you can find reports aimed at helping executives align on business priorities and ensure optimal resource allocation across teams.
You’ll be able to understand how your team’s productivity changes over time and visualize key metrics to uncover trends.
Deliver — Innovate faster than your competition by bringing new products and features to market, faster. These reports are designed to help engineering leadership deliver high-quality code quickly and consistently.
You can easily see what your team is working on (such as what pull requests have been recently edited) and understand how Code Review and PR Resolution are impacting your team’s delivery time.
Improve — Build a culture of excellence through objective metrics. Here you can find reports designed to help leadership and team managers improve team processes and skills to create a high-performance culture.
You can track how your team is progressing towards their goals and performing over time to help identify the best practices that make sense in your organization.
This is a fresh take on the same insightful Velocity reports you’ve been using. We’ll be rolling this out to all of our users by the end of January. Please reach out to support if you have any questions!
Velocity Navigation is Just the Latest in a String of New Product Features for 2022
The new Velocity navigation is the latest of several new product features. We kicked off 2022 with three other highly-requested features: pair programming support, draft PR support, and updated email and Slack PR links. Read more about these new features in our blog announcement, or here’s a quick summary:
Pair Programming – Those engineering teams, including ours, that use pair programming sessions to help increase efficiency, minimize errors, and engender a culture of collaboration and knowledge-sharing on their teams, can now find co-authorship data included in key metrics and reports.
Draft PRs – Draft PR support allows developers to push their work without unintentionally signaling to a manager that the PR is ready to be formally reviewed and/or shipped. Organizations can now customize when Velocity considers a PR to be Ready for Review.
PR Links – The PR links in Velocity’s e-mail and Slack alerts now route directly to your VCS, rather than Velocity (as they did before). This way, any user with access to the PR — even those without a Velocity seat — can act on e-mail and Slack alerts.
We’ve got a ton of new and exciting features on tap for 2022. Stay tuned for more updates that help maximize the data-driven insights you get from Velocity’s Engineering Intelligence.
On behalf of the Code Climate team — Happy New Year! We’re excited to kick off 2022 by announcing three brand new and highly-requested features:
- Pair programming support
- Draft PR support
- Updated e-mail and Slack PR links
Pair Programming Support
Many engineering teams, including ours, use pair programming sessions to help increase efficiency and minimize errors, all while engendering a culture of collaboration and knowledge-sharing on their teams.
Pairing creates an opportunity for more junior members of the team to ask questions like, “Why do we do this like that?”, or for more senior programmers to describe different implementation approaches they’ve tried and how they’ve worked out in the past. These discussions help close the experience gap and often lead to a new consensus about the preferred way of doing things.
To this end, we’re excited to announce that one of our most highly requested Velocity features — pair programming support — is now live!
What Does Pair Programming Support Look Like in Velocity?
Pair programming support manifests in three main ways in the platform.
First of all, every metric in the application that takes commit activity into account will now reflect pair programming data. For example, if Hermione (author) and Snape (co-author) write 302 lines of code in a pairing session, both of their PR size metrics will reflect this change. Previously, only Hermione’s PR size metric would be affected.
Secondly, co-authorship is now accounted for in the Team and Developer360 Activity tabs. Before, a purple commit bubble would only show up on Hermione’s line (if she was the author) and not on Snape’s (the co-author), even if they had been coding together. Now, the commit bubbles will show up on both axes of activity. It’s important to note that once the PR is opened, however, only the author’s PR metrics will be affected by future changes.
Finally, for all Velocity customers with integrated Jira instances, pair programming data will display in the Workstreams report when users hover over any commit activity that was co-authored (see below).
Note: If you’re an existing Velocity customer who onboarded before November 2020, your rep will reach out within the next few weeks to let you know when this feature is available.
Draft PR Support
Draft PRs make it possible for a developer to push his or her work as soon as possible, without unintentionally signaling to a manager that their work is ready to be formally reviewed and/or shipped.
Ever since GitHub launched this functionality in early 2019, Draft PRs have become an integral part of many engineering organizations’ workflows and a highly-requested Velocity feature.
What Does Draft PR Support Look Like in Velocity?
Organizations can now customize when a PR should be considered Ready for Review. There are three options:
- When a Pull Request Review is first requested
- When a Pull Request is created
- When a Pull Request is no longer marked as a draft
Once you’ve configured what your organization defines as ‘Ready for Review,’ all relevant Velocity metrics (Time to First Review, Review Speed, Time to Merge) will reflect this change.
You can also start the clock for the Waiting for Review risk alert by heading toSettings > Data > PR Risks and selecting your preference from the same dropdown menu.
We hope this new functionality will make it possible for developers to adhere to CI/CD best practices without pinging their teammates prematurely.
Note: Draft PR functionality is only available for GitHub users.
Updated E-mail and Slack PR Links
Finally, we’ve updated the PR link settings in our e-mail and Slack alerts to route directly to your VCS and not to Velocity (as they did before).
This way, any user with access to the PR — even those without a Velocity seat — can act upon e-mail and Slack alerts.
Get Started
Velocity’s come a long way in a year, and we’re looking forward to delivering many more highly-requested features in 2022.
In the meantime, users can configure their Pair Programming and Draft PR Settings at the respective links, and as always, reach out to our support team if you have any questions.
As part of our ongoing series on data-driven performance reviews, Code Climate Founder and CEO, Bryan Helmkamp, sat down with Katie Wilde, VP of Engineering at Ambassador Labs, and Smruti Patel, Head of Engineering, LEAP & Data Platform, at Stripe to discuss the intricacies of performance reviews and how to best conduct them with the help of objective data. Read on to learn how leveraging objective data in your reviews can improve retention, mitigate bias, and positively impact developer confidence. To see the conversation in full, check out the recording here.
Performance Reviews – Intended and Ancillary Benefits
Objective data can assist in conducting fair and equitable performance reviews that help to improve retention and save organizations the added expense of sourcing and hiring new talent.
“Engineering hiring right now is extremely difficult, and what would be really great is if you didn’t have to backfill roles on your team. If you manage to retain people, that’s way better than having to hire a bunch of new folks,” Katie says, adding “[Performance reviews] are extremely important for cultivating and retaining our top people and that’s a different ‘why’ to the kind of thing people think of with performance reviews… yeah, sometimes we need to fire people for not doing a good job, but it’s actually far more important to make sure that the people that are doing a fantastic job don’t leave.”
To Katie’s point — a survey conducted by LinkedIn reports that, depending on the role, it can take the average organization over 40 days to fill a technical position, while the US Bureau of Labor Statistics projects that the demand for software engineers will grow 22% over the next decade, signaling hiring challenges to come in the space.
Echoing Katie’s sentiment, Smruti adds “[Data-driven performance reviews] are key for supporting your high performers who want a formal way of [understanding], what does the next year look like? Or what does the next part of the journey look like? And so for me, this process, at the very least, provides missing data where a manager or organization might not even be aware of all the things that [a developer] is involved in, or the initiatives that they’ve led and delivered.”
Using Objective Data to Combat Biases
Biases are a noted flaw of performance reviews, and a great way to mitigate those prejudices is to check assumptions against objective data.
Katie has seen firsthand the inequities gender bias in particular can cause. In one instance, when it came time to review a female engineer, Katie noticed inconsistencies between the engineer’s self-review and her peer reviews. While the engineer had given herself a strong rating, her peers stated that her work pace was a little slow. Katie decided to dig deeper and determine the cause of this discrepancy: had the engineer overstated her own abilities, or were her peers being overly critical?
Using Code Climate, Katie dug into the engineer’s work and discovered that her PRs were in fact moving more slowly through the development pipeline, but not for the reason one might expect. Her PRs were getting held up in code review by change requests, and the requests were often for minor, stylistic changes. Further investigation revealed that requests of this kind were not common across the team, and PRs written by male engineers tended to be approved quickly, without getting stuck in a similar feedback loop. With this information, Katie was able to check her assumptions, calibrate her feedback, and uncover bias in both the review process and the team’s day-to-day work.
Reflecting on the experience, Katie says “So that review cycle for that entire team went a completely different way than if I hadn’t used data. [Without objective data] I absolutely would have done the review of, give all the men great reviews, tell the woman she needs to be more productive and get her act together, that she’s got some decent skills, but she’s got to do a better job, not promote her, and carry on. It’s just quite eye-opening. I am a woman in engineering. I know how hard it is. So yeah, that’s a case where I’m just very grateful to have had that data.”
Articulating Impact with Engineering Data
Many times during the performance review process, ICs are asked to conduct a self-evaluation. This portion of the review process surfaces an opportunity for ICs to share their perspectives on their own performance, actions, and choices. It also helps managers understand how ICs view themselves in relation to their team and the company as a whole.
Citing personal experience, Smruti observed that ICs can be so focused on what they’ve built and delivered, that they often fail to see why their work mattered and the impact it had on the organization. She noticed that this lack of self-advocacy rang especially true for underrepresented minorities. To combat this, Smruti uses data to link individual achievements to verifiable facts to help ICs break the glass ceiling of self-perception.
“So for me, when it comes down to quantifiable or qualitative data, it comes down to finding the right engineering data that best articulates that impact to the team on business goals. So if you think about it, you can use a very irrefutable factor, say, ‘I shipped X, which reduced the end-to-end API latency from 4 or 5 seconds to 2.5 seconds. And this is how it impacted the business.’”
In using objective data, ICs are able to see the impact their work has on their organization, and advocate for themselves to secure promotions and higher salaries.
The Annual Performance Review Process, Optimized
With Engineering Intelligence data at their fingertips, leaders can develop a review approach that places quantitative and qualitative data into context to deliver meaningful and actionable feedback that promotes the well-being of ICs and the growth of their teams.
Speak to a Code Climate expert and see for yourself how data can help you conduct more effective annual performance reviews and drive engineering excellence.
Standups are a cornerstone of the Agile process and an essential ceremony in many engineering organizations. A great way to facilitate knowledge sharing, team cohesion, collaboration, and more, standups can help keep projects on track and clear of roadblocks. However, standups as we know them are in need of some TLC. When you meet with your team every day and ask the same questions, it can get monotonous, and engagement may be lackluster.
To step up your team’s standups, you’ll need to move beyond the typical standup questions. A Software Engineering Intelligence (SEI) platform like Code Climate can help you do that, making it possible to get your status updates before standup, so you can spend the meeting digging into at-risk work, addressing potential blockers, and helping to drive work forward. Code Climate aggregates data from DevOps and project management tools, acting as a single pane of glass for engineering managers to gain visibility into their team’s sprints and help them better prepare for the day ahead.
Without the help of an SEI platform, your standup likely looks something like this:
Engineering Manager to Dev: What will you do today?
Dev: Today I’m finishing up the Health Check feature. Dev2 had been working on it all week, but they passed it on to me before taking their vacation. Should have everything I need.
Engineering Manager: Great, let me know if there’s anything you’re missing.
Short and perfunctory, this conversation only skimmed the surface.
With the help of a Software Engineering Intelligence (SEI) solution, an engineering manager can more clearly identify at-risk work and potential blockers before standup, so they know exactly what to ask to get past surface-level updates. That means standup can look more like this:
Dev: Today I’m finishing up the Health Check feature. Dev2 had been working on it all week, but they passed it on to me before taking their vacation. Should have everything I need.
Engineering Manager: Ok, I also see there were multiple discussions on the feature that required you to make a change in the code two weeks ago. Did the requirements change?
Dev: Actually, there have been bugs reported so I am adjusting my approach.
Engineering Manager: Ok, let’s grab some time this morning to walk through your approach step-by-step as this has been a tricky part of the codebase.
Because the manager came to standup with context on the PR in question, they were able to dig deeper and ask questions that uncovered potential risks. Both parties were then able to walk away from standup with clear objectives and next steps to keep the sprint healthy and on track.
There are many ways to structure standups, but one fact always rings true — the more prepared you are walking into standup, the more effective your meeting will be. Request a consultation to learn more.