Resources & Insights
Featured Article
Navigating the world of software engineering or developer productivity insights can feel like trying to solve a complex puzzle, especially for large-scale organizations. It's one of those areas where having a cohesive strategy can make all the difference between success and frustration. Over the years, as I’ve worked with enterprise-level organizations, I’ve seen countless instances where a lack of strategy caused initiatives to fail or fizzle out.
In my latest webinar, I breakdown the key components engineering leaders need to consider when building an insights strategy.
Why a Strategy Matters
At the heart of every successful software engineering team is a drive for three things:
- A culture of continuous improvement
- The ability to move from idea to impact quickly, frequently, and with confidence
- A software organization delivering meaningful value
These goals sound simple enough, but in reality, achieving them requires more than just wishing for better performance. It takes data, action, and, most importantly, a cultural shift. And here's the catch: those three things don't come together by accident.
In my experience, whenever a large-scale change fails, there's one common denominator: a lack of a cohesive strategy. Every time I’ve witnessed a failed attempt at implementing new technology or making a big shift, the missing piece was always that strategic foundation. Without a clear, aligned strategy, you're not just wasting resources—you’re creating frustration across the entire organization.
Sign up for a free, expert-led insights strategy workshop for your enterprise org.
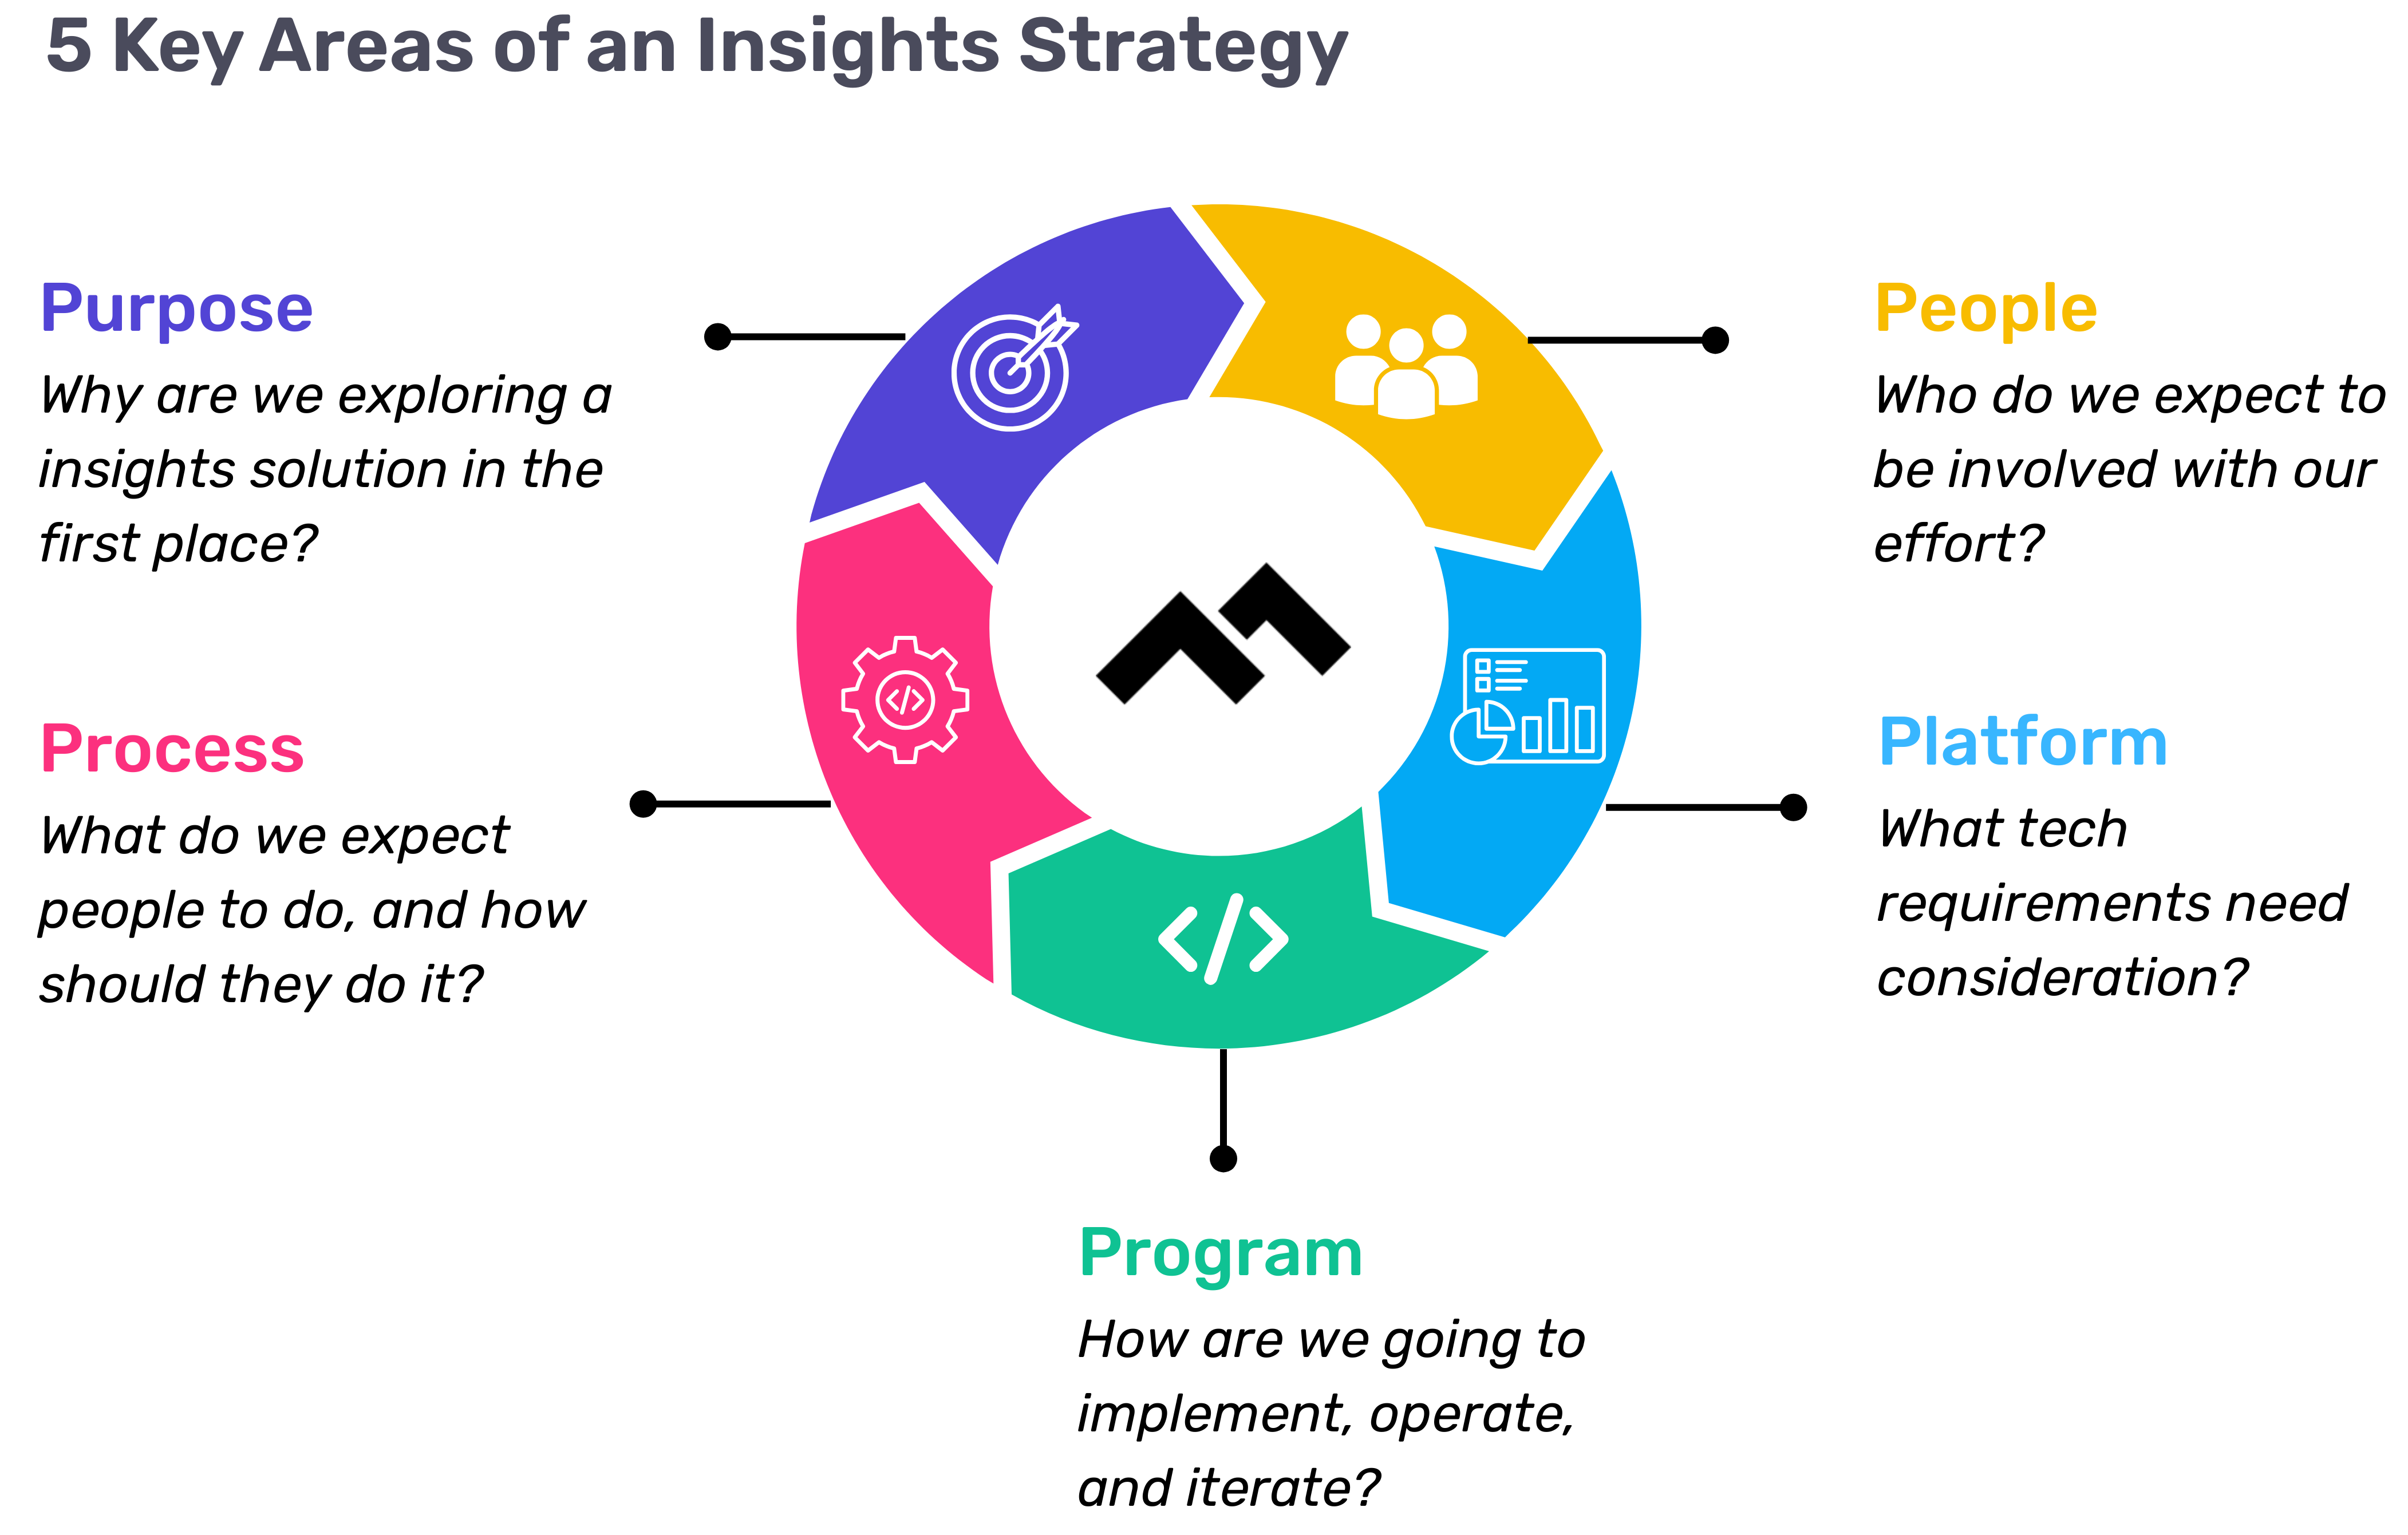
Step 1: Define Your Purpose
The first step in any successful engineering insights strategy is defining why you're doing this in the first place. If you're rolling out developer productivity metrics or an insights platform, you need to make sure there’s alignment on the purpose across the board.
Too often, organizations dive into this journey without answering the crucial question: Why do we need this data? If you ask five different leaders in your organization, are you going to get five answers, or will they all point to the same objective? If you can’t answer this clearly, you risk chasing a vague, unhelpful path.
One way I recommend approaching this is through the "Five Whys" technique. Ask why you're doing this, and then keep asking "why" until you get to the core of the problem. For example, if your initial answer is, “We need engineering metrics,” ask why. The next answer might be, “Because we're missing deliverables.” Keep going until you identify the true purpose behind the initiative. Understanding that purpose helps avoid unnecessary distractions and lets you focus on solving the real issue.
Step 2: Understand Your People
Once the purpose is clear, the next step is to think about who will be involved in this journey. You have to consider the following:
- Who will be using the developer productivity tool/insights platform?
- Are these hands-on developers or executives looking for high-level insights?
- Who else in the organization might need access to the data, like finance or operations teams?
It’s also crucial to account for organizational changes. Reorgs are common in the enterprise world, and as your organization evolves, so too must your insights platform. If the people responsible for the platform’s maintenance change, who will ensure the data remains relevant to the new structure? Too often, teams stop using insights platforms because the data no longer reflects the current state of the organization. You need to have the right people in place to ensure continuous alignment and relevance.
Step 3: Define Your Process
The next key component is process—a step that many organizations overlook. It's easy to say, "We have the data now," but then what happens? What do you expect people to do with the data once it’s available? And how do you track if those actions are leading to improvement?
A common mistake I see is organizations focusing on metrics without a clear action plan. Instead of just looking at a metric like PR cycle times, the goal should be to first identify the problem you're trying to solve. If the problem is poor code quality, then improving the review cycle times might help, but only because it’s part of a larger process of improving quality, not just for the sake of improving the metric.
It’s also essential to approach this with an experimentation mindset. For example, start by identifying an area for improvement, make a hypothesis about how to improve it, then test it and use engineering insights data to see if your hypothesis is correct. Starting with a metric and trying to manipulate it is a quick way to lose sight of your larger purpose.
Step 4: Program and Rollout Strategy
The next piece of the puzzle is your program and rollout strategy. It’s easy to roll out an engineering insights platform and expect people to just log in and start using it, but that’s not enough. You need to think about how you'll introduce this new tool to the various stakeholders across different teams and business units.
The key here is to design a value loop within a smaller team or department first. Get a team to go through the full cycle of seeing the insights, taking action, and then quantifying the impact of that action. Once you've done this on a smaller scale, you can share success stories and roll it out more broadly across the organization. It’s not about whether people are logging into the platform—it’s about whether they’re driving meaningful change based on the insights.
Step 5: Choose Your Platform Wisely
And finally, we come to the platform itself. It’s the shiny object that many organizations focus on first, but as I’ve said before, it’s the last piece of the puzzle, not the first. Engineering insights platforms like Code Climate are powerful tools, but they can’t solve the problem of a poorly defined strategy.
I’ve seen organizations spend months evaluating these platforms, only to realize they didn't even know what they needed. One company in the telecom industry realized that no available platform suited their needs, so they chose to build their own. The key takeaway here is that your platform should align with your strategy—not the other way around. You should understand your purpose, people, and process before you even begin evaluating platforms.
Looking Ahead
To build a successful engineering insights strategy, you need to go beyond just installing a tool. An insights platform can only work if it’s supported by a clear purpose, the right people, a well-defined process, and a program that rolls it out effectively. The combination of these elements will ensure that your insights platform isn’t just a dashboard—it becomes a powerful driver of change and improvement in your organization.
Remember, a successful software engineering insights strategy isn’t just about the tool. It’s about building a culture of data-driven decision-making, fostering continuous improvement, and aligning all your teams toward achieving business outcomes. When you get that right, the value of engineering insights becomes clear.
Want to build a tailored engineering insights strategy for your enterprise organization? Get expert recommendations at our free insights strategy workshop. Register here.Register here.
Andrew Gassen has guided Fortune 500 companies and large government agencies through complex digital transformations. He specializes in embedding data-driven, experiment-led approaches within enterprise environments, helping organizations build a culture of continuous improvement and thrive in a rapidly evolving world.
Navigating the world of software engineering or developer productivity insights can feel like trying to solve a complex puzzle, especially for large-scale organizations. It's one of those areas where having a cohesive strategy can make all the difference between success and frustration. Over the years, as I’ve worked with enterprise-level organizations, I’ve seen countless instances where a lack of strategy caused initiatives to fail or fizzle out.
In my latest webinar, I breakdown the key components engineering leaders need to consider when building an insights strategy.
Why a Strategy Matters
At the heart of every successful software engineering team is a drive for three things:
- A culture of continuous improvement
- The ability to move from idea to impact quickly, frequently, and with confidence
- A software organization delivering meaningful value
These goals sound simple enough, but in reality, achieving them requires more than just wishing for better performance. It takes data, action, and, most importantly, a cultural shift. And here's the catch: those three things don't come together by accident.
In my experience, whenever a large-scale change fails, there's one common denominator: a lack of a cohesive strategy. Every time I’ve witnessed a failed attempt at implementing new technology or making a big shift, the missing piece was always that strategic foundation. Without a clear, aligned strategy, you're not just wasting resources—you’re creating frustration across the entire organization.
Sign up for a free, expert-led insights strategy workshop for your enterprise org.
Step 1: Define Your Purpose
The first step in any successful engineering insights strategy is defining why you're doing this in the first place. If you're rolling out developer productivity metrics or an insights platform, you need to make sure there’s alignment on the purpose across the board.
Too often, organizations dive into this journey without answering the crucial question: Why do we need this data? If you ask five different leaders in your organization, are you going to get five answers, or will they all point to the same objective? If you can’t answer this clearly, you risk chasing a vague, unhelpful path.
One way I recommend approaching this is through the "Five Whys" technique. Ask why you're doing this, and then keep asking "why" until you get to the core of the problem. For example, if your initial answer is, “We need engineering metrics,” ask why. The next answer might be, “Because we're missing deliverables.” Keep going until you identify the true purpose behind the initiative. Understanding that purpose helps avoid unnecessary distractions and lets you focus on solving the real issue.
Step 2: Understand Your People
Once the purpose is clear, the next step is to think about who will be involved in this journey. You have to consider the following:
- Who will be using the developer productivity tool/insights platform?
- Are these hands-on developers or executives looking for high-level insights?
- Who else in the organization might need access to the data, like finance or operations teams?
It’s also crucial to account for organizational changes. Reorgs are common in the enterprise world, and as your organization evolves, so too must your insights platform. If the people responsible for the platform’s maintenance change, who will ensure the data remains relevant to the new structure? Too often, teams stop using insights platforms because the data no longer reflects the current state of the organization. You need to have the right people in place to ensure continuous alignment and relevance.
Step 3: Define Your Process
The next key component is process—a step that many organizations overlook. It's easy to say, "We have the data now," but then what happens? What do you expect people to do with the data once it’s available? And how do you track if those actions are leading to improvement?
A common mistake I see is organizations focusing on metrics without a clear action plan. Instead of just looking at a metric like PR cycle times, the goal should be to first identify the problem you're trying to solve. If the problem is poor code quality, then improving the review cycle times might help, but only because it’s part of a larger process of improving quality, not just for the sake of improving the metric.
It’s also essential to approach this with an experimentation mindset. For example, start by identifying an area for improvement, make a hypothesis about how to improve it, then test it and use engineering insights data to see if your hypothesis is correct. Starting with a metric and trying to manipulate it is a quick way to lose sight of your larger purpose.
Step 4: Program and Rollout Strategy
The next piece of the puzzle is your program and rollout strategy. It’s easy to roll out an engineering insights platform and expect people to just log in and start using it, but that’s not enough. You need to think about how you'll introduce this new tool to the various stakeholders across different teams and business units.
The key here is to design a value loop within a smaller team or department first. Get a team to go through the full cycle of seeing the insights, taking action, and then quantifying the impact of that action. Once you've done this on a smaller scale, you can share success stories and roll it out more broadly across the organization. It’s not about whether people are logging into the platform—it’s about whether they’re driving meaningful change based on the insights.
Step 5: Choose Your Platform Wisely
And finally, we come to the platform itself. It’s the shiny object that many organizations focus on first, but as I’ve said before, it’s the last piece of the puzzle, not the first. Engineering insights platforms like Code Climate are powerful tools, but they can’t solve the problem of a poorly defined strategy.
I’ve seen organizations spend months evaluating these platforms, only to realize they didn't even know what they needed. One company in the telecom industry realized that no available platform suited their needs, so they chose to build their own. The key takeaway here is that your platform should align with your strategy—not the other way around. You should understand your purpose, people, and process before you even begin evaluating platforms.
Looking Ahead
To build a successful engineering insights strategy, you need to go beyond just installing a tool. An insights platform can only work if it’s supported by a clear purpose, the right people, a well-defined process, and a program that rolls it out effectively. The combination of these elements will ensure that your insights platform isn’t just a dashboard—it becomes a powerful driver of change and improvement in your organization.
Remember, a successful software engineering insights strategy isn’t just about the tool. It’s about building a culture of data-driven decision-making, fostering continuous improvement, and aligning all your teams toward achieving business outcomes. When you get that right, the value of engineering insights becomes clear.
Want to build a tailored engineering insights strategy for your enterprise organization? Get expert recommendations at our free insights strategy workshop. Register here.Register here.
Andrew Gassen has guided Fortune 500 companies and large government agencies through complex digital transformations. He specializes in embedding data-driven, experiment-led approaches within enterprise environments, helping organizations build a culture of continuous improvement and thrive in a rapidly evolving world.
All Articles
Faire is a fast-growing online wholesale marketplace connecting independent retailers and emerging brands worldwide. Since launching in 2017, the company now supports 100,000 brands and 700,000 retailers across 50,000 cities. Reaching this point of scale in just a few years required aggressive yet mindful growth within engineering. During this period, Faire leadership relied on Code Climate Velocity to provide critical visibility into team performance to ensure they could predictably deliver on objectives while continually onboarding new engineers.
The power of engineering data
Paul Poppert, head of engineering at Faire, is a huge believer in the power of data.
“If you want to understand the evolution of anything — from personal finances to health and fitness to organizational excellence — you need a way to collect data around the activity and find the signals within that data,” he said.
Visibility into engineering processes — and the ability to capture signals from engineering data — has been critical to the evolution of Faire’s engineering team, which has grown 18x since Poppert assumed his role in 2019. Before selecting Code Climate Velocity, he and his team tried using a few competitive and home-grown tools, but these proved difficult to integrate, time-consuming to manage, and lacking in capabilities. It was a massive distraction from high-value work.
“I was trying to onboard new managers that didn't understand how you use these tools, and we were just too busy for that. And so that's when we decided we needed a more advanced platform and wanted to partner with a company where it would be a healthy business relationship. We investigated multiple companies, and Code Climate was the best fit.”
Faire onboarded with Code Climate when it was on the cusp of massive company growth. In the two years since, the team has grown from 100 to 360 engineers, and visibility into performance has enabled Poppert to keep teams working predictably toward business outcomes. For example, as Faire was onboarding large cohorts, he used Velocity to understand how this impacted overall output and execution, so he could prepare for onboarding future groups. They could adjust workloads and commitments, and reallocate time to getting new team members up to speed, knowing it would benefit their output in the long run.
“We were able to invest a ton in bringing new engineers up to speed, nurturing them, and pairing them with more senior engineers,” Poppert explained. “We could do this with the visibility we had from Velocity because we could set realistic expectations, and knew we would see the rebound in execution when these investments started to pay off. And we absolutely did.”
Though Poppert was already happy with the teams’ output, now his teams are hitting record output levels per person because they were able to manage onboarding mindfully. And with Velocity, he has the data to show company leadership and peers his team’s value stream. Within the last year, PR Throughput has increased by 60% and Push Count has increased by 65%.
Velocity powers engineering excellence
When it comes to metrics, Poppert said he focuses less on goal setting and more on using metrics to understand what is happening within his engineering organization, which is made up of five teams — four product and one platform team. He can look at metrics like PR per contributor, PR Throughput, Cycle Time, or Time to First Review and compare between teams or over time to identify changes that might signal problems to be addressed. He noted, however, that the platform team’s work differs significantly from a product team’s. So, naturally, metrics do as well, with much lower active coding days yet higher PRs per contributor based on the type of work they are responsible for.
Engineering leaders at Faire also use Velocity as a way to foster a healthy culture. For instance, the Team360 view offers insight into how and when teams work, which is a valuable tool for managers to spot early warning signs of burnout and adjust workloads accordingly. The calendar view can show when teams may have more unplanned work or when engineers work at night and on weekends, which can be discussed in retros with the team.
Velocity also reveals important insights about performance indicators, which help managers to guide individual and team growth. The platform can help leaders identify high performers who may be prolific contributors, or those who can quickly and easily adapt to changes in project requirements. It can also identify the team players doing frequent Code Reviews and mentoring other engineers, and even shine a light on team members who may be struggling so managers can get them support before a problem occurs.
“If you have a large team, you cannot always trust personal perceptions or status reports, which can be subjective,” Poppert said. “You need real visibility into what is happening in your engineering organization. Code Climate Velocity gives us that.”
Is your engineering team growing quickly? Learn how Velocity can help your engineering organization gain critical visibility when you need it most. Speak with a product specialist.
What is engineering team health?
Maximizing engineering team health is critical to the success of the business, and there is a strong correlation between healthy teams and productivity. Team health in engineering is determined by a variety of factors including:
- A belief that work is meaningful, evenly distributed, and not wasted
- Strong team collaboration
- Psychological safety
- Alignment on priorities
- Managers’ support of individual and team development
To improve team health and maximize the engineering teams’ impact on the business, engineering leaders need visibility into key stages of the engineering process and the factors, above, that determine team health.
As part of our survey in collaboration with CTO Connection, we asked more than 200 engineering leaders what areas of team health and performance they are most interested in gaining visibility into.
Here’s a breakdown of those responses:
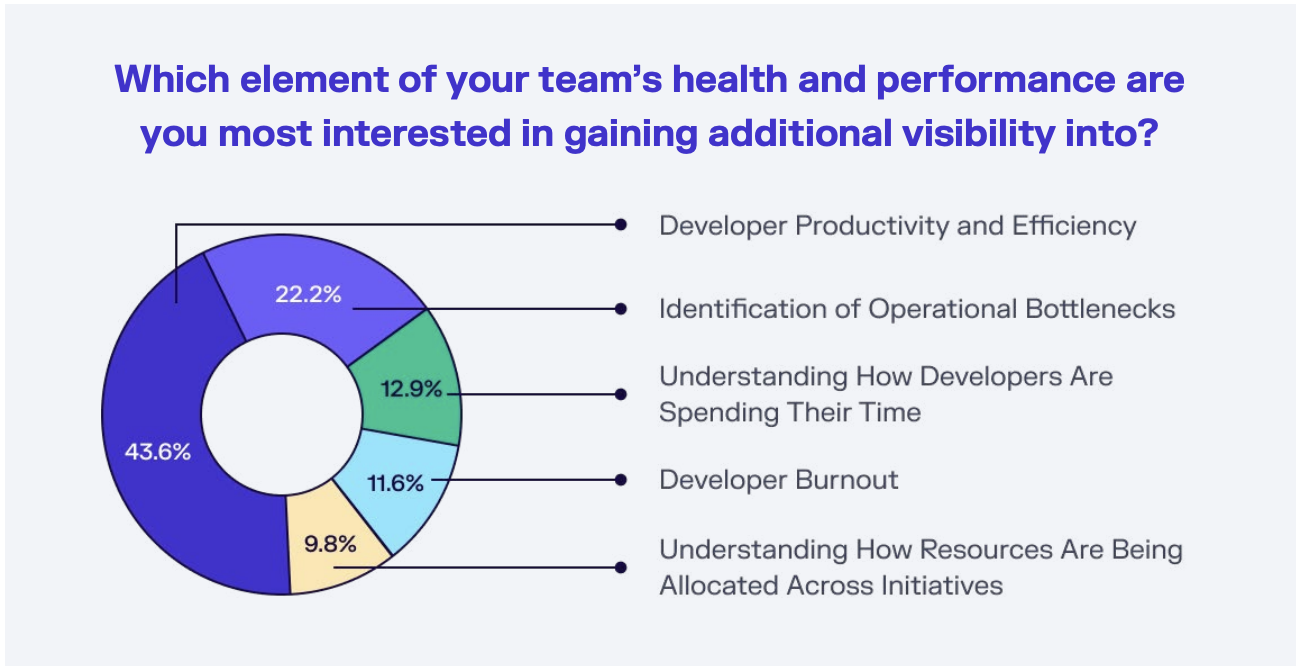
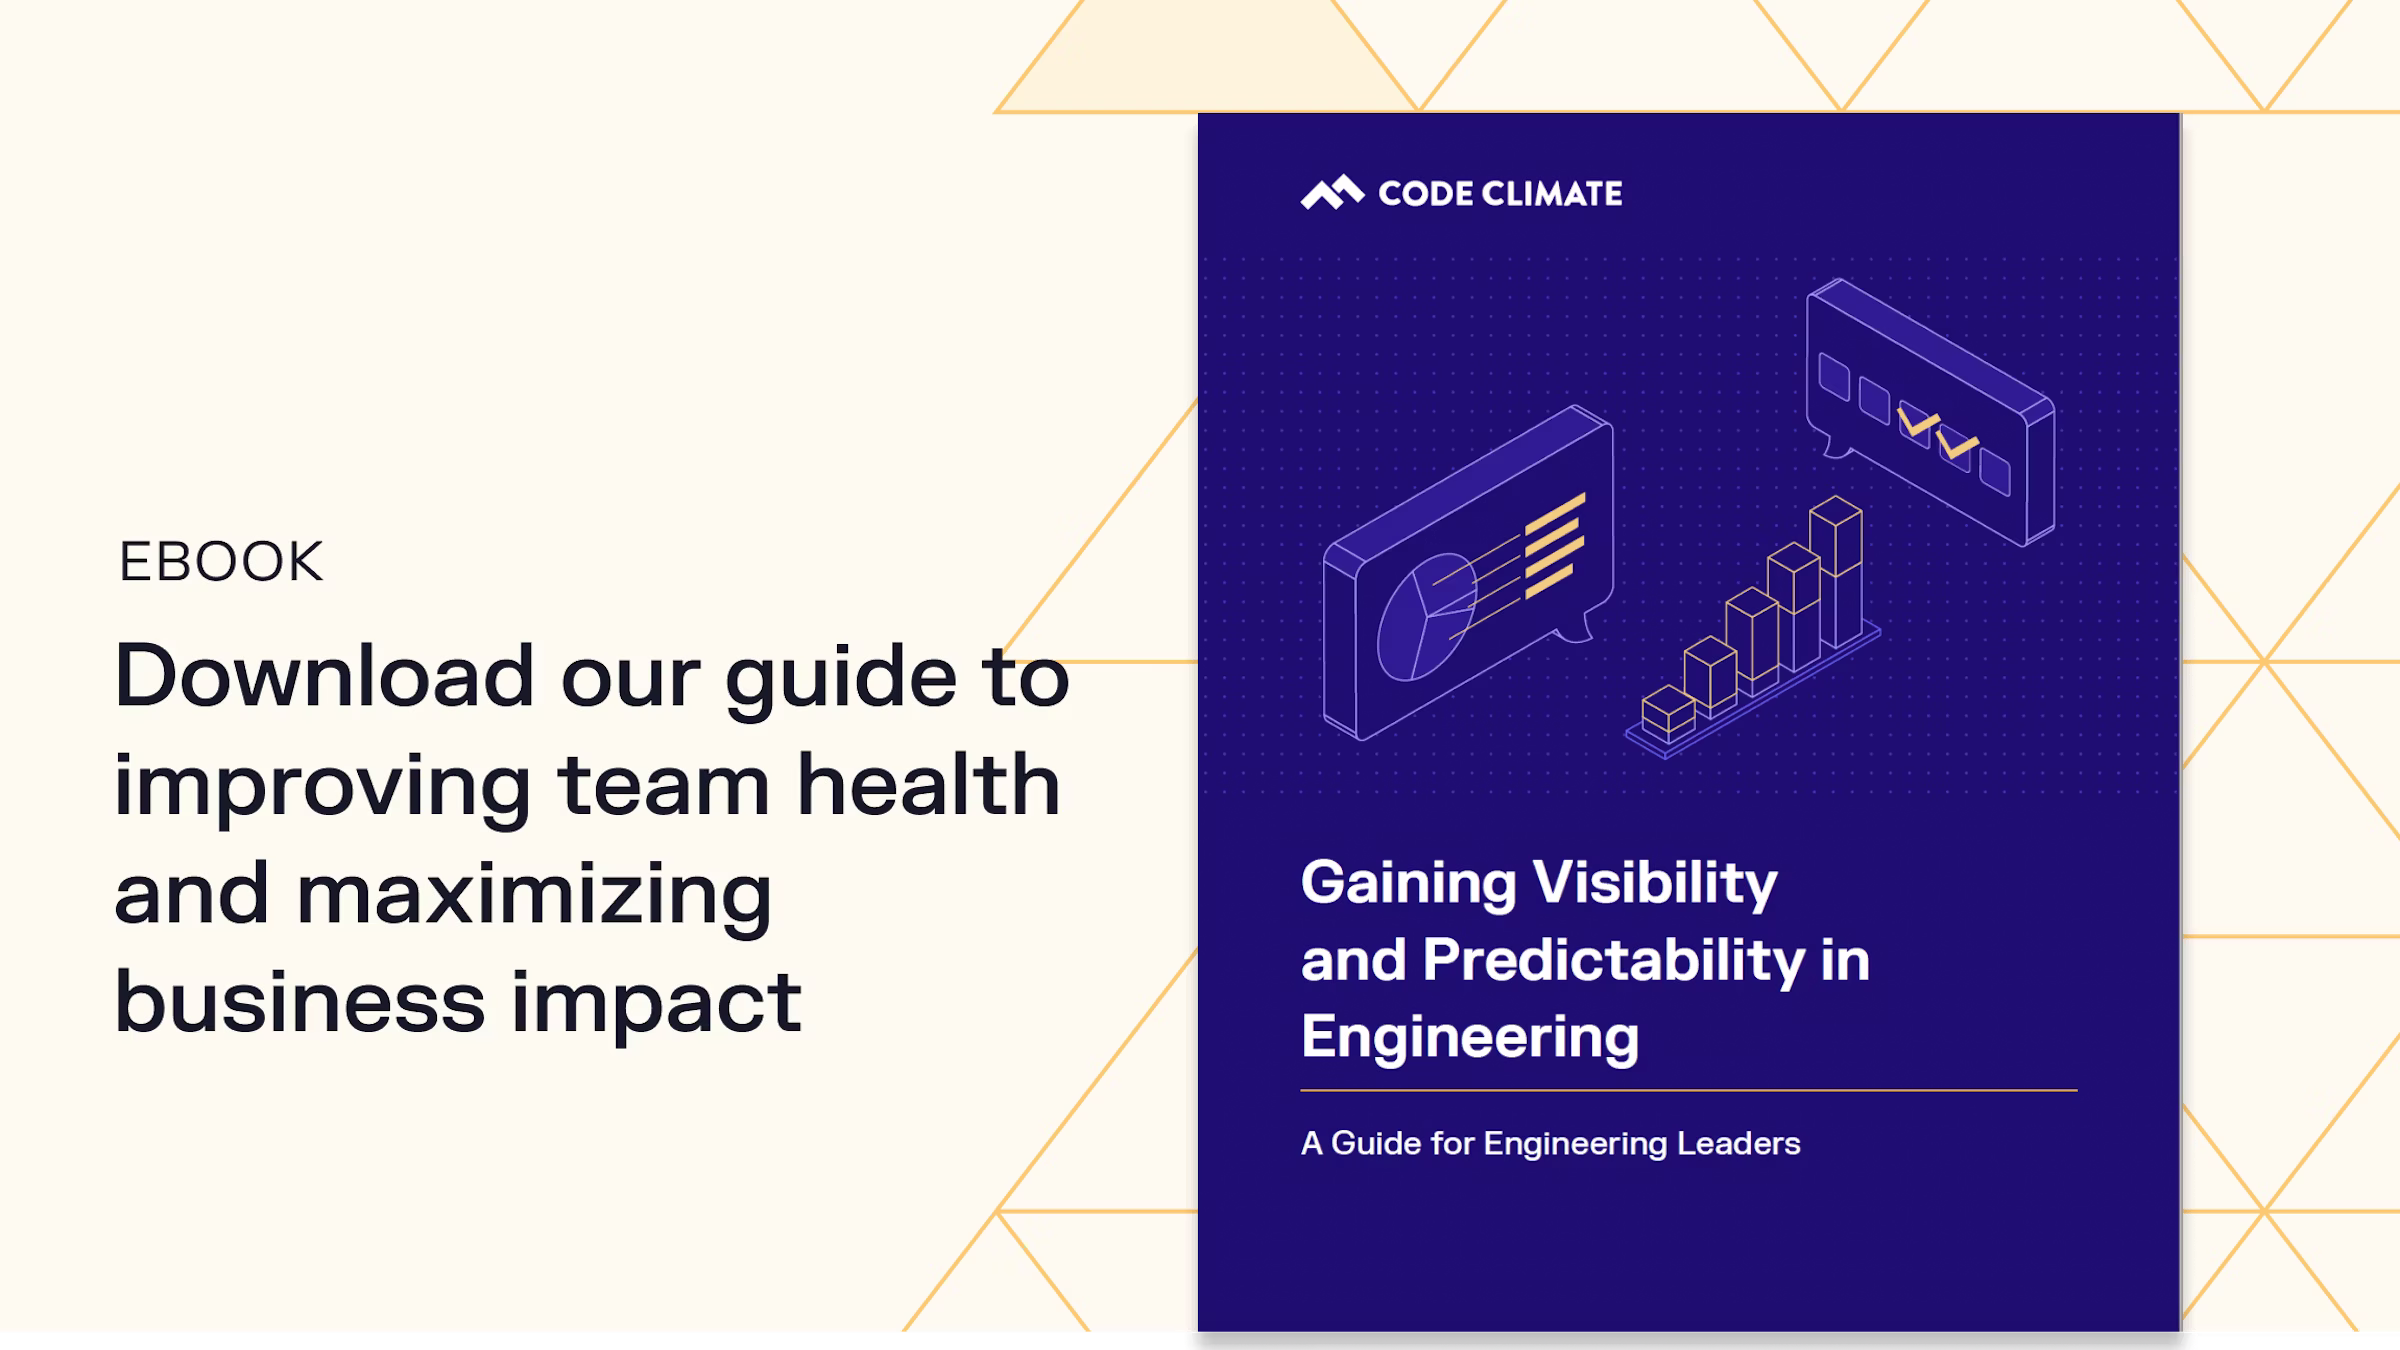
In this ebook, you’ll learn how to gain visibility into engineering team health and performance to improve efficiency and developer experience to maximize engineering impact on the business.
TripleLift is a revolutionary AdTech company elevating brands with advanced targeting and design-forward branding. Behind the company is a large team of high-performing software engineers. Engineering Manager Chris Oman knew his team was making a significant impact on the business, but needed a way to quantify and communicate that impact. Since adopting Code Climate Velocity, Oman has been able to leverage a host of engineering metrics to demonstrate the team’s progress.
In a constantly evolving industry like AdTech, software engineers must move quickly and continually innovate to remain competitive. Evaluating metrics and key performance indicators (KPIs) to drive improvements is part of the company’s commitment to continuous learning and growth. For TripleLift’s organization of more than 120 engineers, this has changed over the past year, as the team works to hone in on KPIs that truly measure developer success.
“Velocity uses our actual data so we can find areas of improvement instead of relying on gut instinct alone,” said Oman.
Oman uses Velocity several times a week to keep a pulse on how his team is performing and see where they may be running into roadblocks. Before adopting Velocity, Oman said he was not reporting on these metrics at all, so there was little opportunity to demonstrate developer productivity and value to management.
The platform has helped TripleLift increase PR Throughput by 46%, Push Count by 77%, and Commit Volume by 62%. The team also looks at the PR Resolution metric, which shows outliers and helps spotlight good behaviors and so they can replicate best practices across teams.
Guiding Developers to Personal Success
Team360 views in Velocity help Engineering Managers at TripleLift keep teams on track to meet their goals. Transparency into workflows enables leaders to better understand how teams operate and pass learnings along to other developers. Using these insights, the team is able to improve processes and productivity. They’ve also been able to enhance team retrospectives by looking at the PR Resolution module, which shows the journey of a Pull Request from the first commit to when it is merged (or in some cases, where it is abandoned or closed).
Oman said after using Velocity he is more conscious of PR Cycle Times. Since introducing the platform, TripleLift’s Cycle Time has decreased.
Notably, Velocity provided Oman with important insights to help manage individual developers.
“We had individual contributors that I know were doing great work but it was being overlooked because they were not committing code as frequently as they should,” he explained. “I was able to coach them to commit more frequently. In other cases, I’ve been able to reward high performers, and discourage unhealthy practices across teams, like working on weekends.”
At TripleLift, leadership knows that engineering productivity is about more than just coding — there is a holistic value that teams bring to the business. With Velocity, they have the metrics and insights to show impact and drive efficiency and improvements to remain competitive in the fast-paced AdTech world.
Learn how Velocity can help your engineering organization reduce Cycle Time and incorporate data into decision making. Speak with a product specialist.
For the third consecutive quarter, Code Climate’s Software Engineering Intelligence (SEI) platform, Velocity, has been recognized by engineering leaders as a top platform in G2’s ranking of Software Development Analytics Tools.
With substantial Satisfaction and Market Presence scores, Code Climate Velocity has earned Leader badges in both the Software Development Analytics Tools overall Grid® Report and Mid-Market Grid® Report, based on reviews from real Velocity users from companies with 51-1,000 employees, like this one:
“Code Climate Velocity gives me a great view into what my engineering team is doing and where we're losing cycles. It has really helped us get the whole engineering team optimizing throughput. Once you have things moving through the system quickly you can point the system at the right problems." — G2 Review, Anonymous
Velocity provides engineering leaders with unparalleled visibility into how their teams are working and every stage of the software development lifecycle (SDLC). Here’s what Guillermo Montes, Engeering Manager at AyalaCare is achieving with Velocity’s insights:
"It's a really powerful development insights tool. The reality is that the limit is what you decide to do with the data and how to build on top of it, cross-referencing activity Velocity crunches from GitHub with what's available in Jira can lead to some rather interesting reports. Although there's plenty of reports available, there are a few favorites that we rely on for our engineering KPIs, and the Analytics module is the ultimate resource to fall back to." — Guillermo Montes, Engineering Manager at AlayaCare
Hear from more Code Climate users or leave your own review on our G2 page.
KOHO Financial, a fintech company based in Toronto, has built its reputation on delivering innovative, digital-first products that make financial services more accessible for Canadians. With over 500,000 customers across the country, KOHO’s engineering leaders need deep visibility into the performance of their app-based financial solutions and teams in order to ensure fast and stable software delivery.
The company’s Director of Engineering, Chris McCann, turned to Code Climate Velocity, a Software Engineering Intelligence (SEI) platform, to boost the efficiency of the team, find and eliminate roadblocks, and work toward consistent, predictable delivery.
“One of the greatest benefits we’ve received from Velocity is becoming a more efficient engineering organization,” said McCann. “The platform helps us identify issues before they become big problems.”
Always-on visibility into team performance helps leaders identify problems early to eliminate roadblocks so teams can predictably deliver on outcomes. McCann and the team used Velocity to surface key metrics like PR Throughput to evaluate the health of their processes. If PR Throughput is low, engineering leaders will want to investigate related metrics and processes: Are developers being pulled away from high-value work to resolve incidents? Are they implementing best practices for Code Review to catch issues before they go to production?
McCann also took advantage of Velocity’s annotation capabilities to add context to reports, discovering that a drop-off in productivity could be due to something as simple as a light workload or planned vacations — or the team could be stuck on a tough problem that requires more support.
With both pre-built and custom reporting options, McCann said he has incredible visibility into team performance: “There are so many ways to really dig in, see how teams are performing, and isolate issues quickly.”
Validating Process Changes to Improve Efficiency
In two years of using Velocity, KOHO has gained invaluable insight into the engineering organization’s strengths and opportunities for growth. Armed with data, they’ve made important changes to improve efficiency and predictability in product delivery.
One significant change was the move away from a dedicated quality assurance (QA) team to a developer-driven model. This encouraged developers to take more ownership over Code Reviews, which led to better quality code. With a more efficient use of engineering resources, Code Review times decreased. QA team members were offered the opportunity to upskill and transition into development over a six-month period.
Velocity surfaced relevant insights to help the team transition, providing leaders with justification for how resources were being reallocated. The engineering organization was also able to uncover unexpected challenges due to the reorganization: with multiple developers creating tests for an endpoint, they returned a large, complex dataset containing redundancies.
During this process, Velocity provided the necessary visibility to help transition team members and ensure they had the resources they needed to be successful. The team looked at Impact and Productive Impact metrics to make sure that developers owning QA did not diminish their ability to deliver. Then, they cross-referenced that with the quality and customer support teams to confirm that developer-driven quality was actually working from a customer perspective.
It also uncovered unexpected challenges with the new process that they’ve been able to solve. For example, multiple developers creating tests for an endpoint that returns a big set of data resulted in unnecessary redundancy and complexity.
As the transition occurred, leaders were able to see Impact metrics trending upward throughout the timespan, while new code remained relatively stable. They were able to monitor rework alongside code pushes to make comparisons that either support the benefits or highlight weaknesses. Ultimately, the change from dedicated QA to developer-driven QA resulted in reduced rework. With data from Velocity, KOHO was able to demonstrate the success of the initiative.
As another example, in late 2022, KOHO’s engineering department implemented “no meeting Wednesdays” to see if a full day of focus time improved performance. Engineers were excited about the change, but leaders looked to Velocity for validation. Within two weeks, Impact metrics and PR Throughput were trending up — not just on Wednesdays, but the subsequent Thursdays and Fridays as well. This showed that increased focus time on Wednesdays enabled developers to get more done, and the additional work carried over into Thursday and Friday via Code Review. After the holidays, metrics began to show impressive results and the change became permanent for the engineering organization. In early 2023, the mid-week no-meeting policy expanded company-wide.
KOHO’s engineering teams have recently started digging into DORA metrics in Velocity’s Analytics module, which address critical areas of engineering performance. These metrics include Mean Lead Time for Changes, Deployment Frequency, Change Failure Rate, and Mean Time to Recovery. Now that the teams can see these measurements alongside other engineering metrics in Velocity, they can make higher-impact adjustments to their processes and better balance the speed and stability of software delivery.
Cultivating Individual and Team Success
At KOHO, building better financial solutions starts with cultivating a collaborative environment where people are energized by their work and encouraged to take ownership of their success. In this regard, Velocity has become a meaningful platform for both leadership and individual contributors. McCann said engineers track their PR Throughput and Code Review to understand their output. Personal performance metrics can highlight the areas where they excel, surface opportunities for growth, and encourage more collaboration between peers.
Engineering leaders can also identify and reward high-performing teams and individuals. Equally as important, they can more easily spot when developers may be struggling, and take action to support them.
“As engineering leaders, we can’t be in the weeds with our teams every day, so it's reassuring to know I have Velocity in my pocket, which allows me to drill down when necessary to investigate issues. Velocity provides the visibility I need, when I need it, to make informed decisions that keep our company moving forward.”
To learn more about how Velocity offers critical visibility for engineering leaders, schedule a platform demo.
The DORA research group, (DevOps Research and Assessment), now part of Google Cloud, identified four key software engineering metrics that their research showed have a direct impact on the teams' ability to improve deploy velocity and code quality, which directly impacts business outcomes.
The four outcomes-based DORA metrics include two incident metrics: Mean Time to Recovery (MTTR) (also referred to Time to Restore Service), and Change Failure Rate (CFR), and two deploy metrics: Deployment Frequency (DF) and Mean Lead Time for Changes (MTLC).
Gaining visibility into these metrics offers actionable insights to balance and enhance software delivery, so long as they are considered alongside other key engineering metrics and shared and discussed with your team.
The Mean Time to Recovery metric can help teams and leaders understand the risks that incidents pose to the business as incidents can cause downtime, performance degradation, and feature bugs that make an application unusable.
What is Mean Time to Recovery?
Mean Time to Recovery is a measurement of how long it takes for a team to recover from a failure in production, from when it was first reported to when it was resolved. We suggest using actual incident data to calculate MTTR, rather than proxy data which can be fallible and error-prone, in order to improve this metric and prevent future incidents. While the team may experience other incidents, MTTR should only look at the recovery time of incidents that cause a failure in production.
Why is Mean Time to Recovery Important?
Even for high-performing teams, failures in production are inevitable. MTTR offers essential insight into how quickly engineering teams respond to and resolve incidents and outages. Digging into this metric can reveal which parts of your processes need extra attention; if you’re delivering quickly but experiencing frequent incidents, your delivery is not balanced. By surfacing the data associated with your teams’ incident response, you can begin to investigate the software delivery pipeline and uncover where changes need to be made to speed up your incident recovery process.
Recovering from failures quickly is key to becoming a top-performing software organization and meeting customer expectations.
What is a good Mean Time to Recovery?
Each year, the DORA group puts out a state of DevOps report, which includes performance benchmarks for each DORA metric, classifying teams as high, medium, and low-performing. One of the most encouraging and productive ways to use benchmarking in your organization is to set goals as a team, measure how you improve over time, and congratulate teams on that improvement, rather than using “high,” “medium” and “low” to label team performance. Additionally, if you notice improvements, you can investigate which processes and changes enabled teams to improve, and scale those best practices across the organization.
More than 33,000 software engineering professionals have participated in the DORA survey in the last eight years, yet the approach to DORA assessment is not canonical and doesn’t require precise calculations from respondents, meaning different participants may interpret the questions differently, and offer only their best assumptions about their teams’ performance. That said, the DevOps report can provide a baseline for setting performance goals.
The results of the 2022 State of DevOps survey showed that high performers had a Mean Time to Recovery of less than one day, while medium-performing organizations were able to restore normal service between one day and one week, and low-performing organizations took between one week and one month to recover from incidents. For organizations managing applications that drive revenue, customer retention, or critical employee work, being a high performer is necessary for business success.
How To Improve Your Mean Time to Recovery
Visibility into team performance and all stages of your engineering processes is key to improving MTTR. With more visibility, you can dig into the following aspects of your processes:
Work in Progress (WIP)
A long MTTR could indicate that developers have too much WIP, and lack adequate resources to address failures.
Look at Other Metrics and Add Context
One of the benefits of using a Software Engineering Intelligence (SEI) platform is that you can add important context when looking at your MTTR. An SEI platform like Code Climate, for example, allows you to annotate when you made organizational changes — like adding headcount or other resources — to see how those changes impacted your delivery.
You can also view DORA metrics side by side with other engineering metrics, like PR Size, to uncover opportunities for improvement. Smaller PRs can move through the development pipeline more quickly, allowing teams to deploy more frequently. If teams make PR Sizes smaller, they can find out what’s causing an outage sooner. For example, is debugging taking up a lot of time for engineers? Looking at other data like reverts or defects can help identify wasted efforts or undesirable changes that are affecting your team’s ability to recover, so you can improve areas of your process that need it most.
Improve Documentation
What did you learn from assessing your team’s incident response health? Documenting an incident-response plan that can be used by other teams in the organization and in developer onboarding can streamline recovery.
Set Up an Automated Incident Management System
To improve your team’s incident response plan, it’s helpful to use an automated incident management system, like Opsgenie or PagerDuty. With an SEI platform like Code Climate you can push incident data from these tools, or our Jira incident source, to calculate DORA metrics like MTTR. In Code Climate's platform, users can set a board and/or issue type which will tell the platform what to consider an “incident.”
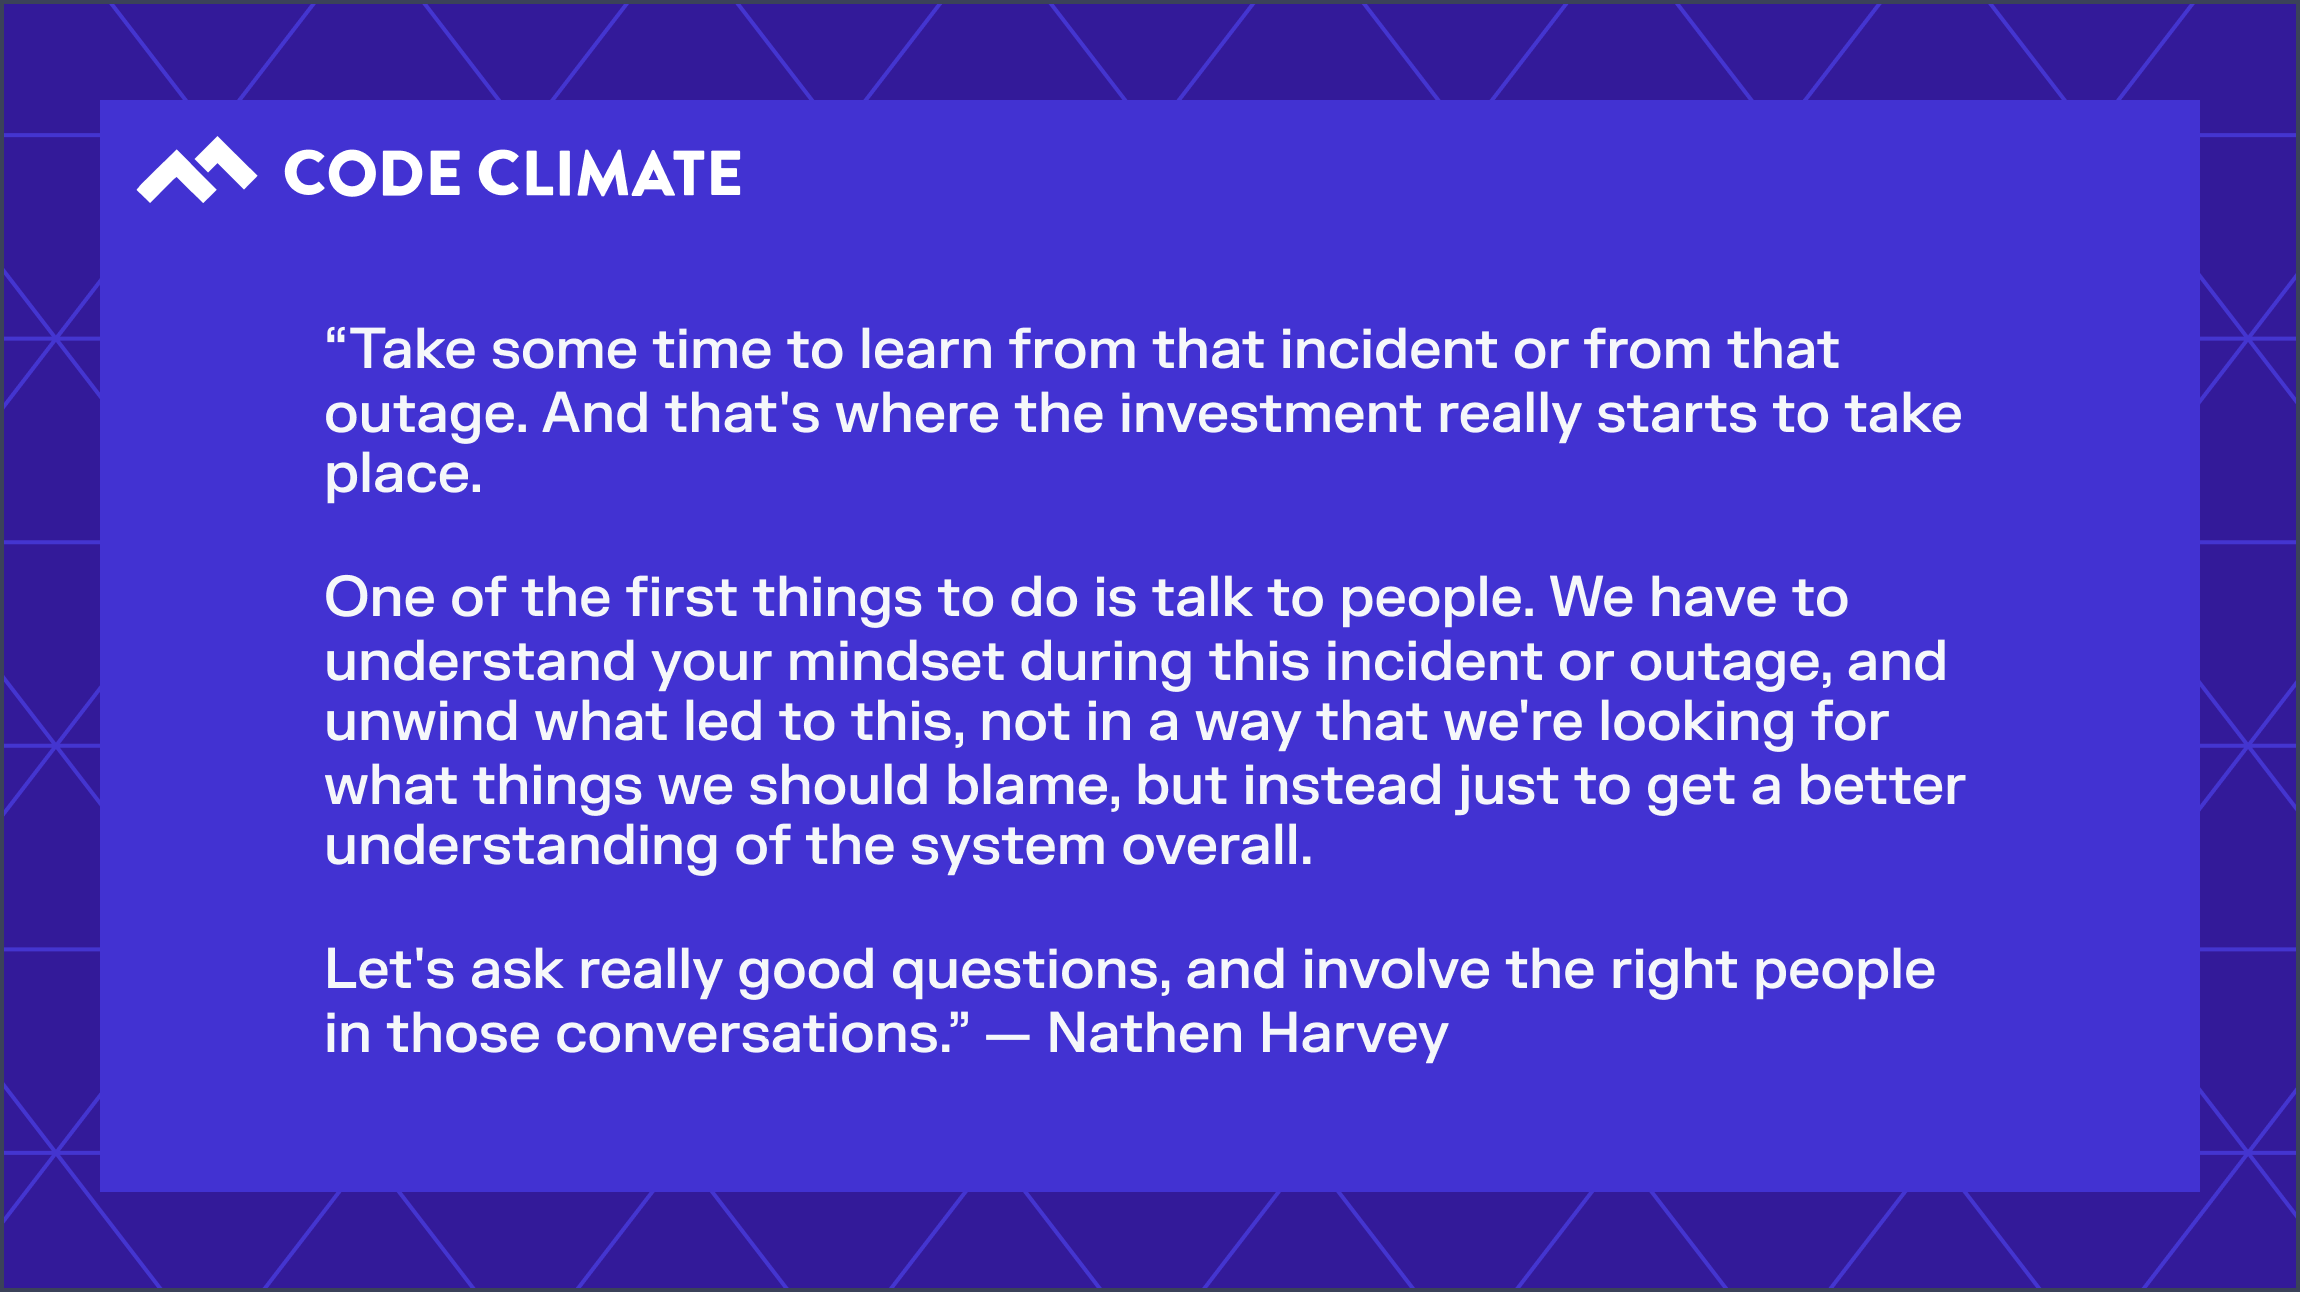
Talk to Your Team
We spoke with Nathen Harvey, Developer Advocate at DORA and Google Cloud, for his perspective on how to best use DORA metrics to drive change in an organization. Harvey emphasized learning from incident recovery by speaking with relevant stakeholders.
Looking at DORA metrics like Mean Time to Recovery is a key starting point for teams who want to improve performance, and ensure more fast and stable software delivery. By looking at MTTR in context with organizational changes and alongside other engineering metrics, speaking with your team after an incident, and documenting and scaling best practices, you can improve MTTR overall and ultimately deliver more value to your customers.
Learn how you can use these metrics to enhance engineering performance and software delivery by requesting a consultation.
In 2022, IT spending for organizations worldwide exceeded $4.4 trillion, underscoring the essential role of tech in today’s economy. Gartner’s research shows that investment in technology is key to business success, spurring a heightened focus on the software engineering organizations behind that technology.
Engineering organizations are now under greater pressure to maximize ROI, effectively allocate resources, communicate with stakeholders on progress, and deliver quality software quickly. To achieve this, engineering leaders need visibility into engineering processes, where resources are going, and how their teams are working.
The challenge of visibility in engineering
In the past, leaders have relied on homegrown solutions and surveys to assess the state of the engineering organization. These solutions can be error-prone and time consuming, requiring leaders to manually gather information from a variety of sources like project management tools and version control systems.
To gain critical context and dependable data, leaders should leverage a Software Engineering Intelligence (SEI) platform. An SEI platform ingests, cleans, links, and analyzes data from teams’ existing systems, surfacing those insights via alerts, custom reporting, and intuitive visualizations. This gives leaders the visibility they need to evaluate tradeoffs, mitigate risk, enhance communication, boost engineering efficiency, and improve value delivery.
Gartner predicts that 70% of organizations will have an SEI platform by 2026, up from 5% in 2023.
(Source: Innovation Insight for Software Engineering Intelligence Platforms, March, 2023)
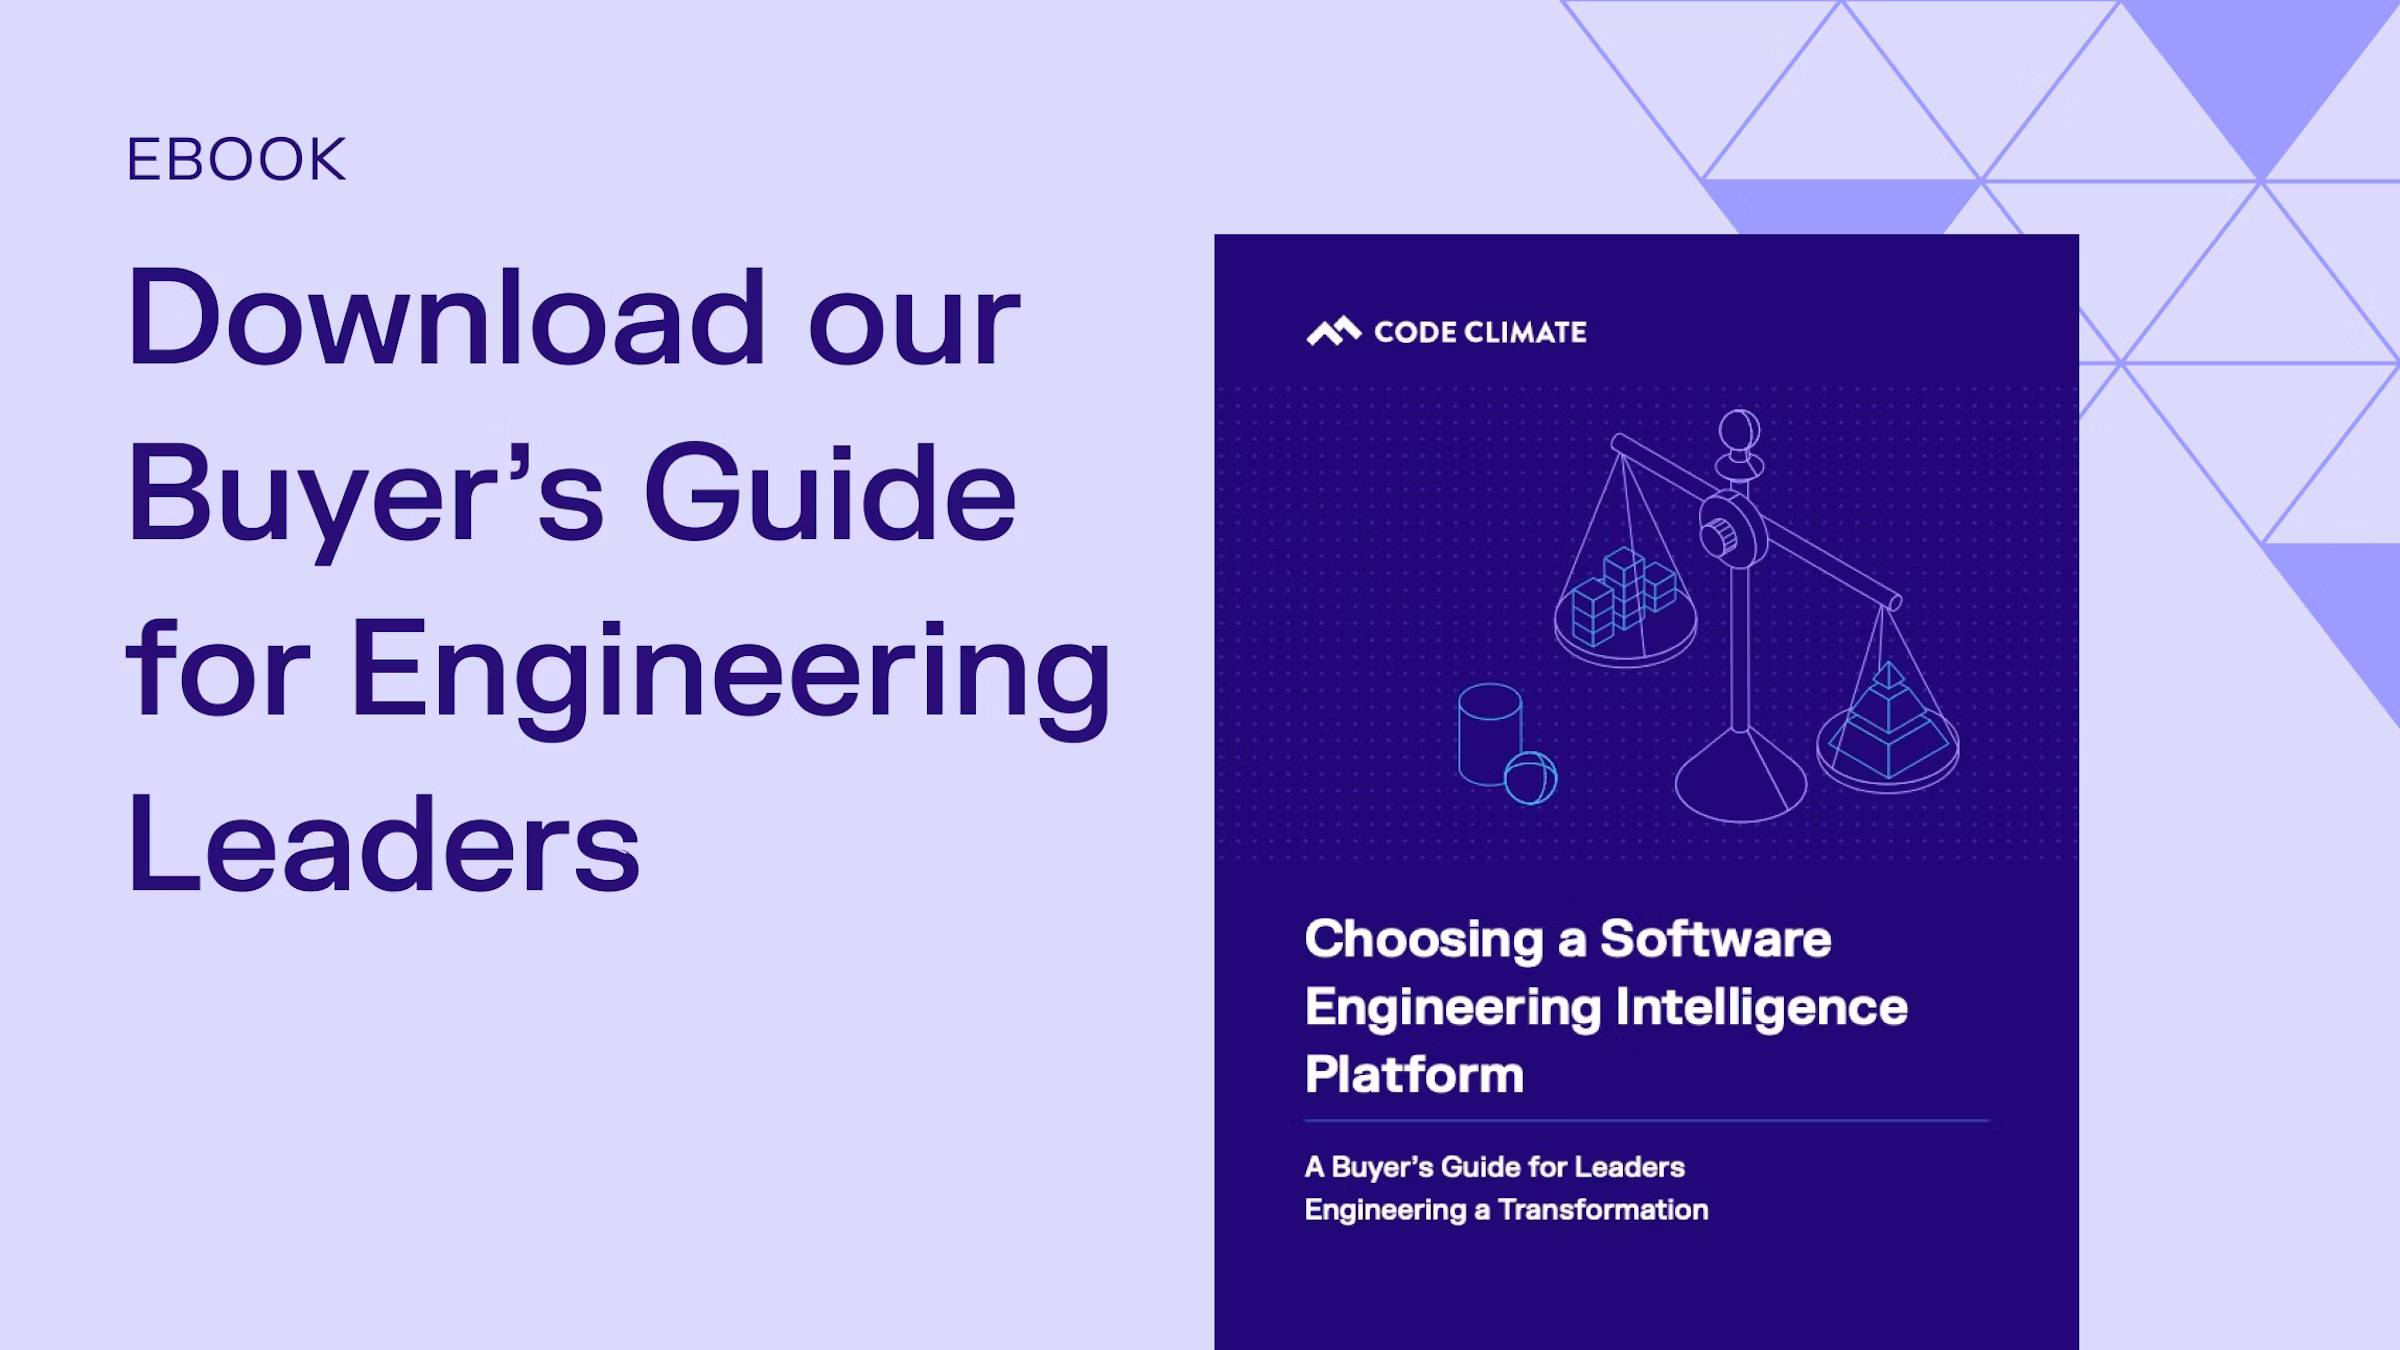
How can engineering leaders best evaluate which SEI platform is the best option for their organization?
We’ve put together a comprehensive buyer’s guide outlining what leaders should look for in an SEI platform, including key features and capabilities.
We recommend assessing SEI platforms on the following categories:
- Process and Team Health: An SEI platform should provide a multidimensional picture of team health, while adapting to variations in team process.
- Allocations and Business Value: It’s imperative that an SEI platform help leaders accurately assess resource allocation and quantify engineering impact.
- Efficiency and Predictable Delivery: The right SEI platform should help leaders improve their team’s ability to deliver code consistently, predictably, and at high quality.
- Team Effectiveness: An SEI platform will offer insight into whether interruptions, wasted work, or other factors are impacting engineering’s ability to deliver value.
- Data Hygiene and Analysis: The best SEI platform will deliver trustworthy insights while working in tandem with the tools and workflows a team is already using.
- Scalability and Customization: An SEI platform should be able to meet the unique needs of complex, large, and ever-evolving organizations.
- Security: The best SEI platforms will prioritize the security of your data.
Code Climate’s enterprise-level insights platform is the only one to offer enterprise-grade security and scalability. From day one, Code Climate maximizes engineering impact with trusted and actionable insights for leaders and teams at all levels — from capacity and delivery to quality, culture, and costs.
As outlined in the guide, Code Climate's platform provides unique advantages in four key areas:
- Clear Focus on Improving the Efficiency and Output of Engineering Teams: Code Climate's platform provides critical visibility into development processes, including insights for coaching and for improving the overall health and efficiency of an engineering organization.
- Security and Scalability for Large, Complex Organizations: Code Climate adapts to our customers’ needs, and our security and scalability capabilities are built to handle the largest enterprises.
- Personalized Customer Experience: Code Climate offers a superior customer experience from Day 1, with white-glove support, thorough technical onboarding, multiple training options, and a consultative approach to change management.
- Customizations That Adapt to How Our Customers Work: Code Climate's platform is highly customizable, adapting to the way our customers work. The platform offers autonomy for each of your engineering teams so that they can best leverage metrics to improve performance.
Download the complete guide to choosing an SEI platform and find out more about the advantages of SEI, including what to look for when evaluating each of the key capabilities, and a detailed breakdown of how Code Climate measures up.
Over the past few years, a shift in consumer behavior has supercharged e-commerce, emphasizing the importance for companies to optimize the digital experience for their customers. Increased demand has driven significant growth for e-commerce solution provider Yottaa, which now helps more than 1,500 sites achieve better performance, boosting conversions and revenue.
Behind the industry-leading e-commerce optimization platform is a growing team of engineers who prioritize efficient delivery and continuous innovation to bring value to customers. To ensure his teams have what they need to be successful, Director of Engineering Dan Biagini needs rich insight into team performance, which is impossible to acquire manually. In 2022, Yottaa reached a tipping point, leading to an easy decision to onboard with Code Climate Velocity, a Software Engineering Intelligence platform.
Purpose-built for engineering management
Biagini said the engineering organization was reinforcing its commitment to agile and closely evaluating how it worked. Concurrently, there was a company-wide push to make data-driven process improvements and implement dashboards for more consumable reporting. But with a large team and increasing demands, Biagini struggled to manually extract helpful information from existing tools and felt that building homegrown dashboards and spreadsheets was painful and time-consuming.
“Having a tool that provides deep insight into how our teams are performing is really important, and I believe Velocity is purpose-built to fulfill this need,” Biagini said.
Biagini felt that competitive products in the market were overly focused on financial reporting or lacked broad visibility. Velocity seamlessly integrates with existing tools and workflows to give a complete picture of engineering processes and performance. Armed with actionable insight, engineering leaders can easily align initiatives with strategic priorities, accelerate software delivery, and drive continuous improvement within their teams.
Turnkey deployment adds value on day one
Velocity’s turnkey deployment enabled Biagini and other engineering leaders at Yottaa to immediately begin building useful reports. Onboarding was as simple as connecting the platform to Jira and Github and leveraging the built-in reporting features to understand key metrics like Cycle Time and PR Throughput. Velocity also made it easy to share clear yet comprehensive reports and dashboards with leadership.
“It worked right out of the box. I was able to take the results and run with them immediately. I didn’t have to train a team on yet another platform or use more tools than we need,” said Biagini. “The fact that Velocity simply overlays on top of the tools we are already using and pulls out the data is just so powerful.”
With insight into engineering processes, Yottaa’s engineering teams were able to align on goals and identify bottlenecks for immediate improvement. Within three months, they decreased Cycle Time by 8% and increased PR Throughput by 10%. They also decreased PR size by 29%, which enabled faster reviews and reduced risk during PR merges. These improvements are significant because their focus in early Q1 is often getting through the deployment backlog that slows down during the holiday season to preserve platform stability.
Data-driven decision-making
Biagini said sophisticated insight into the cyclical nature of their e-commerce technology team has been an unexpected value add. The team spends October through December limiting the amount of code they push into production, often using this time to work through support requests and address technical debt. In January, deployment ramps up, impacting metrics like Cycle Time. With Velocity, it is easier to see how cyclical changes impact teams and communicate this impact to leadership.
Biagini is looking forward to leveraging the new DORA metrics capabilities within the context of other engineering metrics in the Velocity Analytics module to dig deeper into possible process improvements and identify how to make the highest-impact adjustments. He also said he sees how data from Velocity will support decisions about future development efforts, resource allocation, and expanding headcount.
“We can really map out the reality of the business and more easily communicate it to others,” Biagini said.
To learn more about how Velocity can help your organization decrease Cycle Time and increase PR throughput, speak with a product specialist.
VSM vs. SEI Platforms: Why Engineering Leaders Need Software Intelligence Platforms
Software organizations and teams power businesses across a range of industries, and the success of those organizations hinges on fast, stable, and predictable software delivery. For any organization wanting to gain an advantage in the marketplace and provide maximum value to customers, improving the efficiency and productivity of their engineering team is a critical step.
With an abundance of tools, stakeholders, and data repositories, engineering organizations are complex. Not only is leadership tasked with optimizing the flow of work through delivery pipelines, but also with quantifying and demonstrating engineering value to the business. Many leaders turn to a value stream management (VSM) tool or a Software Engineering Intelligence (SEI) platform, to address these challenges. While both have their benefits, there are important differences that make SEI platforms the most comprehensive solution for engineering leaders.
Software Engineering Intelligence (SEI) platforms, also sometimes known as Engineering Management Platforms (EMPs), like Code Climate, offer critical insight into the engineering part of the value stream by providing both granular and holistic views of a team’s DevOps pipeline, team health, and developer experience. This enables engineering leaders with the right tools to be more effective in their roles.
SEI platforms also surface value stream metrics, like those tied to product value and customer satisfaction, which allow leaders to communicate more effectively with stakeholders.
How does Code Climate provide value stream insights?
Code Climate's Software Engineering Intelligence (SEI) platform, offers a range of insights that are valuable for engineering leaders and teams, but when it comes to the value stream in particular, it allows teams to track efficiency, resource allocation, and speed of software delivery.
For those looking for value stream insights, Code Climate's platform offers:
Data and integrations. Code Climate's platform ingests data from an organization’s existing tools, including GitHub and Jira, plus incident and deploy data, turning that data into dashboards and reports.
Actionable insights from data. Engineering leaders can leverage these insights to investigate their delivery pipelines and make improvements to the workflow. They can also share reports with stakeholders to underscore the impact of the engineering team on the business and align on strategic priorities.
Modules to enhance visibility. With modules like Team360, Dev360, and Code Review, managers can evaluate processes and institute best practices to improve workflow. With metrics like Cycle Time and modules like Workstreams, Code Climate allows users to understand the flow of work through application delivery pipelines.
DORA metrics. DORA metrics track the overall efficiency of how you are delivering value to your customers. Code Climate captures the four key DORA metrics, contextualizing them among other engineering metrics, in our Analytics module.
Tracking deliverables within Code Climate's Platform
A key component of value stream management is the ability to track the status of projects and deliverables. Here are two ways that Velocity can help track deliverables:
With Workstreams: Velocity’s Workstreams module brings together Git and project management data for active boards and sprints, allowing engineering leaders to visualize work in progress.
To be more effective, engineering leaders need even more capabilities than what value stream platforms provide. Here are additional insights provided by an SEI platform like Velocity that are critical for leadership.
Benchmarking within Velocity
With competitive benchmarking available in an SEI platform, engineering leaders can compare their team’s performance against others in the industry. Internal benchmarking can also be useful for teams to evaluate their own progress, or to assess the efficacy of your internal onboarding processes. While we don’t recommend stack ranking developers, there are effective ways of comparing teams to achieve impact. Using the Compare module within Velocity allows leaders to identify high performers. You can then dig deeper into those teams’ processes, and scale best practices across the organization so that every team is operating at that level.
Tactical engineering metrics from an SEI platform
Leaders need ways to connect engineering input to business outcomes in order to demonstrate the engineering organization’s impact on the business. SEI platforms provide the level of visibility required for leaders to communicate the value of engineering teams to stakeholders.
Velocity contextualizes data
Code Climate’s SEI platform, Velocity, does more than provide metrics: it surfaces actionable insights and ingests up to a year of historical data, so that engineering leaders can identify trends and patterns.
With annotations, Velocity users can add relevant context to data within the platform, noting events or organizational changes, and observe their impact. Velocity’s Analytics module also allows engineering leaders and teams to view metrics in tandem to find correlations.
More than Delivery Metrics: Maximize Team Health with Velocity
Beyond focusing on work that moves through the pipeline, effective engineering leaders prioritize the health of teams and experiences of individual contributors. An SEI platform like Velocity makes it easier for engineering leaders to gain visibility into team health, while traditional VSM tools do not surface these insights. Creating a culture of continuous feedback and encouraging developer growth, for example, all lead to a better working environment. A positive, psychologically safe environment leads to product innovation and a higher rate of developer retention, which in turn will lead to improved value delivery.
While developer happiness is difficult to quantify, Velocity surfaces insights that correlate to developer satisfaction and team health, and helps leaders spot and prevent potential burnout, find opportunities for developer growth, and inform coaching conversations.
Here are Velocity features that specifically address these needs:
Team360
Velocity’s Team360 module is designed to provide engineering leaders with a consolidated view of what their teams are working on.
With snapshots and illustrations of workload and work distribution, leaders will be less inclined to ask for updates or micromanage teams. With this module, leaders can visualize how work is distributed to mitigate potential burnout, and see where teams are excelling to scale best practices across the organization.
Engineering leaders can use these insights to inform coaching conversations, providing concrete analytics to help teams remove blockers and establish priorities.
Developer360
The Developer360 module, designed for Engineering Managers, provides transparency around engineering work and, similar to Team360, helps with coaching, alignment, and planning.
Specific insights into developer activity helps managers identify at-risk work so you can step in and support developers, while a snapshot of developer workload offers transparency around a team’s capacity and work distribution. Additionally, managers can gain a visual summary of a developer’s technical toolbox and skill level, providing a basis for planning and coaching conversations.
Compare
Velocity’s Compare module is the engineering leader’s answer to identifying top performers and those who need additional support in an organization.
This module breaks down performance by metric to visualize how individuals and teams are performing relative to one another on a given metric, as well as how performance is improving over time. Compare offers various visualization formats to gain different insights. For example, Radar View is a visual representation of whether a developer’s efforts are evenly distributed across all relevant metrics, whereas the Card View allows you to see metrics for teams or individuals in a scorecard format, and compare metrics over certain time periods.
The role of engineering leader is multifaceted. In addition to overseeing and improving delivery pipelines, team health, and performance, leaders also need to communicate the impact of the engineering organization to stakeholders.
A data-based platform is the most effective way to achieve this: data insights lay the groundwork for actionable conversations with your team to enable them to excel, while offering concrete evidence of the engineering’s role in driving change in the business. While VSM and SEI platforms both offer objective data, SEI platforms offer the most critical insights for engineering leaders.
To see Velocity’s capabilities in action, schedule a demo with a product specialist.