Resources & Insights
Featured Article
Navigating the world of software engineering or developer productivity insights can feel like trying to solve a complex puzzle, especially for large-scale organizations. It's one of those areas where having a cohesive strategy can make all the difference between success and frustration. Over the years, as I’ve worked with enterprise-level organizations, I’ve seen countless instances where a lack of strategy caused initiatives to fail or fizzle out.
In my latest webinar, I breakdown the key components engineering leaders need to consider when building an insights strategy.
Why a Strategy Matters
At the heart of every successful software engineering team is a drive for three things:
- A culture of continuous improvement
- The ability to move from idea to impact quickly, frequently, and with confidence
- A software organization delivering meaningful value
These goals sound simple enough, but in reality, achieving them requires more than just wishing for better performance. It takes data, action, and, most importantly, a cultural shift. And here's the catch: those three things don't come together by accident.
In my experience, whenever a large-scale change fails, there's one common denominator: a lack of a cohesive strategy. Every time I’ve witnessed a failed attempt at implementing new technology or making a big shift, the missing piece was always that strategic foundation. Without a clear, aligned strategy, you're not just wasting resources—you’re creating frustration across the entire organization.
Sign up for a free, expert-led insights strategy workshop for your enterprise org.
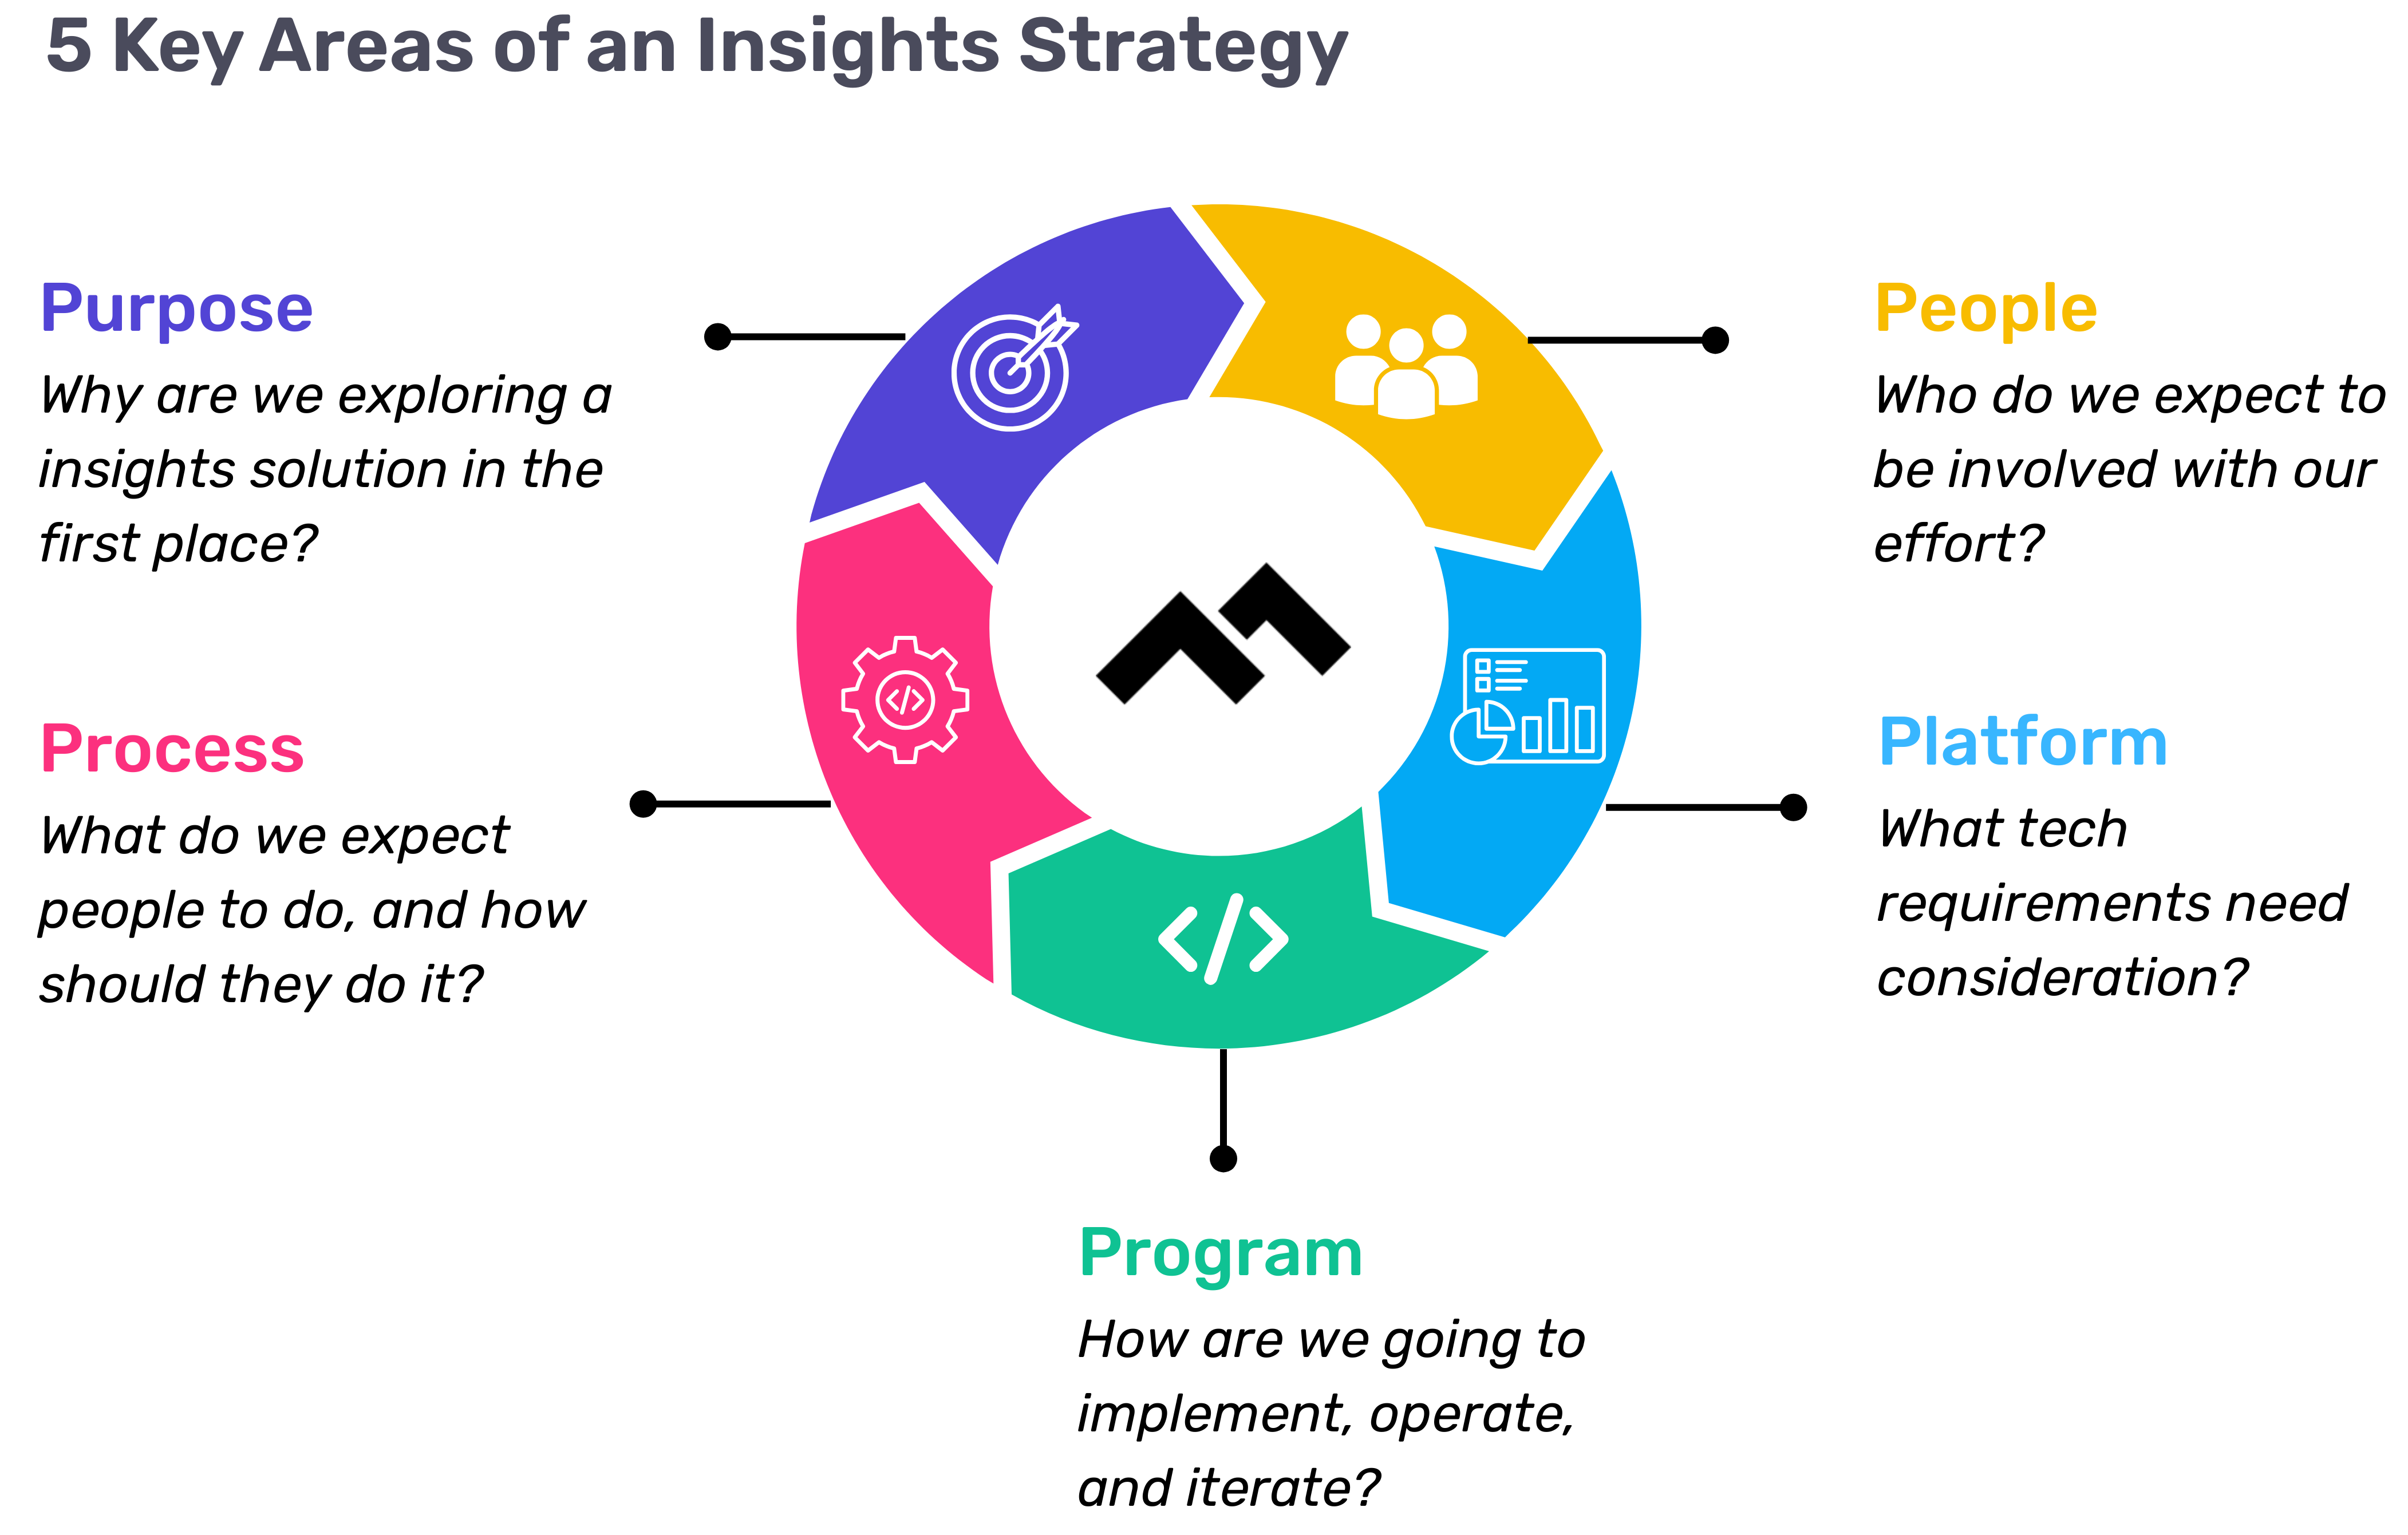
Step 1: Define Your Purpose
The first step in any successful engineering insights strategy is defining why you're doing this in the first place. If you're rolling out developer productivity metrics or an insights platform, you need to make sure there’s alignment on the purpose across the board.
Too often, organizations dive into this journey without answering the crucial question: Why do we need this data? If you ask five different leaders in your organization, are you going to get five answers, or will they all point to the same objective? If you can’t answer this clearly, you risk chasing a vague, unhelpful path.
One way I recommend approaching this is through the "Five Whys" technique. Ask why you're doing this, and then keep asking "why" until you get to the core of the problem. For example, if your initial answer is, “We need engineering metrics,” ask why. The next answer might be, “Because we're missing deliverables.” Keep going until you identify the true purpose behind the initiative. Understanding that purpose helps avoid unnecessary distractions and lets you focus on solving the real issue.
Step 2: Understand Your People
Once the purpose is clear, the next step is to think about who will be involved in this journey. You have to consider the following:
- Who will be using the developer productivity tool/insights platform?
- Are these hands-on developers or executives looking for high-level insights?
- Who else in the organization might need access to the data, like finance or operations teams?
It’s also crucial to account for organizational changes. Reorgs are common in the enterprise world, and as your organization evolves, so too must your insights platform. If the people responsible for the platform’s maintenance change, who will ensure the data remains relevant to the new structure? Too often, teams stop using insights platforms because the data no longer reflects the current state of the organization. You need to have the right people in place to ensure continuous alignment and relevance.
Step 3: Define Your Process
The next key component is process—a step that many organizations overlook. It's easy to say, "We have the data now," but then what happens? What do you expect people to do with the data once it’s available? And how do you track if those actions are leading to improvement?
A common mistake I see is organizations focusing on metrics without a clear action plan. Instead of just looking at a metric like PR cycle times, the goal should be to first identify the problem you're trying to solve. If the problem is poor code quality, then improving the review cycle times might help, but only because it’s part of a larger process of improving quality, not just for the sake of improving the metric.
It’s also essential to approach this with an experimentation mindset. For example, start by identifying an area for improvement, make a hypothesis about how to improve it, then test it and use engineering insights data to see if your hypothesis is correct. Starting with a metric and trying to manipulate it is a quick way to lose sight of your larger purpose.
Step 4: Program and Rollout Strategy
The next piece of the puzzle is your program and rollout strategy. It’s easy to roll out an engineering insights platform and expect people to just log in and start using it, but that’s not enough. You need to think about how you'll introduce this new tool to the various stakeholders across different teams and business units.
The key here is to design a value loop within a smaller team or department first. Get a team to go through the full cycle of seeing the insights, taking action, and then quantifying the impact of that action. Once you've done this on a smaller scale, you can share success stories and roll it out more broadly across the organization. It’s not about whether people are logging into the platform—it’s about whether they’re driving meaningful change based on the insights.
Step 5: Choose Your Platform Wisely
And finally, we come to the platform itself. It’s the shiny object that many organizations focus on first, but as I’ve said before, it’s the last piece of the puzzle, not the first. Engineering insights platforms like Code Climate are powerful tools, but they can’t solve the problem of a poorly defined strategy.
I’ve seen organizations spend months evaluating these platforms, only to realize they didn't even know what they needed. One company in the telecom industry realized that no available platform suited their needs, so they chose to build their own. The key takeaway here is that your platform should align with your strategy—not the other way around. You should understand your purpose, people, and process before you even begin evaluating platforms.
Looking Ahead
To build a successful engineering insights strategy, you need to go beyond just installing a tool. An insights platform can only work if it’s supported by a clear purpose, the right people, a well-defined process, and a program that rolls it out effectively. The combination of these elements will ensure that your insights platform isn’t just a dashboard—it becomes a powerful driver of change and improvement in your organization.
Remember, a successful software engineering insights strategy isn’t just about the tool. It’s about building a culture of data-driven decision-making, fostering continuous improvement, and aligning all your teams toward achieving business outcomes. When you get that right, the value of engineering insights becomes clear.
Want to build a tailored engineering insights strategy for your enterprise organization? Get expert recommendations at our free insights strategy workshop. Register here.Register here.
Andrew Gassen has guided Fortune 500 companies and large government agencies through complex digital transformations. He specializes in embedding data-driven, experiment-led approaches within enterprise environments, helping organizations build a culture of continuous improvement and thrive in a rapidly evolving world.
Navigating the world of software engineering or developer productivity insights can feel like trying to solve a complex puzzle, especially for large-scale organizations. It's one of those areas where having a cohesive strategy can make all the difference between success and frustration. Over the years, as I’ve worked with enterprise-level organizations, I’ve seen countless instances where a lack of strategy caused initiatives to fail or fizzle out.
In my latest webinar, I breakdown the key components engineering leaders need to consider when building an insights strategy.
Why a Strategy Matters
At the heart of every successful software engineering team is a drive for three things:
- A culture of continuous improvement
- The ability to move from idea to impact quickly, frequently, and with confidence
- A software organization delivering meaningful value
These goals sound simple enough, but in reality, achieving them requires more than just wishing for better performance. It takes data, action, and, most importantly, a cultural shift. And here's the catch: those three things don't come together by accident.
In my experience, whenever a large-scale change fails, there's one common denominator: a lack of a cohesive strategy. Every time I’ve witnessed a failed attempt at implementing new technology or making a big shift, the missing piece was always that strategic foundation. Without a clear, aligned strategy, you're not just wasting resources—you’re creating frustration across the entire organization.
Sign up for a free, expert-led insights strategy workshop for your enterprise org.
Step 1: Define Your Purpose
The first step in any successful engineering insights strategy is defining why you're doing this in the first place. If you're rolling out developer productivity metrics or an insights platform, you need to make sure there’s alignment on the purpose across the board.
Too often, organizations dive into this journey without answering the crucial question: Why do we need this data? If you ask five different leaders in your organization, are you going to get five answers, or will they all point to the same objective? If you can’t answer this clearly, you risk chasing a vague, unhelpful path.
One way I recommend approaching this is through the "Five Whys" technique. Ask why you're doing this, and then keep asking "why" until you get to the core of the problem. For example, if your initial answer is, “We need engineering metrics,” ask why. The next answer might be, “Because we're missing deliverables.” Keep going until you identify the true purpose behind the initiative. Understanding that purpose helps avoid unnecessary distractions and lets you focus on solving the real issue.
Step 2: Understand Your People
Once the purpose is clear, the next step is to think about who will be involved in this journey. You have to consider the following:
- Who will be using the developer productivity tool/insights platform?
- Are these hands-on developers or executives looking for high-level insights?
- Who else in the organization might need access to the data, like finance or operations teams?
It’s also crucial to account for organizational changes. Reorgs are common in the enterprise world, and as your organization evolves, so too must your insights platform. If the people responsible for the platform’s maintenance change, who will ensure the data remains relevant to the new structure? Too often, teams stop using insights platforms because the data no longer reflects the current state of the organization. You need to have the right people in place to ensure continuous alignment and relevance.
Step 3: Define Your Process
The next key component is process—a step that many organizations overlook. It's easy to say, "We have the data now," but then what happens? What do you expect people to do with the data once it’s available? And how do you track if those actions are leading to improvement?
A common mistake I see is organizations focusing on metrics without a clear action plan. Instead of just looking at a metric like PR cycle times, the goal should be to first identify the problem you're trying to solve. If the problem is poor code quality, then improving the review cycle times might help, but only because it’s part of a larger process of improving quality, not just for the sake of improving the metric.
It’s also essential to approach this with an experimentation mindset. For example, start by identifying an area for improvement, make a hypothesis about how to improve it, then test it and use engineering insights data to see if your hypothesis is correct. Starting with a metric and trying to manipulate it is a quick way to lose sight of your larger purpose.
Step 4: Program and Rollout Strategy
The next piece of the puzzle is your program and rollout strategy. It’s easy to roll out an engineering insights platform and expect people to just log in and start using it, but that’s not enough. You need to think about how you'll introduce this new tool to the various stakeholders across different teams and business units.
The key here is to design a value loop within a smaller team or department first. Get a team to go through the full cycle of seeing the insights, taking action, and then quantifying the impact of that action. Once you've done this on a smaller scale, you can share success stories and roll it out more broadly across the organization. It’s not about whether people are logging into the platform—it’s about whether they’re driving meaningful change based on the insights.
Step 5: Choose Your Platform Wisely
And finally, we come to the platform itself. It’s the shiny object that many organizations focus on first, but as I’ve said before, it’s the last piece of the puzzle, not the first. Engineering insights platforms like Code Climate are powerful tools, but they can’t solve the problem of a poorly defined strategy.
I’ve seen organizations spend months evaluating these platforms, only to realize they didn't even know what they needed. One company in the telecom industry realized that no available platform suited their needs, so they chose to build their own. The key takeaway here is that your platform should align with your strategy—not the other way around. You should understand your purpose, people, and process before you even begin evaluating platforms.
Looking Ahead
To build a successful engineering insights strategy, you need to go beyond just installing a tool. An insights platform can only work if it’s supported by a clear purpose, the right people, a well-defined process, and a program that rolls it out effectively. The combination of these elements will ensure that your insights platform isn’t just a dashboard—it becomes a powerful driver of change and improvement in your organization.
Remember, a successful software engineering insights strategy isn’t just about the tool. It’s about building a culture of data-driven decision-making, fostering continuous improvement, and aligning all your teams toward achieving business outcomes. When you get that right, the value of engineering insights becomes clear.
Want to build a tailored engineering insights strategy for your enterprise organization? Get expert recommendations at our free insights strategy workshop. Register here.Register here.
Andrew Gassen has guided Fortune 500 companies and large government agencies through complex digital transformations. He specializes in embedding data-driven, experiment-led approaches within enterprise environments, helping organizations build a culture of continuous improvement and thrive in a rapidly evolving world.
All Articles
By 2025, McKinsey anticipates that the majority of enterprise employees will leverage data to improve decision-making and automate activities. This doesn’t come as a surprise to folks who have witnessed first-hand how important data is for modern enterprises. Engineering data, in particular, provides valuable insights into team performance and enables businesses to make informed decisions to improve the flow of work.
While many companies will use data in the next year, not all will be at the same stage in their journey — some will have just begun looking at their organization’s data, while others will already have a culture of analytical rigor and data-driven decision-making in place. As businesses mature in their data journey, what they measure and how they act on it evolves; it takes time to get comfortable working with data.
At Code Climate, we’ve had the honor of guiding leading enterprises on this journey and have identified five common stages organizations go through, as well as key milestones and goals that characterize each stage. Most companies begin by using data to inform basic decisions before they are able to leverage it to systematically improve predictability, team health, and efficiency. The organizations that are most mature in their use of data continue to find new ways to prioritize learning, embrace measurement, and celebrate successes, even when they appear to have achieved them. Here’s a look at the five phases of the data journey and how engineering leaders can use metrics to improve productivity and performance at each stage.
Stage 1: Introduce data-driven processes and decision-making
Introducing data-driven processes and decision-making is the first step in instilling analytical rigor and replacing gut feelings with objective data. In this foundational stage, organizations begin to set, measure, and automate reporting for team goals and objectives and key results (OKRs). Establishing goals and measuring progress against them is key to driving a culture of continuous improvement.
Organizations beginning to utilize data will need to start the work of mapping engineering outcomes back to business objectives, and choosing relevant goals. For example, if an organization is looking to reduce disruptions due to incidents and bugs, engineering may want to focus on improving a metric like Change Failure Rate, which measures the percentage of deployments causing failures in production. If there’s a critical feature that engineering is working to get to market, it may be more important to look at something like Cycle Time, which serves as a measure of engineering speed. At this stage, some enterprises also combine engineering and business metrics in a business intelligence (BI) tool to get a comprehensive view of the organization's performance.
As long as business objectives remain top-of-mind, it can also be instructive to look at big-picture measures of speed, output, and quality across teams. This can help highlight areas for improvement and reveal best practices that can be useful if adopted throughout the organization.
In order to access their data and attendant insights, many organizations leverage a Software Engineering Intelligence (SEI) platform like Code Climate, which automatically cleans, links, and normalizes data gleaned from the tools engineers are already using. An SEI platform provides visibility into engineering practices to help leaders boost productivity and efficiency, improve team health, and maximize engineering impact. Code Climate's platform integrates with common BI tools via an API to facilitate seamless data collection and analysis.
Stage 2: Gain critical visibility and predictability
Once organizations have introduced data-driven processes, they can leverage insights from engineering data to identify areas in need of improvement, like flawed code review processes or poor communication. Having visibility into what teams and individuals are working on also provides insights into workload distribution and potential bottlenecks. It helps teams prioritize tasks, make informed decisions, and align efforts with organizational goals. Proactively revealing unplanned engineering work helps manage and allocate resources to minimize disruptions and delays.
At this stage, having standardized measures enables unification of reporting across business units, making it possible to get a holistic view of engineering performance and facilitate data-driven decision-making at both the team and organizational levels. It also helps engineering organizations understand performance across teams to identify top performers and areas for improvement. For example, metrics like PR Throughput, Cycle Time, and Time to First Review help large organizations, like Faire, identify changes in team performance that might signal issues to be addressed. Faire has leveraged these insights to help teams hit record output levels per person, increasing PR Throughput by 60% and Push Count by 65% in a single year, all while nearly quadrupling the size of their engineering team.
Stage 3: Use engineering metrics to optimize team health
Once a team has created a productive culture around data and understands what data can reveal about its organization, it can then take on the more nuanced work of using data to improve team health. It's not until developers feel safe with metrics and understand how they can be used that this will be done well, but once an organization is ready, data can be a critical tool for coaching, setting goals, and instituting best practices.
At this stage, engineering managers can use metrics to better coach their teams and identify areas for improvement. Analyzing engineering metrics will reveal top-performing teams and individuals, allowing leaders to set best practices, share knowledge, and provide support where needed. Standardizing code reviews based on data helps maintain code quality and proactively identify potential roadblocks or areas of improvement. Additionally, engineering metrics enable organizations to measure new hires’ contributions and ramp time to assess their progress and integration into the team.
Stage 4: Improve the SDLC with software engineering efficiency metrics
Even the highest-performing organizations battle through bottlenecks and blockers to deliver quality code. Engineering leaders need visibility to identify recurrent slowdowns and inefficiencies so they can improve processes and help their teams become more efficient.
When developers see how data can help them improve, they can then work together to better team processes as well. Tracking key value stream metrics and other data points makes it possible for teams to accelerate software delivery by identifying areas of friction and working together to resolve them. Using an SEI platform provides a centralized view of metrics across the SDLC, enabling teams to gain insights and make informed decisions at each stage. Analyzing the different stages of the engineering process helps identify opportunities to reduce excess work and increase efficiency. For example, when the commercial real estate technology company, VTS, set Cycle Time as a north star metric, engineering teams could then isolate key segments of the development process with their corresponding metrics, for example, measuring Review Speed or Review Cycles as a way to gain deeper insight into the Code Review Process. They were also able to reinforce efficiency-focused best practices, like keeping PR Sizes small. Ultimately, they were able to boost their speed 30%, while also doubling their deployment frequency.
Using an SEI platform helps leaders ingest, link, and clean data from the engineering tools their teams are already using, so they can view metrics from across the SDLC. Doing this allows them to monitor the four DORA metrics — Deployment Frequency, Mean Lead Time for Changes, Mean Time to Recover, and Change Failure Rate — and other engineering metrics to benchmark to industry standards for software delivery and DevOps maturity.
Stage 5: Empower teams to build a culture of excellence
Top-performing organizations prioritize learning, embrace measurement, and celebrate successes so they can continue to excel. With coaching and process improvements in place, organizations will benefit from formalizing their project of continuous improvement. The previous four stages of the engineering data journey culminate in achieving this level of maturity.
At this stage, organizations often create a role or team dedicated to engineering excellence and enablement. This is often the phase when teams can best leverage frameworks to help them achieve continuous improvement, collaboration, and high performance.
Empowering teams to build a culture of excellence requires that managers have the tools to measure and improve their teams. With an SEI platform, engineering leaders can enhance planning accuracy, benchmark performance against top-performing organizations, embrace management frameworks like DORA and effectively communicate successes and impact to stakeholders. By implementing these practices, organizations foster a culture of continuous learning, growth, and excellence in their engineering teams, which leads to shipping more — and better — products.
To find out more about how an SEI platform can support you in your data journey, request a consultation.
Understanding the performance of engineering teams at large companies is no easy feat. For many, this is due to the diversity of processes across teams and the resulting complexity of collecting consistent data. Companies need a standard way of measuring and understanding engineering performance and a common language to communicate it to company leaders and individual contributors. In this article, we’ll discuss how large organizations leverage DORA metrics to do just that.
Using DORA DevOps metrics to communicate with leadership
In startups, engineering actions are often more directly linked to business goals, making it possible for leaders to understand what engineering is doing and communicate its impact. For example, if a startup is launching its flagship product, contributors from sales, marketing, and product management collaborate with engineering, often with executive support and oversight, to ensure the business goals are met. They consider what the product does, how it works, why it matters, who will benefit from it, and how it will be sold. Startups often have shared key performance indicators (KPIs) and operate on a single timeline.
Now scale that same workflow across dozens of teams launching and maintaining different products on varying timelines. While engineering will aim to align goals with business objectives, those goals may vary from team to team, and success will look different for each group. That’s why it’s crucial to establish which metrics are important to the company as a whole and create a framework to measure them. Establishing a framework to measure engineering success ensures that managers are measuring teams in a consistent and equitable way so they can identify and resolve bottlenecks to optimize the flow of work.
Using a framework like DORA is a great place to start. The four DORA metrics, Deployment Frequency (DF), Mean Lead Time for Changes (MLTC), Mean Time to Recover (MTTR), and Change Failure Rate (CFR), can be communicated to leadership to give them a holistic view of how the engineering organization is performing.When implementing DORA, it’s important that organizations start by agreeing on how these metrics will be measured. Unified calculations and standards (i.e. company-wide agreement on what is considered an "outage") are critical for measuring effectively throughout an organization. Standardizing on these four metrics and how they will be measured provides uniformity across teams and creates a common language between engineering and company leadership.
DORA metrics help teams balance speed and stability and are good big-picture checks into the health of the organization. Managers can use DORA to see how things are trending over time and spot when a team isn't working as expected. However, they must keep in mind that while it can be instructive to benchmark teams within an organization by identifying what high-performing teams are doing that others can learn from, it's important to note the context. Managers must understand that teams tasked with different kinds of work and different projects will naturally have variations in their DORA metrics, which is normal and expected.
Supporting developers with granular engineering metrics
Using DORA as the foundational framework across teams lets engineering leaders understand how a team is doing within the context of the broader organization and drill down into data from a specific team to learn more about the way it's working. DORA metrics can highlight areas worth attention, serving as a starting point from which managers and their teams can investigate the efficacy of their processes and make changes, then track the impact of those changes.
To do this, they can add context to the four DORA metrics and pair them with complementary metrics to get more insight into what’s happening with individual teams and what improvements might be useful. Common metrics pairings include:
- Change Failure Rate and Unreviewed Pull Requests. If a high CFR is correlated to a high percentage of unreviewed PRs, managers may consider adjusting the process to prevent unreviewed PRs from being merged and causing issues.
- Deployment Frequency and PR Size. If DF is low, managers can use PR size to investigate it. If large PRs are correlated with a low DF, they can coach team members to break work into smaller PRs to see if DF improves.
- Mean Time to Recovery and Revert Rate: A long MTTR could indicate a high Revert Rate, therefore disrupting production and lengthening the time it takes to recover from an unplanned outage or defect. If there’s a correlation, managers can drill down into each revert and see whether the issue is a defect or an undesirable change.
- Mean Lead Time for Changes and Cycle Time. If MLTC is high, it could indicate that Cycle Time is also high. Managers can view these metrics in tandem and dig deeper into related metrics like Time to Open, Time to Merge, and Time to First Review to find the root cause.
How DORA software creates a common language from ICs to the C-suite
Large companies can benefit from a Software Engineering Intelligence (SEI) platform to understand engineering performance at every level of the organization. It allows engineering managers to standardize measurement and reporting on the four DORA metrics to communicate performance to company leadership and ensure that the pace of work meets business needs. Managers can also combine DORA with other engineering metrics in their SEI platform to communicate with their teams to ensure they have what they need to be successful and roadblocks are quickly identified and removed.
Without a strong framework and a centralized platform to measure it, engineering data can become a tangled mess as the number of engineers at a company increases. Measuring DORA and complimentary engineering metrics in an SEI platform helps leaders make sense of their data to ensure that engineering work is optimized and aligned with business objectives.
To find out more about how an SEI platform can benefit leaders at large organizations, request a consultation.request a consultation.
Mapping Engineering Goals to Business Outcomes
When an engineer is deep in code, fixing a bug or completing a review, it can be hard to connect the dots between these actions and what seem like unrelated company objectives. In traditionally structured organizations, the business sets goals for engineering based on its understanding of the market, customer needs, and the numbers it must achieve to appease investors. Without a clear understanding of how engineering activities impact business objectives, it’s difficult for engineering leaders to make informed strategic decisions, keep teams aligned, advocate for resources, or communicate successes. Engineering leaders must understand these business objectives, map their work to them, and clearly communicate them to engineering teams and non-technical stakeholders.
Start With Why
Often, engineering is seen as a cost center, but in reality, it’s the main driver of revenue in many modern companies. When leaders help their teams understand the “why” behind their work, engineers can let go of the expectation that they must be busy and replace it with the expectation that they must create value. After all, building something right doesn’t matter if it’s not the right thing.
So, how do engineering leaders ensure that their teams’ work is aligned with the business's goals?
Discover Business Outcomes Driven by Engineering Work
Imagine a retail business that sells sporting goods. They want to allow shoppers to easily bundle gloves, sunglasses, baseball bats, and other baseball gear on their e-commerce site. To do this, engineering is tasked with building a widget that offers shoppers pre-defined selections, provides recommendations based on data about the shopper, and reveals an increased discount as more items are bundled. The goal is to have this feature live in February to capture sales for the spring sports season.
To understand the work that will go into this project and balance it with other priorities, engineering leaders should ask the following questions.
- What happens if it doesn’t get done? In this case, if the project isn’t done in February, the business risks missing its Q1 revenue targets. If it’s not completed according to spec, it may have other consequences depending on what changed. And if it’s not completed at all, the company may experience lower sales volume over a longer period of time.
- How does it benefit customers? The customers who care about a baseball gear bundle are likely parents of youth baseball players. The problem it solves for them is that it makes shopping easier, and it’s worth solving now because parents want an easy way to buy new gear at the beginning of the season.
- What happens if it gets completed earlier or better? There are no benefits to completing this project ahead of time, because before February, it will still be basketball season and parents won’t yet be shopping for baseball gear. However, if it’s completed with better quality, it may result in a higher checkout success rate, larger cart sizes, more sales, and ultimately more revenue. The final question in this set is what happens if it’s implemented differently. In this case, it depends on what changed.
All of these questions are intended to spark a conversation between engineering and business partners so they can understand the full scope of the request and produce the best possible outcome.
Frame Engineering Work According to Outcomes
By asking the questions above, the engineering team can learn three important things to guide their approach to the project.
- The deadline matters, but going faster doesn’t. To deliver this feature on time, engineering should keep speed-related metrics consistent, but they don’t need to improve them to achieve the goal.
- Levers can be used to optimize the result and prioritize the work. Finding ways to increase the cart size or the success rate at checkout can produce even better results for the business.
- There is a financial goal associated with this work. It’s clear to everyone on the team how their work impacts the business. If additional resources are needed to deliver the feature, it’s reasonable for engineering to pause other projects or ask to add members to the team.
At the beginning of the project, the engineering leader should look at other work in progress and complete a simple cost-benefit analysis to properly prioritize work. They may discover that another project, which is focused on redesigning the mobile app, has a low number of weekly coding days because the team is investing in research. Since it’s still in the research phase, the team doesn’t yet know the financial impact of a mobile redesign. However, they do know the expected impact of the baseball bundle widget, so shifting resources to it from the mobile redesign will redirect those resources to generating revenue instead of investing in a long-term project with an unclear return.
As the widget progresses, engineering metrics may reveal other changes that need to be made in order to meet the project’s requirements. For example, a high amount of Rework may indicate that work isn’t being planned properly, resulting in duplicated effort and wasted time. Or a large PR Size combined with slow Review Cycles may reveal that one person is handling all the PR reviews, so folks are batching up large amounts of work in each PR.
With an understanding of the tradeoffs inherent in the project, and the knowledge that a delayed or poor-quality widget would significantly impact revenue, an engineering leader would likely decide to make a change to resolve these issues. They might, for example, consider adding a dedicated project manager (PM) to the team to help improve the flow of work. A cost-benefit analysis will show that adding a dedicated PM can improve Traceability, Rework, and developer productivity, allowing the team to release the baseball bundle widget on time. This can result in a net gain of the projected sales from the bundle in Q1 due to increased cart size and checkout success.
Measure and Communicate the Success of Engineering Goals
The right data and context help developers connect the dots between their work and company objectives. Even bug fixes and code reviews carry a different weight when they’re seen in the context of a larger goal, like delivering the baseball bundle widget on time to meet Q1 revenue targets. Asking the questions outlined above and gathering insights in a Software Engineering Intelligence (SEI) Platform helps leaders map engineering work to business outcomes and clearly communicate them across the board.
Engineering leaders are under pressure to maximize their teams’ impact and tie outcomes to business goals, but to do this effectively, they need to shift how they measure and articulate their work and success. While change, especially in engineering, can be difficult to implement, many enterprise engineering organizations are moving toward a data-driven culture. Leaders can leverage actionable insights from data to move beyond gut feelings and make informed decisions that improve efficiency and overall organizational performance.
Let’s examine the key benefits of data-driven engineering and explore how leaders can create an environment for this important transition.
Key Benefits of Data-Driven Engineering
Embracing a data-driven engineering culture is essential for engineering leaders who want to drive success in their organizations. The following benefits consistently emerge when organizations place data front and center in engineering processes:
- Critical visibility and predictability
- Speed and efficiency within the software delivery life cycle (SDLC)
- Better productivity and team health
There are three types of metrics that are important to consider: process metrics, industry metrics and standards, and team health metrics.
Process metrics: Tracking and analyzing process metrics — such as Time to Open, Time to Merge, and Defect Rate — at the team level can provide valuable insights into the efficiency and quality of the development process. By monitoring these metrics, engineering leaders can identify bottlenecks, optimize workflows, and improve overall predictability.
Data also plays a vital role in enhancing the SDLC. Engineering leaders need to measure and optimize key aspects of the SDLC, such as code review time, or build and deployment cycle time. These metrics enable leaders to identify areas for improvement, streamline processes, and achieve faster and more efficient software development.
Industry metrics and standards: Well-defined, consistent metrics provide a common language to help understand how teams vary across the organization, how performance is trending over time, and how it compares to industry benchmarks. Consider DORA metrics, which are a common industry standard for understanding and communicating a high-level view of team and organizational health. The four DORA metrics — Change Failure Rate, Mean Time to Recovery, Deploy Frequency, and Mean Lead Time for Changes — help leaders understand how teams perform to make informed decisions.
Team health metrics: With data, team members can more easily track their progress against goals and identify areas of improvement or excellence. Fostering an organizational culture dedicated to coaching and career progress, where employees are empowered to choose their own paths and focus training based on data over gut feeling, enhances employee experiences. For instance, managers can use individual contributor data to identify engineers who might be struggling with a project or facing burnout. Or those who might be taking on more than a fair share of code reviews. Contributor data can also reveal rising stars for career advancement and promotion opportunities.
Leading a Data-Driven Cultural Change
Implementing change in enterprise engineering teams can be a challenging and complex process. It can be difficult and overwhelming to introduce new methods or tools — especially if it seems like the old processes are working. Creating a data-driven culture must be driven by leaders who clearly communicate, provide context, and champion the cause.
The Power of Communication
Engineers should be involved in change discussions — not only will this make it easier to achieve buy-in, but it will also have a positive impact on the outcomes of changes. Open communication creates trust between a leader and the team while ensuring everyone is on the same page. It also prevents misinterpretation and gives engineers the necessary information to adjust to a more data-driven culture. Leaders can achieve this by being transparent in the data they collect and the purpose behind it. Likewise, leaders must address engineers’ concerns and ensure their comfort with the proposed changes by listening to their feedback and making needed adjustments.
Contextualizing Team Performance
To fully understand team performance, leaders need to contextualize any data by considering various factors that are unique to each team. For instance, a production issue may arise for an infrastructure team, affecting performance metrics. Meanwhile, a feature delivery team may be more concerned with high throughput and rarely impacted by production issues and software bugs. By examining multiple data sources, gathering qualitative information from team members, and pairing key metrics, leaders can gain richer insights. They can also determine any external factors that contribute to the team’s performance while avoiding conclusions that would be unfair. These evaluations and contextualizations address their strengths and weaknesses, highlighting areas for improvement that team-focused initiatives can address.
Committing to and Championing the Change
The third point to note is the importance of leadership in committing to and championing the new processes that align with wider business goals. Once leaders have established the necessary changes, they should use data to demonstrate the positive impact that these changes will have on team performance and outcomes. Communication of progress and success to team members can improve organizational support.
Leaders should promote transparency in data collection and risk reduction to encourage team members’ comfort with the proposed changes. Contextualizing data makes it easier to separate factors that affect performance, and championing the change reinforces long-term engagement. Once the appropriate culture is in place, engineers must know how to put it into practice.
Harnessing Data to Improve Developer Experience
A data-driven culture is vital for high-performing engineering organizations. By fostering a culture of data-driven decision-making, they can harness the power of data to make informed decisions, optimize processes, and improve overall organizational performance and developer experience. Implementing changes based on validated insights is crucial for continuous improvement. So, empower your teams, transform company culture, and pave the way for a future of innovation and growth through data-driven engineering.

Alloy, a leading provider of financial risk solutions, was founded on a simple idea — the more data you have to make a decision, the more confident you’ll be in that decision. So, it's no surprise that Code Climate’s Velocity, a Software Engineering Intelligence (SEI) platform that provides rich insights on team performance and impact, has been a critical resource for their organization since 2021.
Velocity connects to the tools their teams use, then extracts and interprets data with added context to provide deep insights, analysis, and visualizations that make it easy to see and understand team health and performance. Metrics like PR Throughput, Time to Merge, and Cycle Time allow them to keep a pulse on team efficiency and identify any bottlenecks that might be impacting their ability to reliably deliver software.
“Of course, the data is out there, but using Velocity is so much faster and more convenient. The quality of presentation and reporting enables us to more easily consume the information, surface trends, and put our findings into action. And that is extremely valuable to us,” one engineering leader said.
Data from Velocity helps Alloy understand the impact of their teams and showcase improvements in execution. Since they started using the platform, they’ve seen improvements in metrics across the board. Some highlights include: reducing their Cycle Time by 57%, improving both Time to Open and Time to Merge by 55%, and, most notably, increasing PR Throughput per contributor by an incredible 388%.
Fostering Team Health and Talent
The ability to drill down to the contributor level gives leaders at Alloy meaningful insights to help with coaching and goal setting for individual engineers. There are many examples of managers using Velocity to identify high performers who might be looking for their next challenge, or team members who might not meet benchmarks and could benefit from additional coaching. Alloy team leaders often use data from the platform to reveal areas of strength and weakness to help guide engineering talent on paths of growth and success.
Another engineering leader explained: “It helps to have data and benchmarks to show both individuals and teams for coaching. We can set realistic targets and then showcase improvement and growth. Velocity is important to creating paths for success for our engineers and for fostering a healthy engineering culture.”
Key Highlights
- Reduced Cycle Time by 57%
- improved Time to Open by 55%
- Improved Time to Merge by 55%
- Increased PR Throughput per contributor by an incredible 388%
- Improved ability to set realistic targets and then showcase improvement and growth
To find out how Velocity can help your organization lean into data-driven decision-making, speak to a Velocity specialist.
Code Climate’s Software Engineering Intelligence (SEI) platform, Velocity, has been recognized by engineering leaders as a top platform in G2’s ranking of Software Development Analytics Tools. G2 is the world's most trusted software marketplace, and our ranking is based on reviews from engineering leaders who use Velocity to gain critical visibility into their SDLC and improve delivery and team health across their organizations. Code Climate earned two badges as a leader in the overall and Americas categories.
Here’s what people are saying.
"View your entire org. and identify challenges in five minutes a day"
“As organizations scale, it can be extremely hard for executives and leadership to understand which teams are impacted or blocked. Large organizations make it impossible and highly unproductive to spend much time in code reviews, PR reviews, or in standups, nor is it a smart use of time. Code Climate provides an easy-to-digest overview of team health, allowing you to identify which teams may be blocked and then focus on specific areas to unblock them.
Code Climate has been the single most valuable tool in my toolbelt through multiple companies and roles, and I would recommend it to any leader at an organization of any size."
— G2 Review, Ben N.
"Unprecedented levels of insights and visibility into engineering"
"Code Climate shows me the activity happening in the engineering organization and allows me to tie it into other activity and outcomes happening in other systems very easily. This allows me to have clear indicators of things like blockers or slowdowns that can receive intervention much earlier, and shows me patterns in team or organizational behavior that I can address managerially."
— G2 Review, Anonymous
Software Development Analytics Tools and SEI Platforms
As defined by G2, Software Development Analytics Tools, which include Software Engineering Intelligence (SEI) platforms, provide high-level insights into development progress using historical data. They allow engineering managers and leaders to see information about bottlenecks, engineering progress, what areas of code get the most attention, trends, and more to help teams improve efficiency and code quality.
To qualify for inclusion in G2’s Software Development Analytics Tools category, a product must:
- Integrate with one or more code repositories
- Consolidate a development team’s historical progress data in one place
- Highlight trends, important statistics, and KPIs
Code Climate Velocity meets these criteria and more. Velocity maximizes engineering impact for all levels at large organizations by providing data-driven visibility into engineering teams’ capacity, delivery, quality, culture, costs, and progress toward key goals. Velocity uses trusted and actionable insights to enable engineering and DevOps teams to drive change, improve predictability, and deliver business impact in a single platform.
Hear from more Code Climate users or leave your own review on our G2 page.

Google Cloud’s DevOps Research and Assessment (DORA) team’s 2023 Accelerate State of DevOps report examines the relationship between user-facing strategies, process enhancements, and culture and collaboration and its impact on engineering performance.
The DORA team re-emphasizes the importance of the four key DORA metrics, important benchmarks for gauging the speed and stability of an engineering organization. These metrics are a baseline for any engineering team looking to improve, and are a gateway for a more data-driven approach to engineering leadership. Pairing DORA metrics with other engineering metrics can unlock critical insights about a team’s performance.
However, the 2023 report makes significant strides in broadening out their approach to measurement. It recognizes that the four foundational metrics are an essential starting point, but also highlights additional opportunities for enhancing engineering performance. As teams continue on their data-driven journey, there are more dimensions of team health to explore, even in areas that don’t initially seem like they would lend themselves to measurement.
Two such areas highlighted in this year’s report are code review — an important window into a team’s ability to communicate and collaborate — and team culture.
Faster Code Reviews Accelerate Software Delivery
Notably, the report’s most significant finding indicates that accelerating the code review process can lead to a 50% improvement in software delivery performance. While many development teams are disappointed with their code review processes, they simultaneously recognize their importance. Effective code reviews foster collaboration, knowledge sharing, and quality control. And, according to the report, an extended time between code completion and review adversely affects developer efficiency and software quality.
At Code Climate, we’ve identified a few key strategies for establishing an effective code review process. First, it’s important for teams to agree on the objective of review. This ensures they know what type of feedback to provide, whether it’s comments pertaining to bug detection, code maintainability, or code style consistency.
It’s also important for leaders to create a culture that prioritizes code review. Ensure that your teams understand that in addition to ensuring quality, it also facilitates knowledge sharing and collaboration. Rather than working in a silo to ship code, developers work together and help each other. Outlining expectations — developers are expected to review others’ code, in addition to writing their own — and setting targets around code review metrics can help ensure it’s a priority.
Code Review Metrics
Leaders at smaller companies may be able to understand the workings of their code review process by talking to team members. However, leaders at enterprises with large or complex engineering teams can benefit from using a Software Engineering Intelligence (SEI) platform, like Code Climate, to act on DORA’s findings by digging into and improving their code review processes.
An SEI platform offers essential metrics like Review Speed, which tracks the time it takes from opening a pull request to the first review submission, and Time to First Review, which represents the average time between initiating a pull request and receiving the first review. These metrics can help leaders understand the way code is moving through the review process. Are PRs sitting around waiting for review? Are there certain members of the team who consistently and quickly pick PRs up for review?
Reviewing these metrics with the team can help leaders ensure that team members have the mindset — and time in their day — to prioritize code review, and determine whether the review load is balanced appropriately across the team. Review doesn’t have to be completely equally distributed, and it’s not uncommon for more senior team members to pick up a greater proportion of PRs for review, but it’s important to ensure that the review balance meets the team’s expectations.
A Note About Bottlenecks
The DORA report noted that even if code reviews are fast, teams are still unlikely to improve software delivery performance if speed is constrained in other processes. "Improvement work is never done,” the report advises, “find a bottleneck in your system, address it, and repeat the process."
Data from an SEI platform can help leaders continue the work of identifying and removing bottlenecks. Armed with the right information, they can enhance visibility and support informed decision-making, enabling them to detect bottlenecks in the software development pipeline and empower developers to collaborate on effective solutions. Equipped with the right data, leaders can validate assumptions, track changes over time, identify improvement opportunities upstream, scale successful processes, and assist individual engineers in overcoming challenges.
Fostering a Healthy Team Culture
Though the DORA team highlights the importance of effective processes, it also found that culture plays a pivotal role in shaping employee well-being and organizational performance. They found that cultivating a generative culture that emphasizes belonging drives a 30% rise in organizational performance. Additionally, addressing fair work distribution is crucial, as underrepresented groups and women face higher burnout rates due to repetitive work, underscoring the need for more inclusive work cultures. To retain talent, encourage innovation, and deliver more business value, engineering leaders must prioritize a healthy culture.
Just as they can provide visibility into processes, SEI platforms can give leaders insight into factors that shape team health, including leading indicators of burnout, psychological safety, and collaboration, and opportunities for professional development.
It’s fitting that the DORA report identifies code review as a process with a critical link to team performance – it’s a process, but it also provides insight into a team’s ability to collaborate. Metrics like Review Speed, Time to first Review, and Review Coverage, all send signals about a team’s attitude toward and facility with collaboration.
Other data can raise flags about team members who might be headed towards burnout. The Code Climate platform's Coding Balance view, for example, highlights the percentage of the team responsible for 80% of a team’s significant work. If work is uneven — if 10% of the team is carrying 80% of the load — it can indicate that some team members are overburdened while others are not being adequately challenged.
Data is the Key to Acting on DORA Findings
The findings from the DORA report are clear: even those teams that are successfully using the four DORA metrics to improve performance should look at other dimensions as well. Prioritizing process improvements like code reviews and promoting a healthy team culture are instrumental to performance — and data can help leaders learn more about these aspects of their team. Request a consultation to find out more about using an SEI platform to action the 2023 DORA findings.

EverQuote prides itself on having a data-driven culture. But even with this organization-wide commitment, its engineering team initially struggled to embrace metrics that would help them understand and improve performance. Many leaders would give up after a failed attempt, but Virginia Toombs, VP of Engineering Operations, took a step back to understand what went wrong so they could try again — and succeed.
Along the way, the EverQuote team learned what to avoid when implementing engineering metrics and how to successfully roll them out. For them, it was all about empowering team members, collecting actionable data in the right platform, and correlating metrics for a more holistic view of what was happening across the organization.
Lessons Learned About Measuring Engineering Productivity
When EverQuote decided to measure engineering productivity a few years ago, it started by purchasing a tool, like many organizations commonly do. But it encountered problems as it hadn’t considered what to measure or how to leverage those insights to improve performance. Because EverQuote didn’t know which engineering metrics best suited its unique team and processes, it ended up with a tool that didn’t have mature throughput or flow metrics — two things it would learn were core to its success. The result? Virginia and her team saw detailed engineering metrics but lacked a comprehensive view of the organization’s performance.
This issue caused a domino effect. Measuring only granular metrics made team members feel that individual performance was being judged, rather than the process itself, and enthusiasm for the program came to a halt. That’s when the engineering operations team decided to rethink the approach and start from scratch.
Using Metrics to Improve Developer Experience
EverQuote’s engineering operations team is a central function within engineering whose main goal is to create an environment where engineers can thrive. This team optimizes processes, encourages collaboration, and coaches on agile techniques. For them, it’s essential to understand how engineering processes are performing so they can make data-driven decisions to improve. This team made two important decisions when rolling out engineering metrics for the second time.
First, they took the time to understand which engineering metrics applied to their organization. Rather than starting with granular metrics, they decided to lead with the big picture, adopting the four original DORA metrics: Deployment Frequency (DF), Mean Lead Time for Changes (MLTC), Mean Time to Recover (MTTR), and Change Failure Rate (CFR). From these high-level metrics, they would still be able to identify bottlenecks or issues and drill down into more granular metrics as needed.
To support DORA, and to provide visibility into its corresponding metrics, EverQuote adopted Code Climate. With Code Climate's Software Engineering Intelligence platform, they could identify organizational trends, look at data by teams or applications, and dig into specific DORA metrics. For example, if they see that MLTC is high, they can click into it to see exactly where the holdup is — maybe a long Time to Open or Time to First Review is preventing the PRs from getting to production as expected. Starting at a high level helps them understand their systems holistically, and then they can drill down as needed, which is more efficient and saves team members from metric fatigue.
Second, they empowered teams to own their metrics by educating them in how to read and interpret the data, and creating processes to discuss performance at the end of a sprint. They held these conversations as a team, not during one-on-ones, and focused on how they could better collaborate to improve as a unit. This strategy exemplifies one of EverQuote’s core principles: If you work as a team, you succeed as a team.
Successfully Implementing DORA DevOps Metrics
The EverQuote journey to measurement has come full circle. Now, engineers embrace engineering metrics as a tool for continuous improvement. After two iterations of implementing metrics, the team has learned three major lessons for successful adoption:
- Collect data you plan to act on. Although measuring and tracking every possible engineering metric may be tempting, it can prevent you from seeing the forest for the trees. Instead, be intentional about the metrics that your organization can derive insights from to take action.
- Correlate metrics and drill down as needed. Measuring DORA metrics gives EverQuote a full view of how engineering systems work at any given time. Being able to double-click into them in Code Climate's platform lets them quickly identify and resolve the root cause of an issue when it arises.
- Use consistent data. EverQuote has 17 engineering teams spread across multiple functions and locations. To maintain consistency, they align on how metrics will be defined and calculated. This process is essential to ensure they speak the same language and can benchmark against other teams and the industry.
Combining DORA DevOps metrics with other engineering metrics in Code Climate's insights platform has helped EverQuote nurture its data-driven culture. To learn more about successfully rolling out engineering metrics within your organization, request a consultation.
Objective data is a necessary complement to engineering leadership. By digging into the key metrics of the Software Development Life Cycle (SDLC), leaders can better assess and improve engineering processes and team performance.
Each organization may choose to focus on a different set of engineering metrics based on their goals. Our collaboration with thousands of organizations has revealed a key set of metrics that have proven valuable time and again, including Review Cycles, a key factor in Pull Request (PR) Cycle Time.
In this blog, we’ll dig into the importance of the Review Cycles metric, what it can tell you about the health of your teams and processes, and how to improve it.
What is the Review Cycles metric?
The Review Cycles metric refers to Pull Request reviews, and measures the number of times a PR goes back and forth between an author and reviewer.
The Pull Request review process is an essential component of PR Cycle Time, which measures the time from a first commit in a pull request being authored to when that PR is merged, and looking at Pull Request data can help leaders understand teams’ Time to Market and baseline productivity over time.
Whether the PR is created to ship a new feature or fix a bug, for example, the proposed change needs to be reviewed by a member of the team before it is merged. If that PR gets approved and merged with no further interaction from the author, then the Review Cycle is 1 — the changes were reviewed and approved in a single cycle.
If a PR does not get approval and requires changes, then the author must make an additional commit. The reviewer then checks the new version before it is approved. In this scenario, the number of Review Cycles is 2. Of course, this number increases as the PR is passed back and forth between author and reviewer.
Why should teams measure Review Cycles?
Pull Requests require software engineers to context switch and focus on one particular line of work. When this happens often, and Review Cycles are high, the PR review process can spread engineers’ attention too thin. It can also become a bottleneck to shipment.
Finding the cause of a slow PR review process
There are various reasons why Review Cycles may be high:
- There are differing ideas around what “done” means.
- There’s misalignment around what kind of changes are expected to come out of a review process, or
- There are conflicting opinions about how a solution should be implemented.
If the Review Cycle metric is high for a particular submitter, it could mean that they’re struggling with the codebase or dealing with unclear requirements.
Be mindful of potential biases in the PR review process
While data can offer a concrete number of Review Cycles for a specific PR, it does not tell the whole story. If a specific developer has a high number of Review Cycles tied to their work, engineering leaders should open a dialogue with both the developer and reviewer to pinpoint potential cause.
Sure, they may be struggling with the codebase because they are new to it, but it’s also possible that their teammates may be unfairly scrutinizing their work. There are a number of potential biases that could be skewing perception of ICs and their work. One engineering leader was able to use data from Code Climate's platform to uncover that a woman engineer’s PRs were moving disproportionately slower than those of her male counterparts and concluded that bias was a problem within the team.
To identify what’s affecting your teams’ Review Cycles and PR review process overall, examining the data will give you a starting point to have a conversation with the team and ICs involved so you can align on processes.
Review Cycles can help leaders assess onboarding and Ramp Time
When a developer first joins a team, it may take time for them to get up to speed. Looking at Review Cycles in a Software Engineering Intelligence (SEI) platform allows leaders to observe changes and progress over time. With these insights, you can measure the ramp time for newly onboarded engineers by observing whether their Review Cycles decrease over time. If Review Cycles for new hires are not decreasing at the expected rate, leaders may want to further investigate the efficacy of onboarding processes and ensure that new developers have the tools they need to excel in their roles.
Using data to improve Review Cycles and help engineers get unstuck
When you use a Software Engineering Intelligence (SEI) platform like Code Climate, you can gain visibility into the entire PR review process. The Analytics module in Code Climate's platform is a good place to investigate PR review processes. You’ll want to run a query for Review Cycles, or the number of times a Pull Request has gone back and forth between the author and reviewer. Here’s how:
Click on the arrow next to the Review Cycle number to see all of Hecate’s individual PRs from the selected timeframe. Sort the number of Review Cycles from high to low and start with the ones that have been open the longest. In this case, the top two PRs, which have both undergone 4 Review Cycles and are still open, are worth bringing to a standup, retro, or 1-on-1.
Talk to your team to improve your PR review process
Prepare for a standup, retro, or 1-on-1 with developers by taking a look at Pull Request data. This will allow you to be more informed ahead of a meeting, and be able to focus specifically on units of work rather than developers or teams themselves.
Ask your team questions about specific PRs with high Review Cycles to uncover where the misalignment is happening. Work with the team to find solutions to limit the amount of times a PR is volleyed back and forth by establishing what is expected in a review, how solutions should be implemented, and when a review is complete. Document best practices for the Pull Request review process to use as a reference in the future.
How many Review Cycles should you target in the PR review process?
Code Climate has produced proprietary benchmarks that engineering leaders can use. We have found that the top 25% of organizations have an average of 1.1 Review Cycles or less, whereas the industry average is 1.2 cycles. If Review Cycles are above 1.5, it’s time to investigate why.
Review Cycles are one of many critical metrics that engineering leaders can measure to understand and improve team health and processes. By looking at Review Cycles alongside other Pull Request-related metrics, you can uncover the cause of a slowdown and make informed decisions towards improvement. The data is only a starting point, however — it’s essential that leaders speak directly to teams in order to find a sustainable solution.
Request a consultation to learn how measuring engineering metrics can lead to faster software delivery and healthier teams.